Is The Advance Complete?
 By
By
In last weekend’s update I wrote: "Most models continue on buys. The secret indicator combo is still neutral however. Razzmatazz waves directionally look bearish even though the options data by itself does not look that bad. NYHL1M and its components continue to keep us on the right side of the market and we do not need to overthink things as long as this is the case. Since the Micro1 buy on Dec 4th, we are up more than 110 points on ES. My guess is that we are nearing a sell signal on micro1 and whenever this happens, we will take a profit on our long trade in QLD and any futures positions. I think we do have enough energy to get up to the 3240-3250 area before turning. But let us use the micro1 signal to tell us when exactly to exit our long trade - because remember - the path of least resistance in the market right now is still higher."
What actually happened is that the Emini S&P 500 (ES) got slightly above the 3250 area before pulling back into the close on Friday.
What next? Most models continue on buys. The secret indicator combo went to a buy for a day and then turned back to neutral again. Options data by itself looks somewhat bullish. But the razzmatazz waves continue to show a bearish posture directionally. We continued to show strength for most of last week before pulling back on Friday. I am not sure if the advance is complete and we get a bigger pullback or if there is one more push higher left. Next resistance higher is at 3260-65 area. And support below is at the 3225-21 area. A break of this area at a minimum is required to start entertaining more bearish possibilities. We will continue to hold our long trade from December 4th as long as micro1 holds to a buy - it is getting closer to a sell/exit trigger - but not there yet.
ES Grey Zone areas - The grey zones on the ES 5 min chart below are what I draw in on a discretionary basis - they are supports and resistance areas which the market is most likely to react from. If we test a zone from below, it is likely to be rejected and fall lower to test support zones below. If we test a zone from above, it is likely to take support there and begin a move higher. So these zones can be used for intraday trading and/or as entry points for positioning for swing trades. These zones are drawn in based on what the market has done there previously both on smaller and larger timeframes.
Grey zone resistance at 3238-42 and then at 3250-54.. Support is at 3225-3221, 3199-3203, 3188-83 and then at 3150-57.
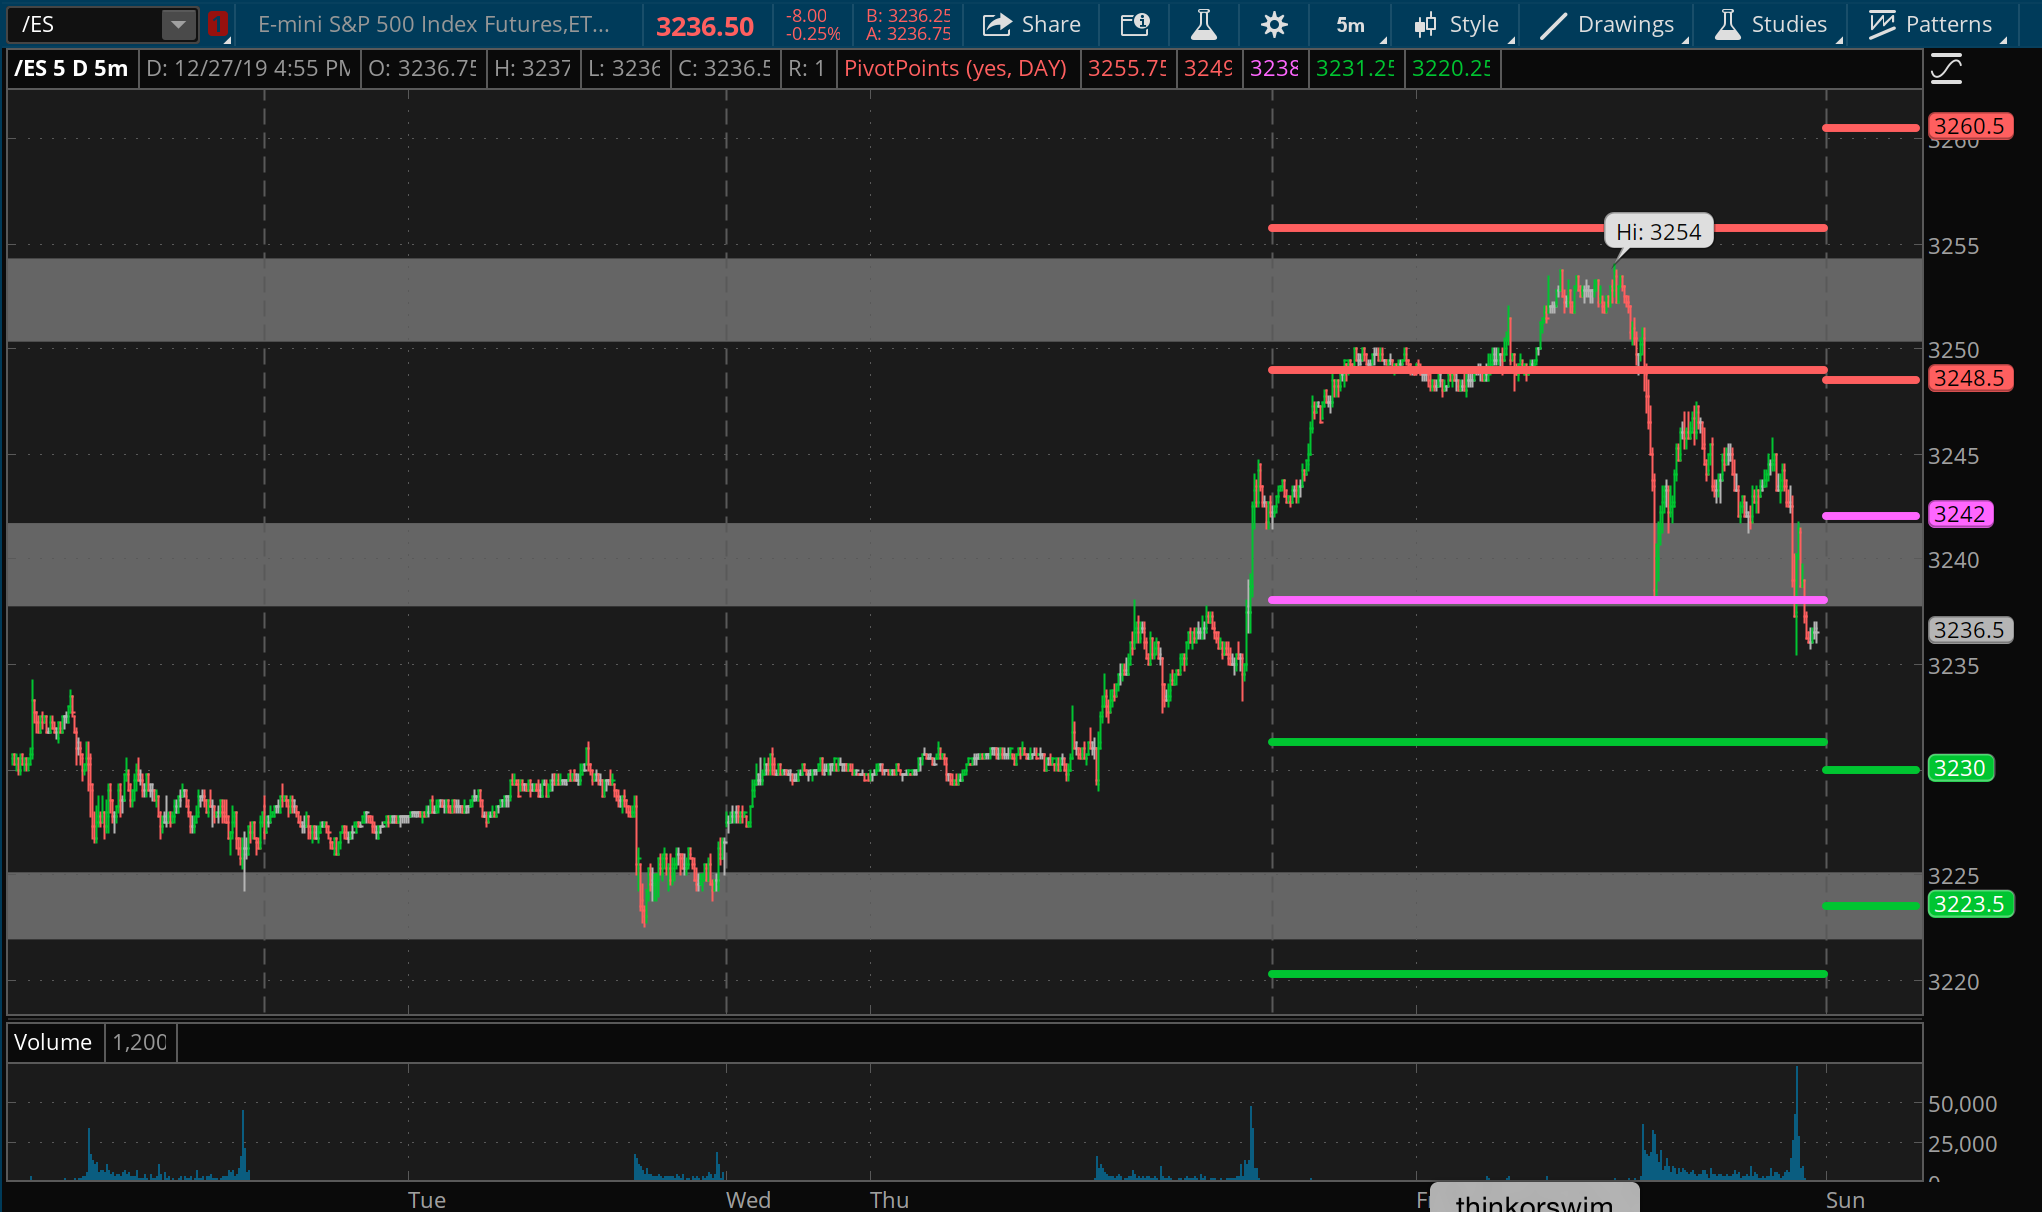
Daily pivot is at 3242. Resistance R1 is at 3248.5 and R2 at 3260.5. Support S1 is at 3230 and S2 at 3223.5.
All the best to your trading week ahead.
