Indicators Still Signaling Long
 By
By
In our update last weekend we wrote: "My view is that we may have seen a bottom late last week and we have one more leg higher into the 3750+ area."
What actually happened is after some weakness to start off the week, the market continued to grind higher closer to our target areas.
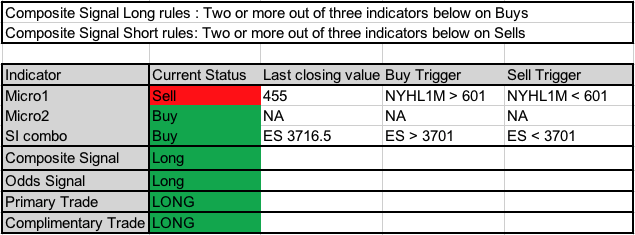
Looking ahead, options data is bullish. Internals are holding a somewhat bullish posture, but the short-term Micro1 indicator continues on the sell side. Price action is short-term bullish, medium-term bullish and long-term bullish. Our Odds indicator continues to hold long, and our Composite indicator went back to a buy signal. So we added to our long side trade via the primary trade rules. We now have both the primary and complimentary trades long and holding.
My view has not changed from that of last week. Still looking for a move higher into the 3775/3800 area in the Emini S&P 500 (ES). I still do not see us as having enough energy to go to 4000+ immediately -- not before a reset in the markets. Regardless, we still trade based on what our indicators and signals are saying, which for now is long both on the Primary and Complimentary trades.
Regarding our zones and pivots, grey zone resistance is at 3732-3740 and then at the 3765-75 area. Support is at 3705-3698, 3683-73, 3646-36, 3624-17, 3591-80, and then at 3551-42.
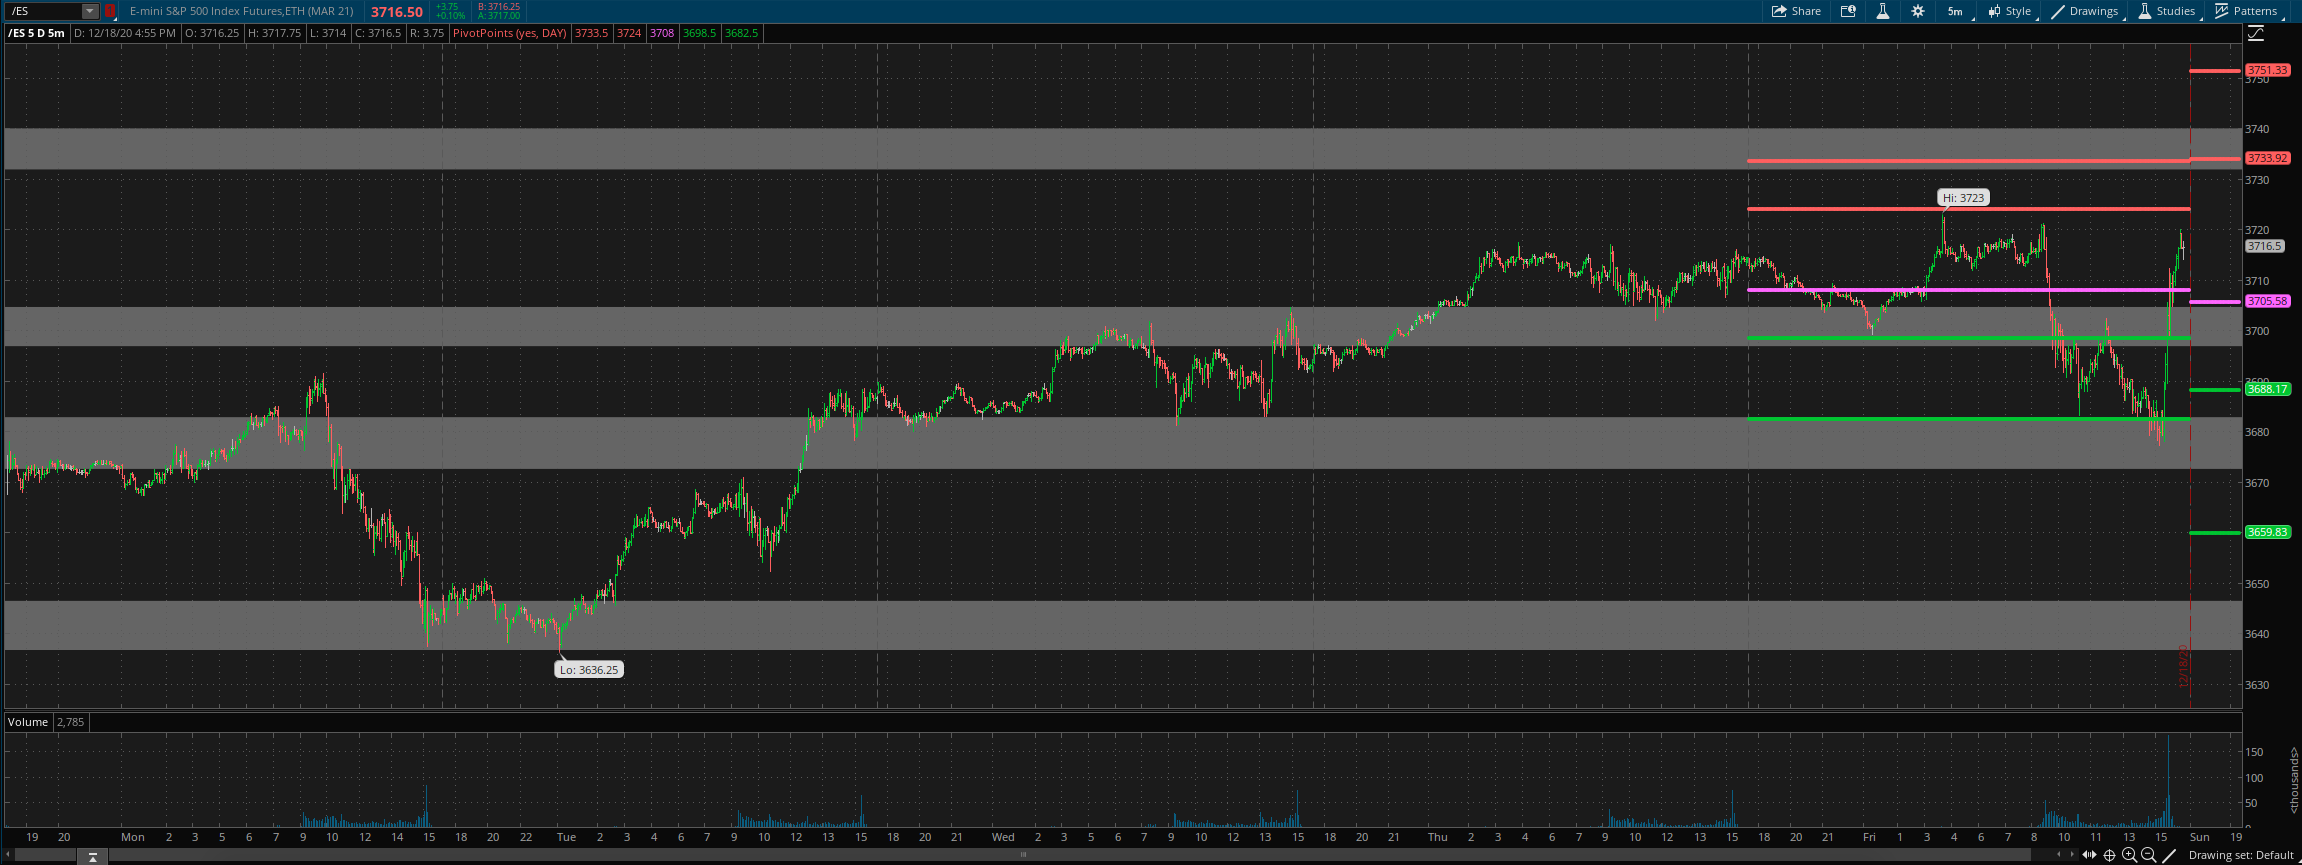
For Monday, daily pivot is at 3705.5. Resistance R1 is at 3734 and R2 at 3751.5. Support S1 is at 3688 and S2 at 3660.
Gold: I wrote about the Gold Odds Signal here.... read it if you missed it. It is a great way to trade the metals complex both long and short. It caught the Aug 5th top to perfection.. and got the recent bottom while not to perfection, pretty close. We are now doing Gold trades alerts also officially in the SM room.. with entries, stops and exits.
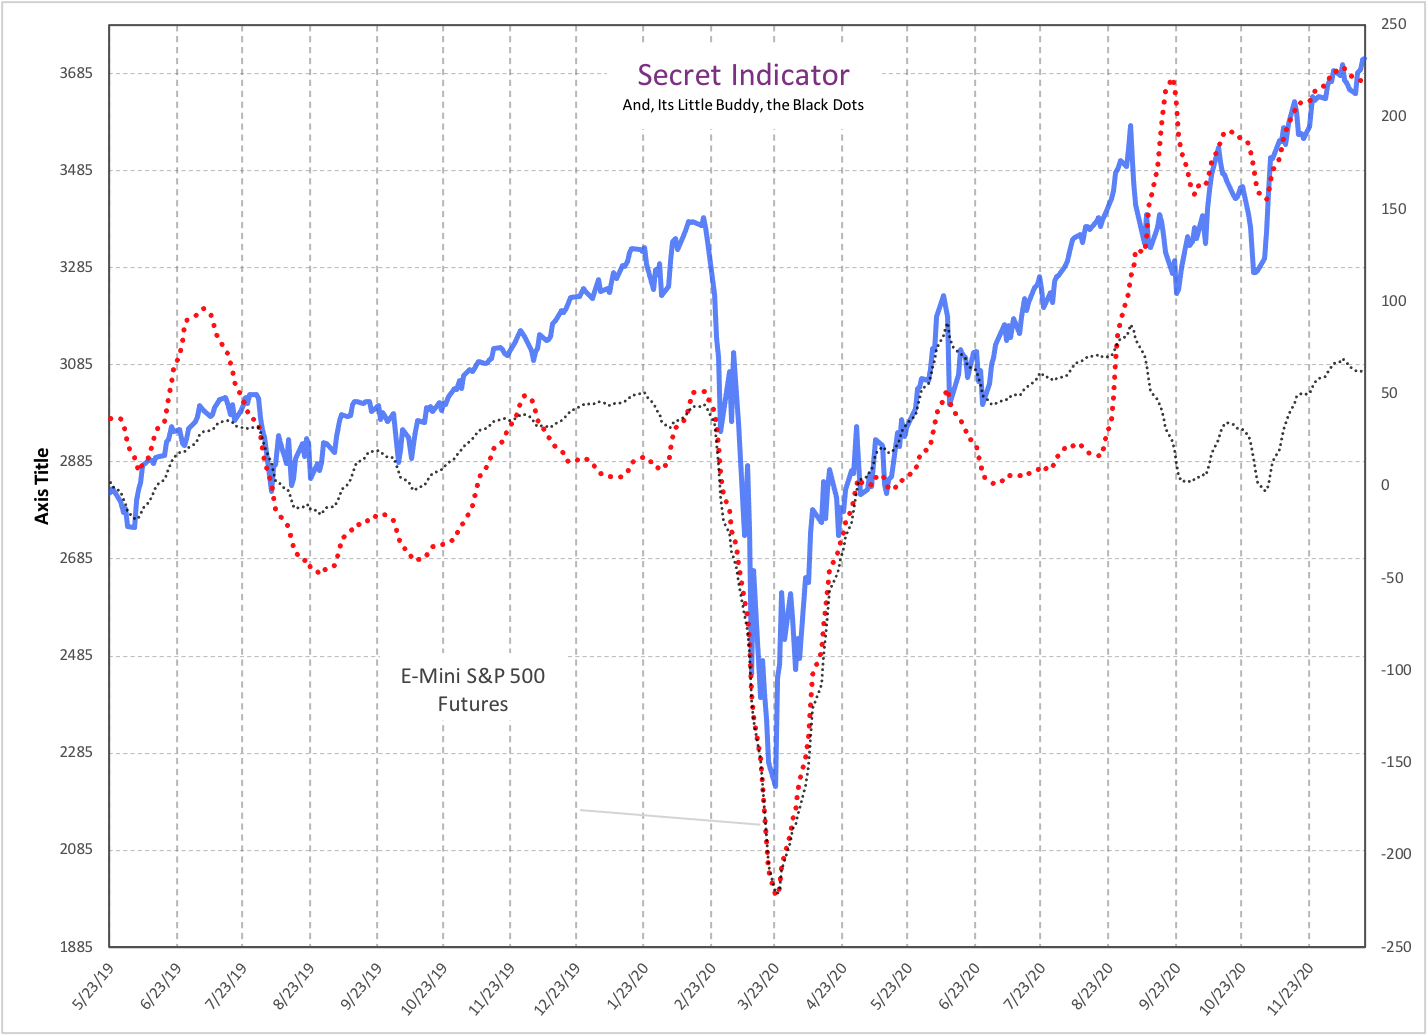
Some additional charts from the SM room: Usually I just post the excerpt or conclusion that you see above in the main room. But once in a while, I like to share some of the detailed charts so you can see what goes into arriving at the summary.
First of all the secret indicator and its buddy the black dots. This is an indicator developed by EHE... the arithmetic behind it is secret, but the way to use it is simple. When the secret indicator is going up, we do not short and try to be long as much as possible. When both of them are going up together, I call it trend UP and this is something we track in the smart money room. For example, the combo went to trend UP on the 9th of December at 3469 on ES and stayed in trend UP mode for the next 200 points. It then went to a sell for a few days before going back to a buy signal where it is at right now.
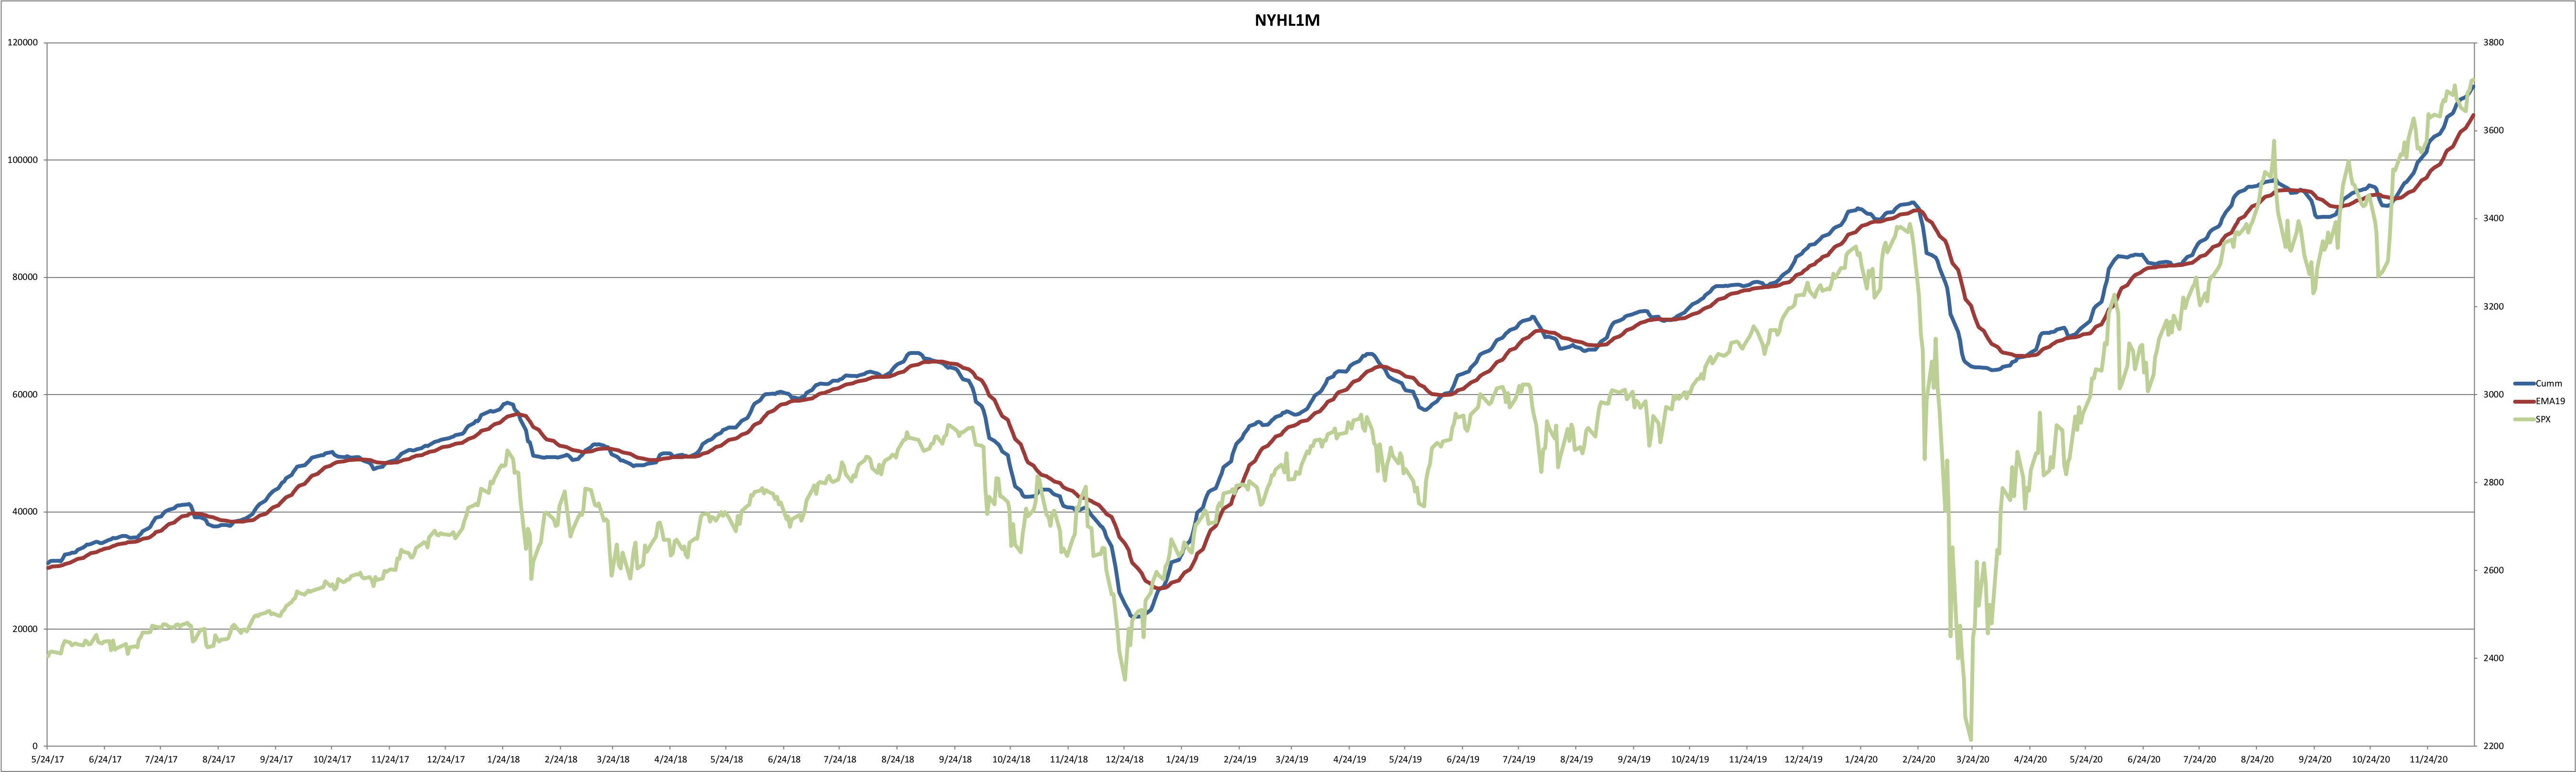
Next the NYHL1M indicator. I have written about this one extensively in the main room as well..... the math behind it is not secret. It is based on internal data or breadth of the market, namely new highs and lows on the NYSE index. And from this data, I have built a trend following model, which tends to keep you on the right side of the market instead of fighting the dominant trend of the market. The NYHL1M last went to trend UP mode in early November and is still in that mode.
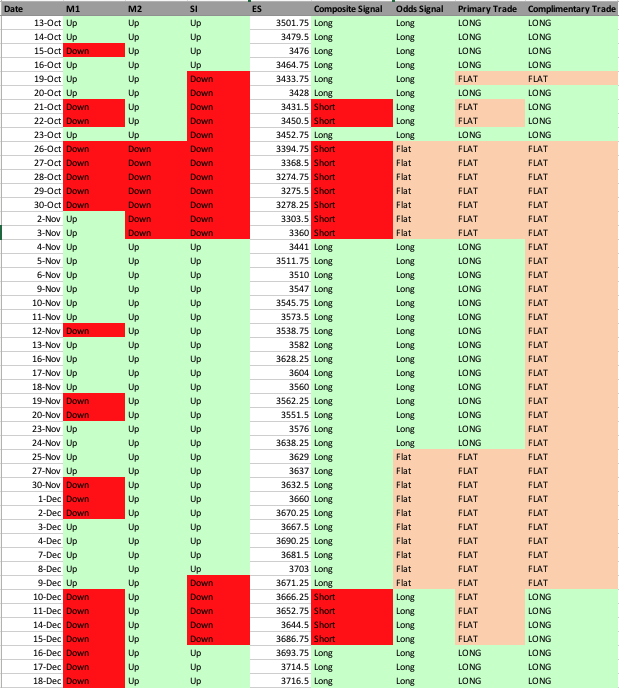
Next, these are the daily tracking sheets which I share in the SM room.... this shows our positioning based on the signals we track. And the day to day changes. It is a completely systematic rule based approach to trading -- no need to guess or overthink what the market is going to do next but rather just follow the signals.
Trade Parameters
System Snapshot
All the best to your trading week ahead.
