Indicators Sport A Mixed Picture
 By
By
The market continued to grind higher last week and we took profits on our trading longs toward the end of the week.
Options data is neutral on review today. Internals are mildly bullish. Price action is short term bullish, medium term bullish and long term bullish.
Our indicators continue to sport a mixed picture with some on buys and some on sells. Our NYHL1M core indicator went back to a buy. The Odds indicator has remained on a sell signal. Micro1 and 2 point in opposite directions. It is difficult to see much more continued upside with internals and indicators in this posture.
We were partially long into last week and booked profits toward end of the week. Our long-term portfolio, however, is still long, but trading position is flat now. If we get some weakness this coming week, it will push the Micro1 to a sell signal and it will mean at least a partial short trade.
On the other hand, if we get a shallow pullback that does not push internals/micro1 to a sell, we will look to re-enter a partial long position. So we have a few moving parts.
On price, I am expecting strong resistance to kick in in the 4440/50 area on the Emini S&P 500 (ES). On the downside, 4365/60 is strong support which needs to be broken for bears to get any traction lower.. We may set a bigger range between these two areas before a bigger decisive move can begin.
Grey zone resistance is in the 4440 area. Support is at 4415-22, 4389-97, 4374-65, 4342-32, 4309-4298 and then at 4279-69.
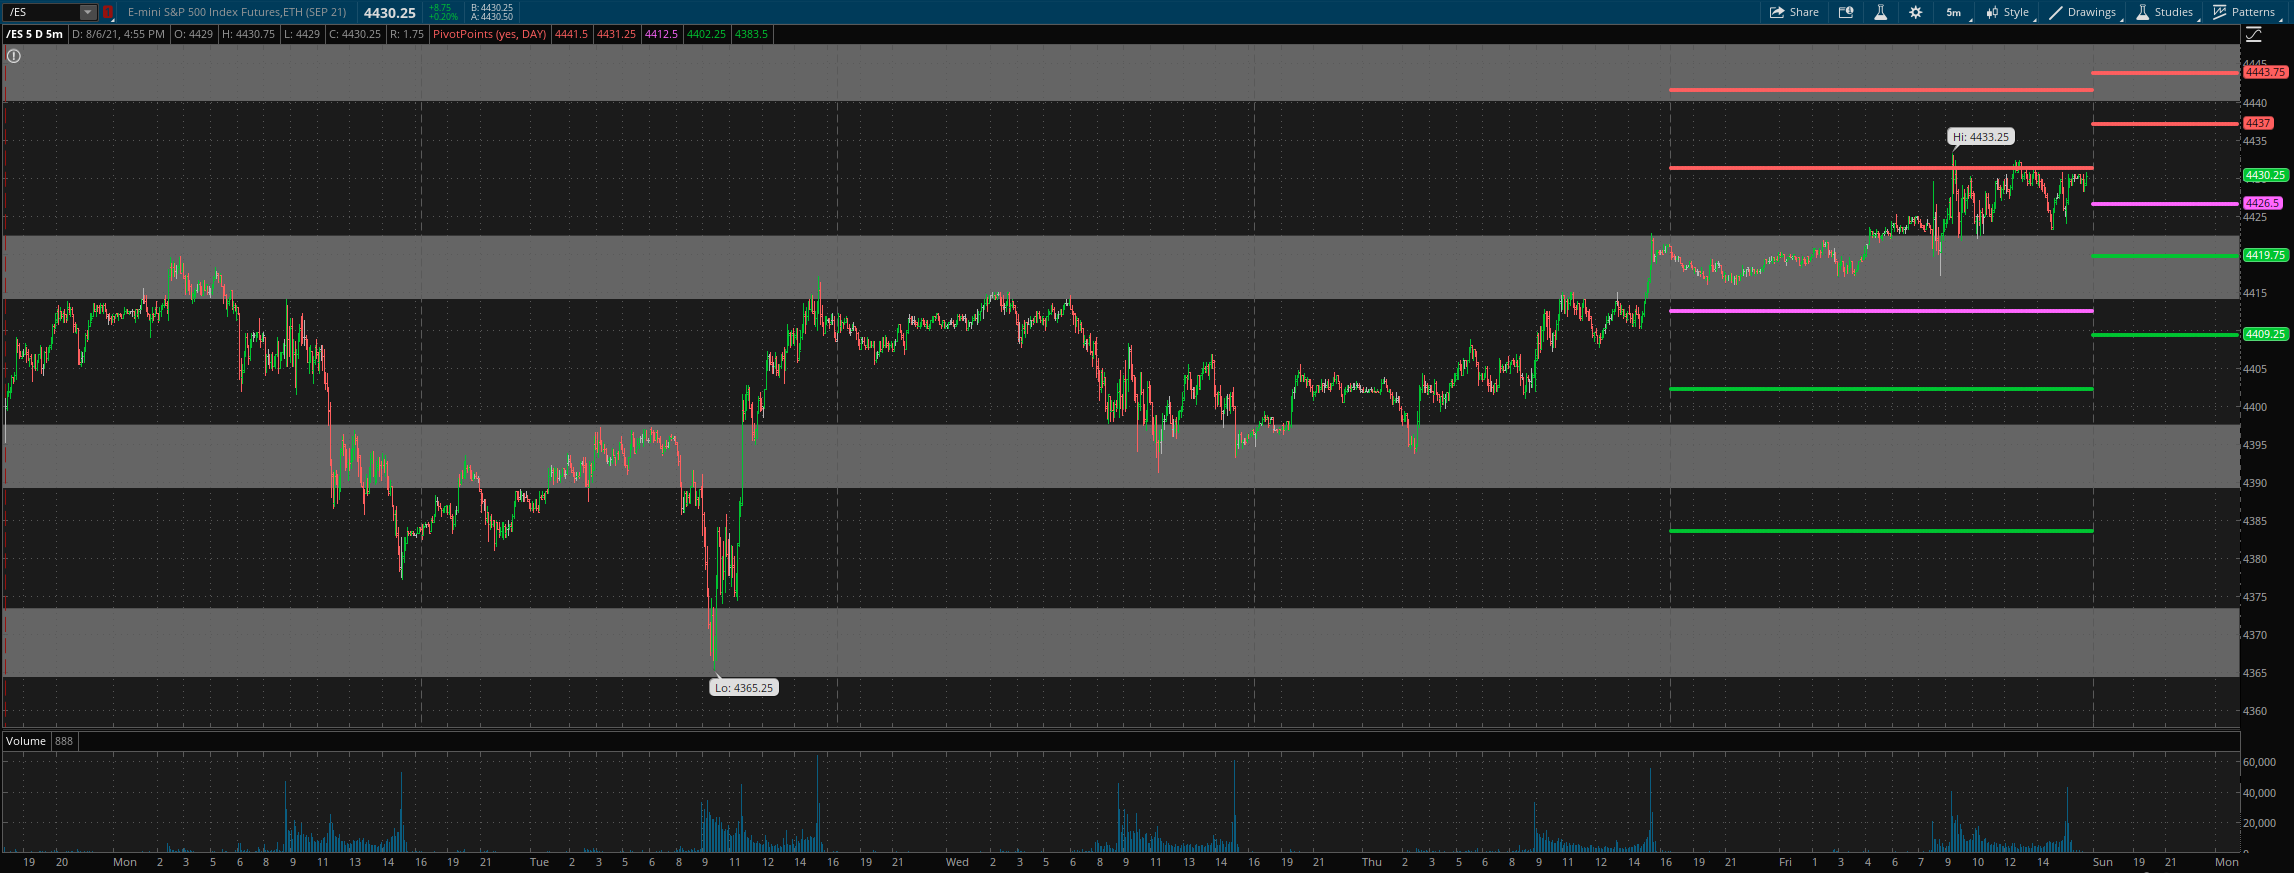
For Monday, daily pivot is at 4426.5. Resistance R1 is at 4437 and R2 at 4444. Support S1 is at 4420 and S2 at 4409.
All the best to your trading week ahead.
