Indicators Remain Bullish, But....
 By
By
In last weekend's report, I noted: "It looks to me like price is setting a base around where we are right now before it is ready to move higher again."
What actually happened is price did set a base and then ended the week strong in the 4230-4250 area on the Emini S&P 500 (ES).
Looking ahead, options data is somewhat bullish on review today. Internals are bullish as well. Price action is short term bullish, medium term bullish and long term bullish. We are long via the Comp, M2 only trade and the LT Portfolio.
Most of our indicators continue on the bullish side. After backtesting support early in the week, the market rallied to close the week at the highs. We do have resistance right above in the 4260-80 area in the form of the channel top resistance. We can test that area and pullback OR just grind along the top line. I am on the lookout for some kind of top -- possibly significant -- to form in the 4280/4340 area. It's a wide range for now, but we can fine-tune the numbers as we get more information.
In addition, Wednesday is WWW -- the Wednesday of the week before options expiration week -- so a pullback is possible into mid-week before moving higher into monthly Opex for the week of May 21st. Our indicators support the long side so we continue holding longs until that changes.
As for our pivots and zones, grey zone resistance at 4228-36 and then at 4254-64. Support is at 4203-4195, 4179-71, 4152-46, 4120-27 and then at 4097-90.
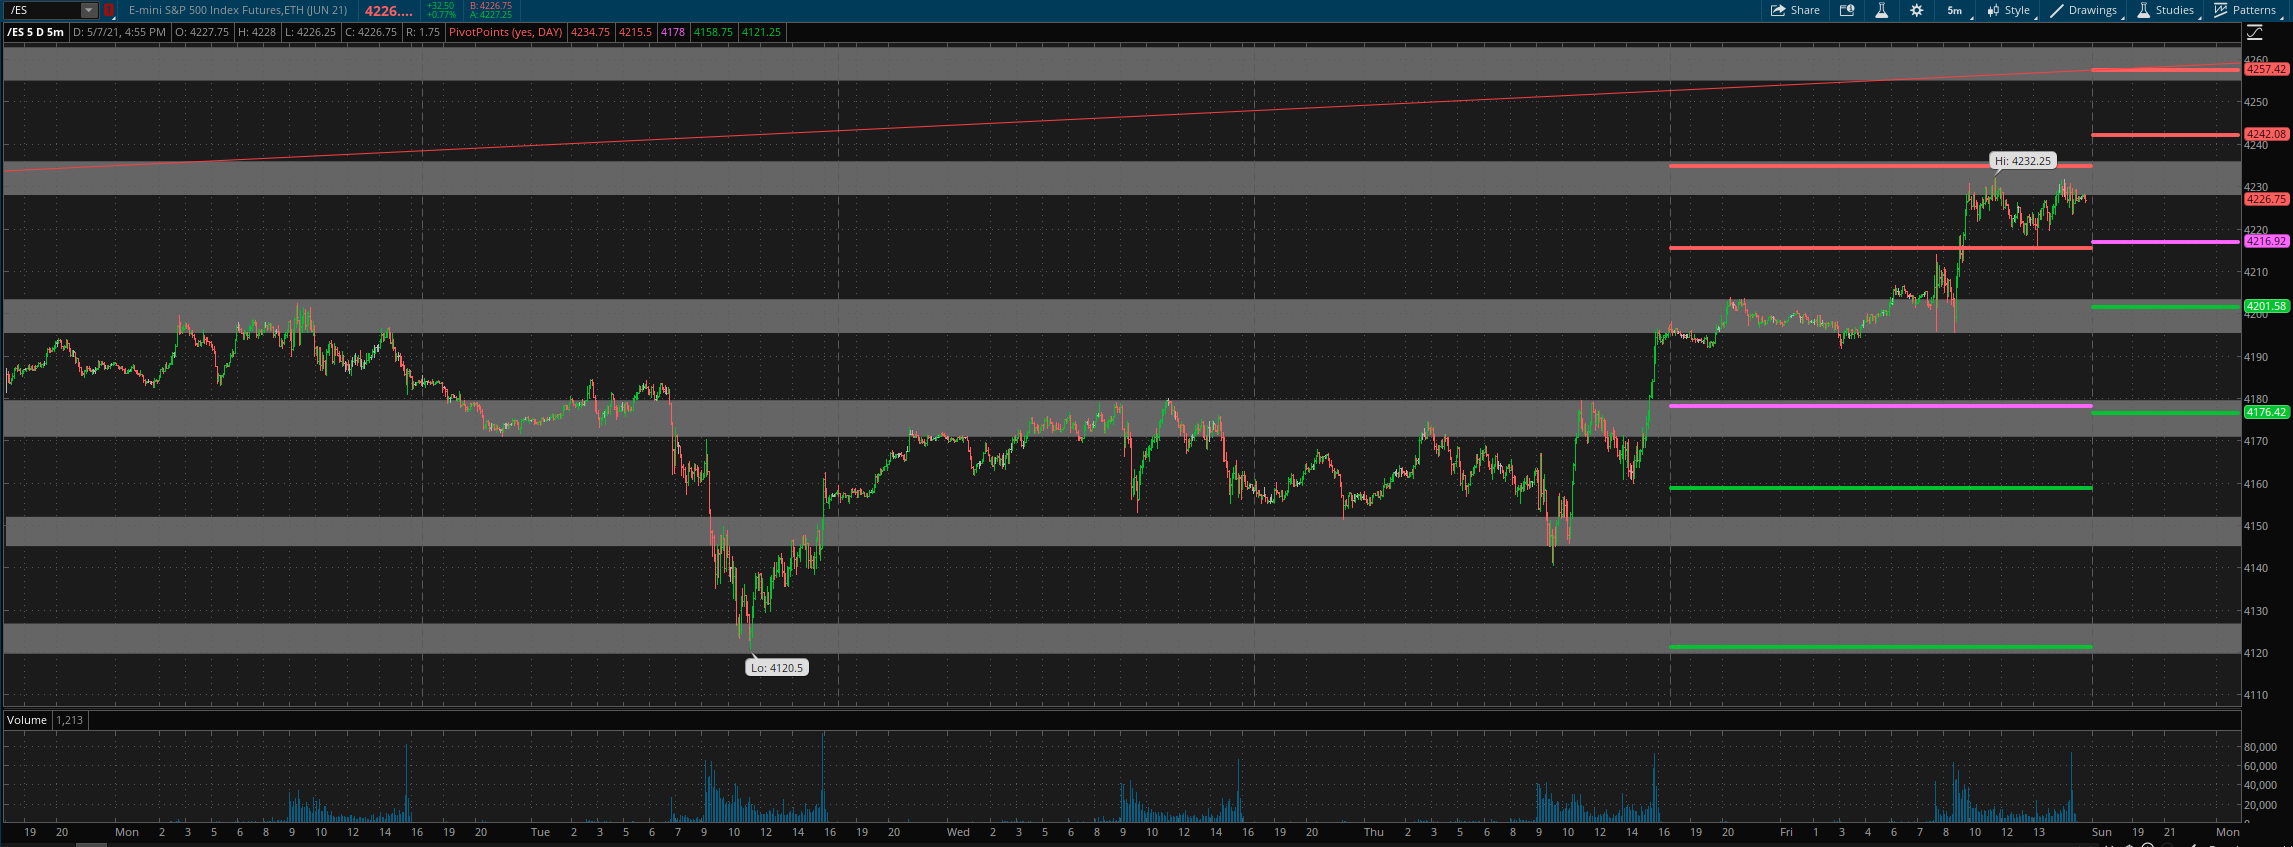
For Monday, daily pivot is at 4217. Resistance R1 is at 4242 and R2 at 4257.5. Support S1 is at 4201.5 and S2 at 4176.5.
All the best to your trading week ahead.
