Indicators Remain Bullish, But...
 By
By
The market had a rather strong week with OPEX bullishness continuing and ended the week at the highs.
What next? Most of the indicators and models are bullish right now. We got a buy signal from our NYHL Micro1 indicator (very short-term measurement based on NYSE high/low data) in the beginning of the week, and we are now long a full-sized position via QLD with a decent profit. Plan is to hold the position until we get an exit/sell signal on the micro1.
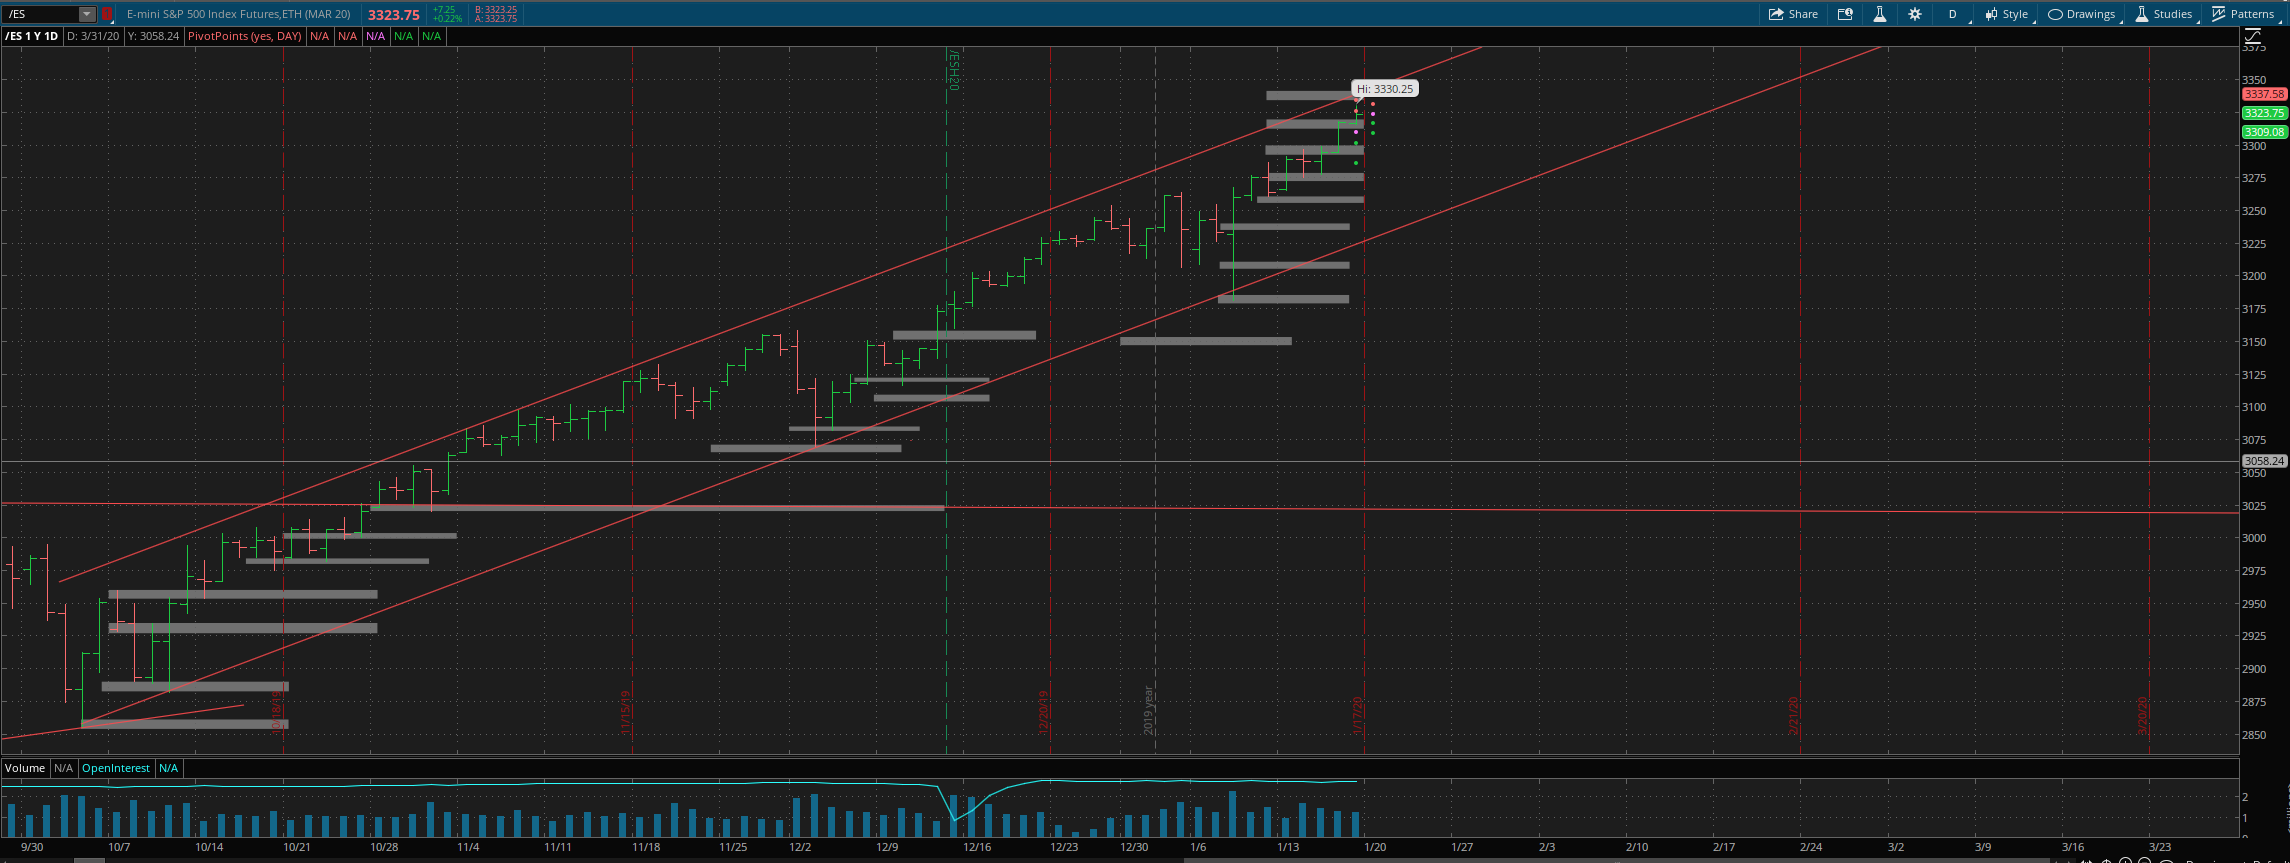
The current rally we are in is likely to continue for a few more days before a pause to refresh. I like the coming week for a turn/pullback to begin. We are nearing the upper end of the daily channel we have been trading in. Options data and the shape of the razzmatazz waves also support this idea.
However, price is the ultimate decider and we have to respect it as it continues to grind higher. The micro1 indicator should give us adequate warning on the next pullback, so we are going to continue holding the long trade until it actually turns.
ES Grey Zone areas: The grey zones on the Emini S&P 500 5-min chart below are what I draw in on a discretionary basis - they are supports and resistance areas which the market is most likely to react from. If we test a zone from below, it is likely to be rejected and fall lower to test support zones below. If we test a zone from above, it is likely to take support there and begin a move higher. So these zones can be used for intraday trading and/or as entry points for positioning for swing trades. These zones are drawn in based on what the market has done there previously both on smaller and larger timeframes.
Grey zone resistance at at the 3334/40 area. Support is at 3319-13, 3299-92, 3278-72, 3260-55, 3239-35 and at 3210-05.
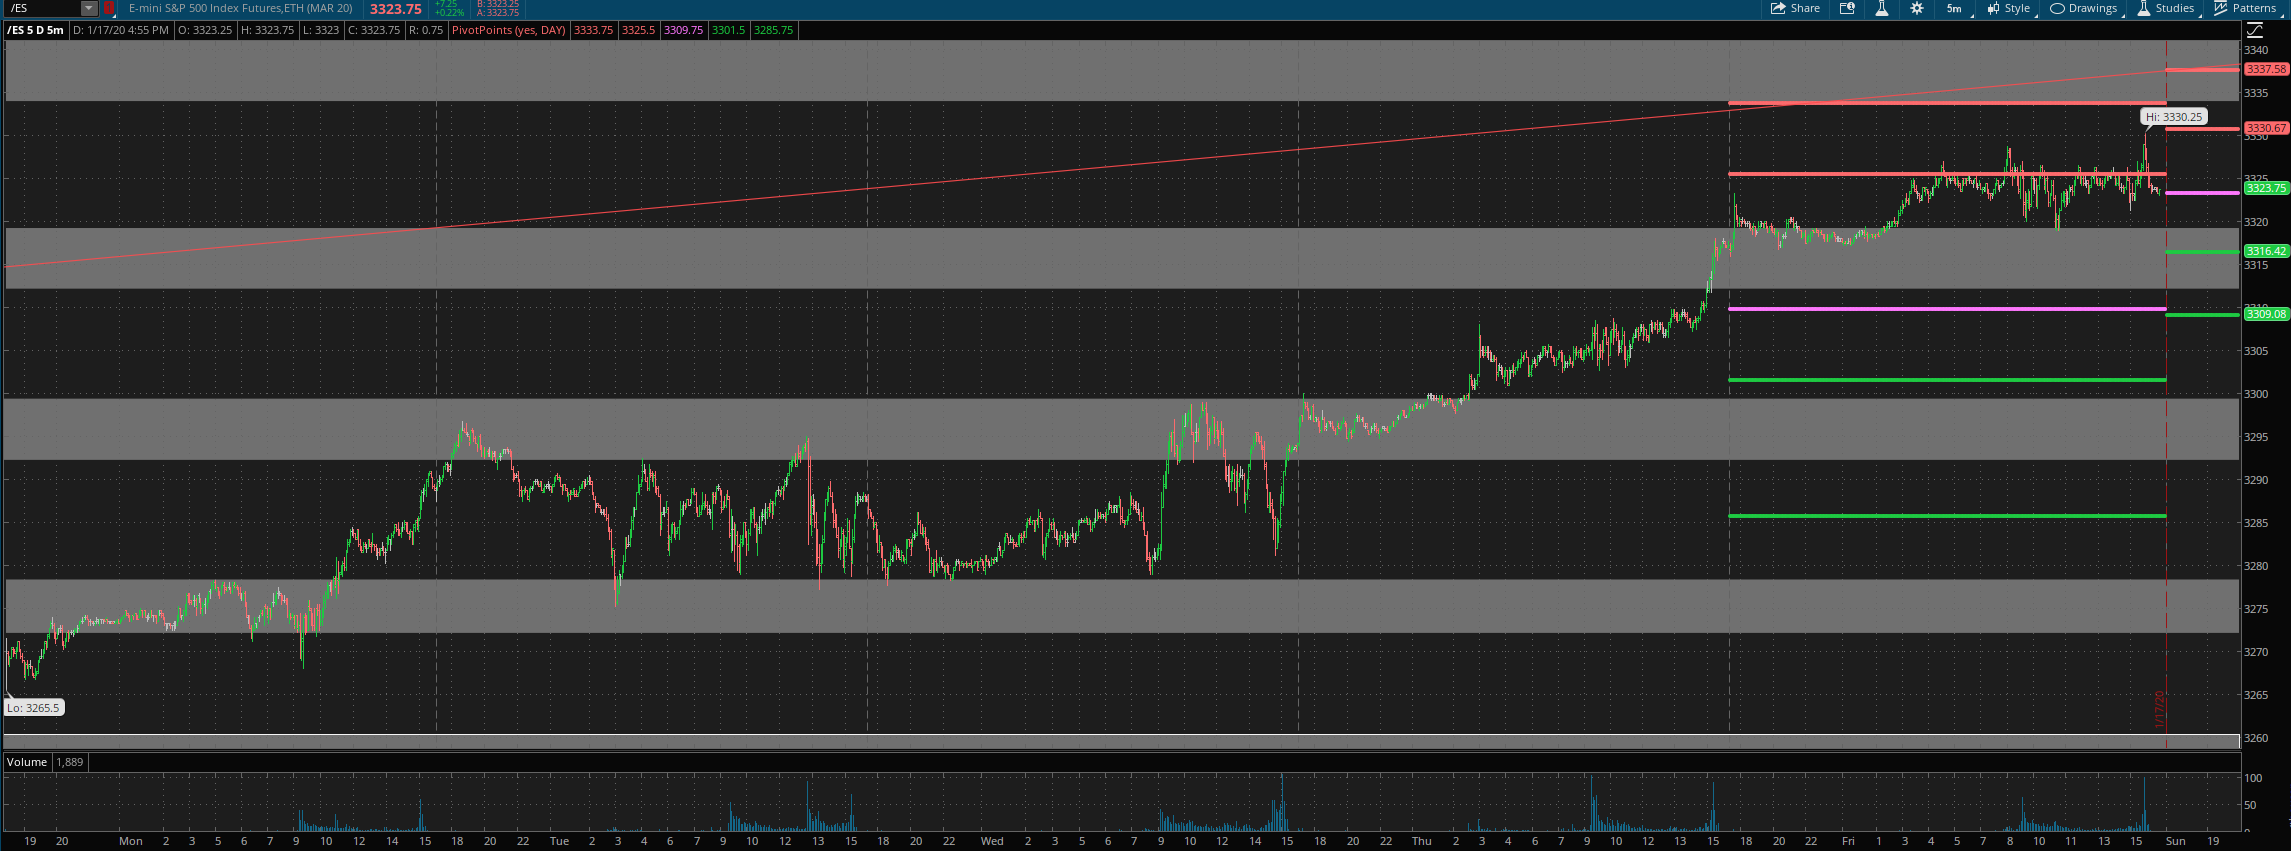
Daily pivot is at 3324. Resistance R1 is at 3330.5 and R2 at 3337.5. Support S1 is at 3316.5 and S2 at 3309.
All the best to your trading week ahead.
