
In Case You Missed It ... Week Ending Friday Sep 25th, 2026
 By
Lou Alfieri
By
Lou Alfieri
In Case You Missed It…
This week we will need to delve deeper into the wave counts on several instruments covered in the Flagship and Nightly services. But first, a quick update on the major equity indexes:
SPX gained approximately 93 points this week, forming what can be called a doji (indecision candle) on the weekly chart, on at average volume. SPX is still in an overall sideways trend from May but it may be compressing to the upside.
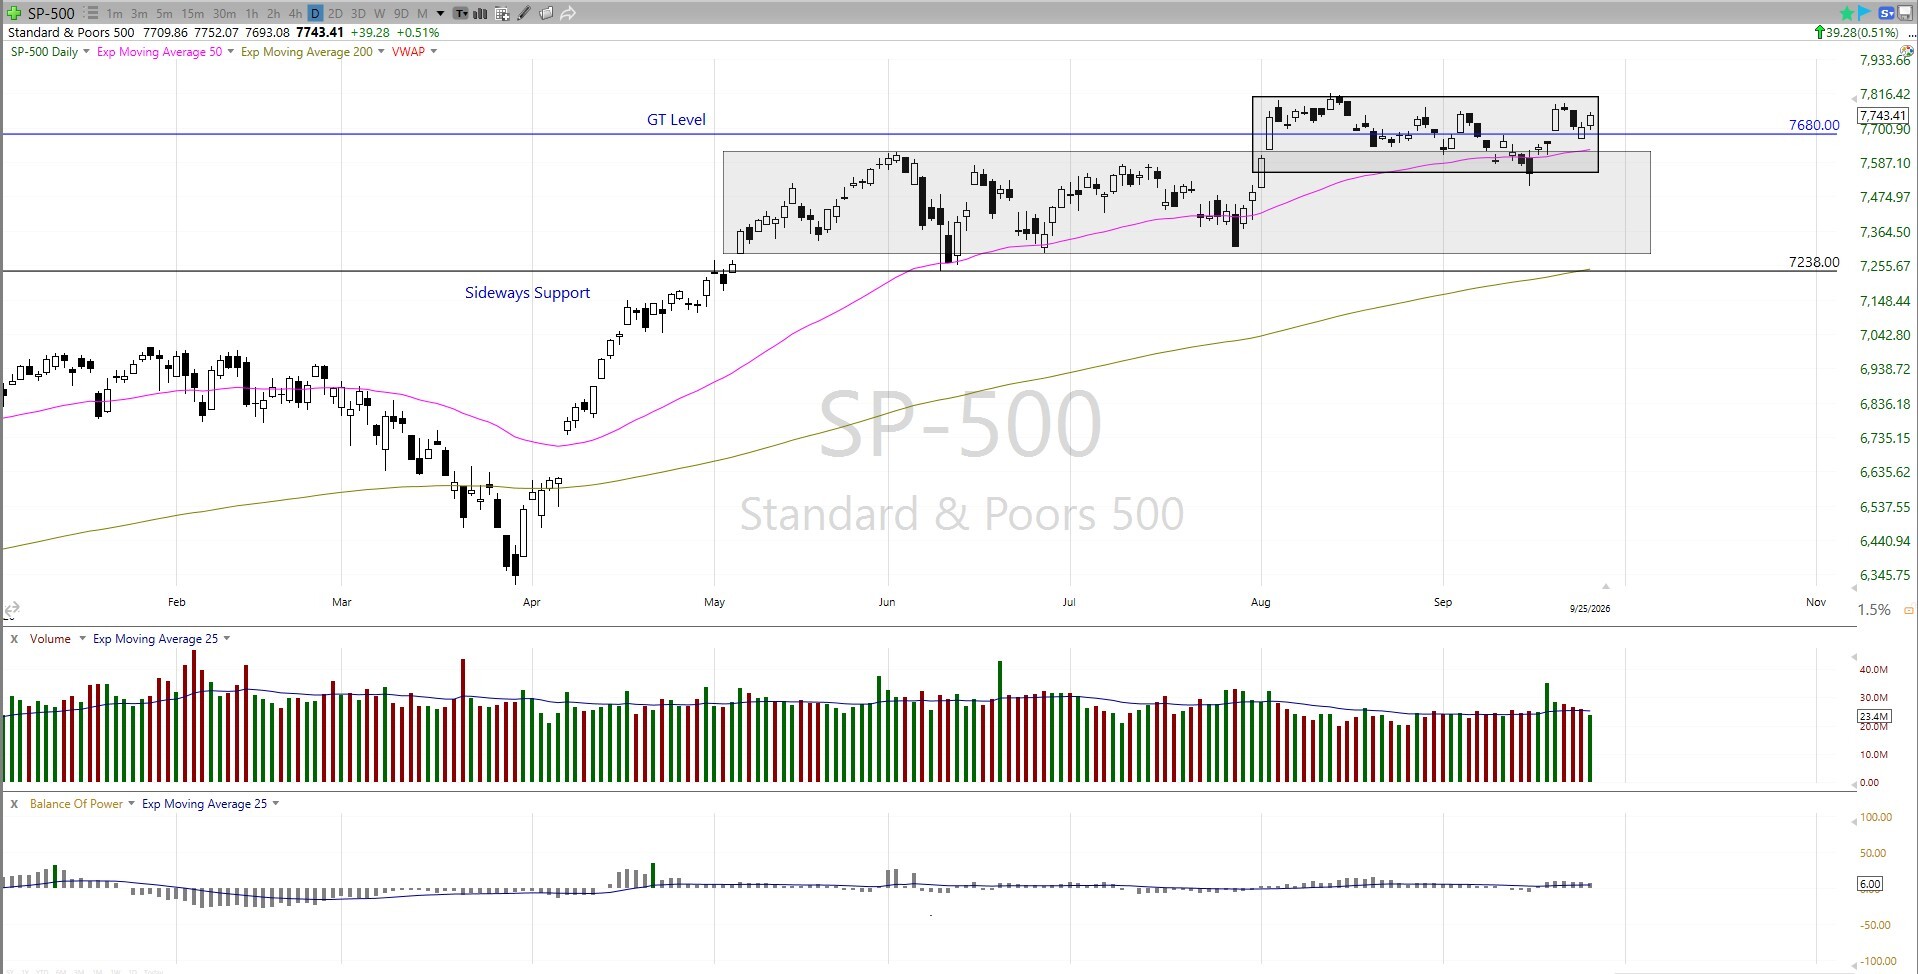
SPX closed slightly above the Gamma Threshold level and the 50day moving average is holding as support. Learn more about the GT level here: https://www.elliottwavetrader.net/gamma-optimizer/Understanding-the-GT-level-202012076573537.html.
NDX managed to eke out a new all time high on Tuesday, but it is barely perceptible on the daily chart, leaving the door open to a double top being in place. Volume on NDX was also at average this week.
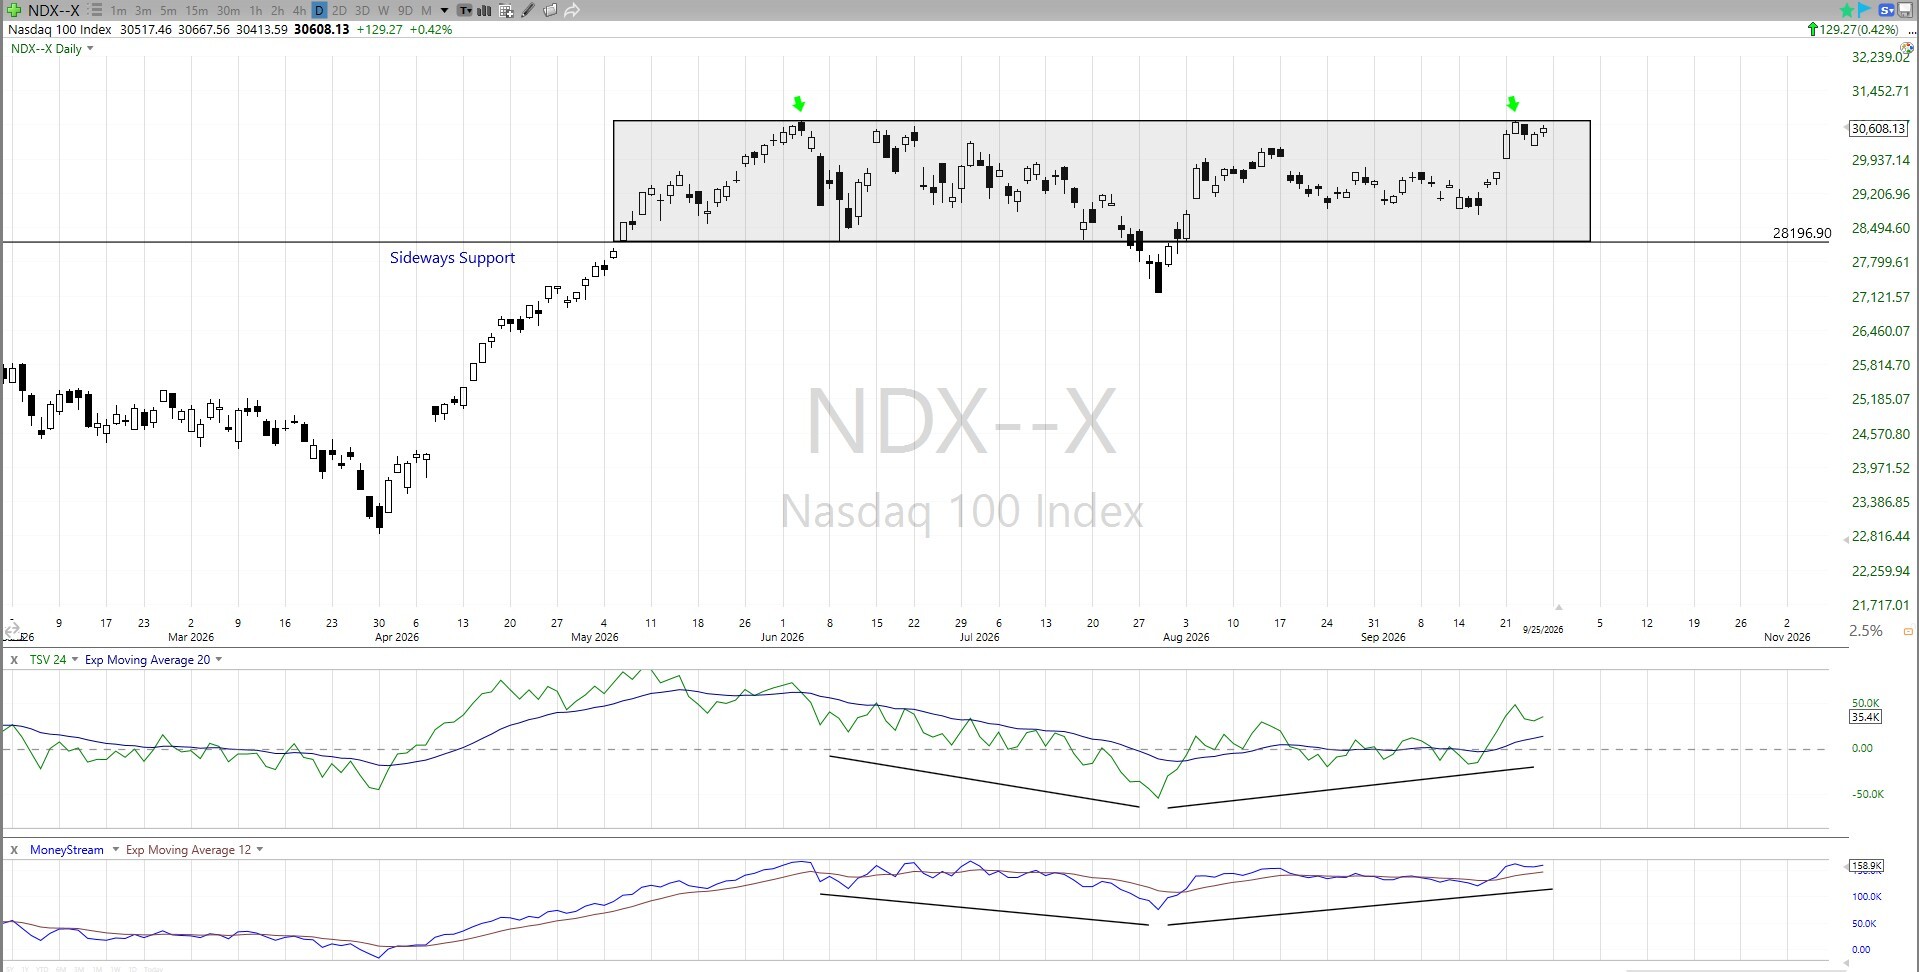
Note that the indicators are depicting a possible shift of sentiment pattern for the Nasdaq 100 index.
The bullish count in equities was covered in detail Saturday in the Flagship Service by Levi, here: https://www.elliottwavetrader.net/trading-room/post/10384355. Here is Levi’s 1hr SPX chart:
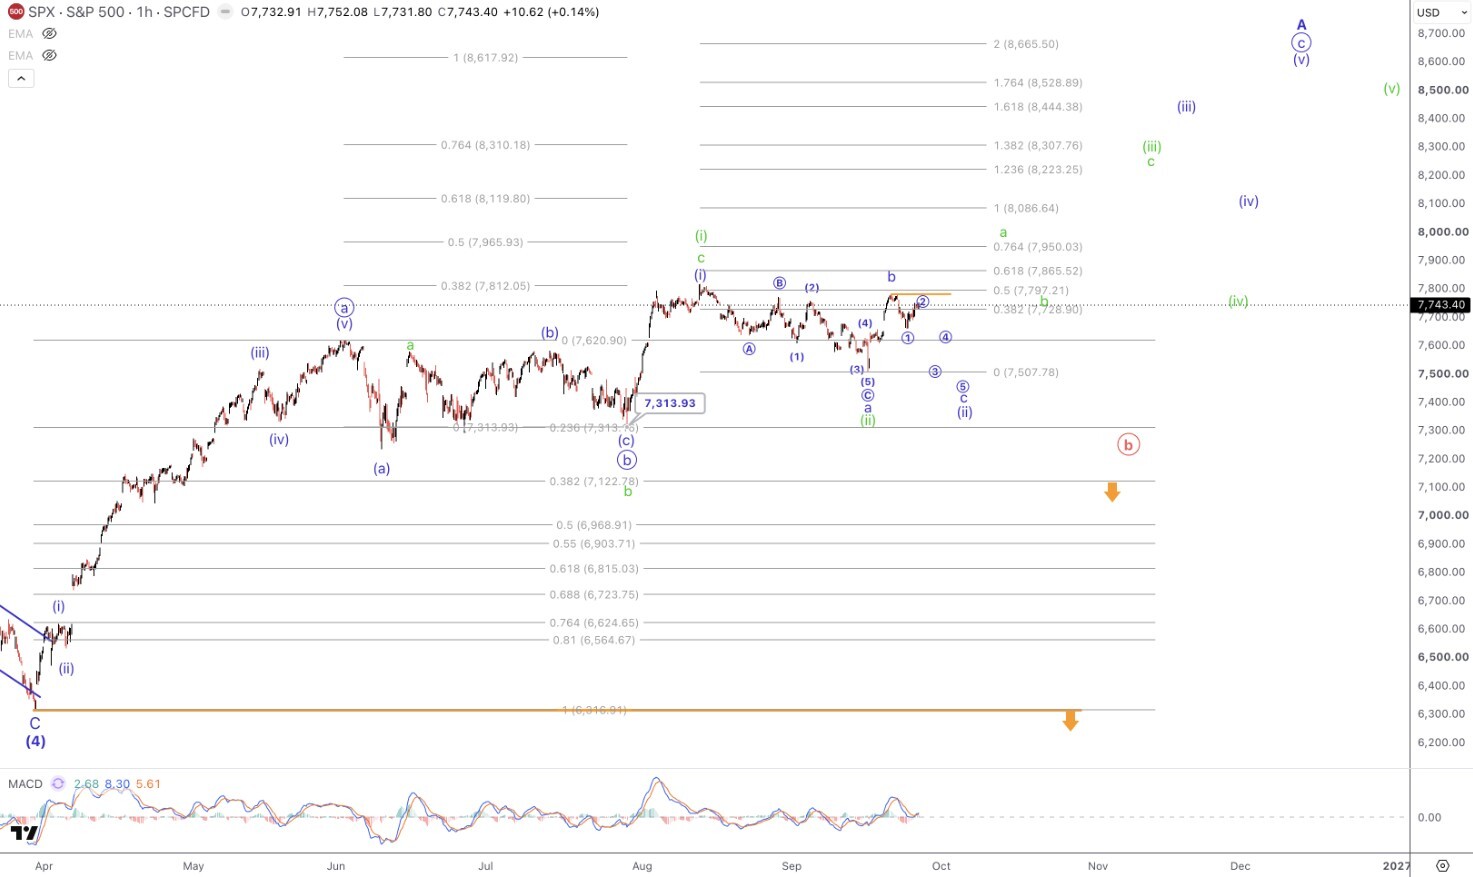
Levi wrote, “Staying below the 'b' wave high struck at 7782 keeps me in Blue.” But Levi’s main point is that the path forward is unclear at this time and it is a time to be paying close attention.
Avi made the same point in his Weekend (SPX) Analysis on Friday in the Flagship Service, here: https://www.elliottwavetrader.net/trading-room/post/10384123, where he wrote,
“It feels like forever that we have been dealing with 3-wave structures. And, the problem with those structures is they do not lend themselves toward clear perspectives due to their more variable nature. But, alas, this is what the market is giving us and we have to do our best when it comes to analysis.
Yet, as I try to point out all the time, even though I am required to provide analysis on these types of structures does not mean you have to trade them. In fact, I discourage trading corrective-type structures as they are too variable and unreliable. This is why I have often suggested you review the many charts being presented in Stockwaves as there are many more choices from which you can find clearer charts.”
This does not mean no progress was made from an Elliott Wave perspective. The blue count has been removed, and the yellow (bullish) count is now Avi’s primary count. Avi continued:
“… Once the blue wave path we were tracking invalidated we were left with the yellow wave count. And, that count suggests the market is attempting a higher high to complete wave (v) of i of 3, with wave i being a leading diagonal, or in a more bearish wave count in red, completing the entire rally off the 2020, 2009, and even the 1932 lows in a multi-decade 3rd wave.”
The yellow count is a count we should all be familiar with by now and is depicted on Avi’s daily SPX chart:
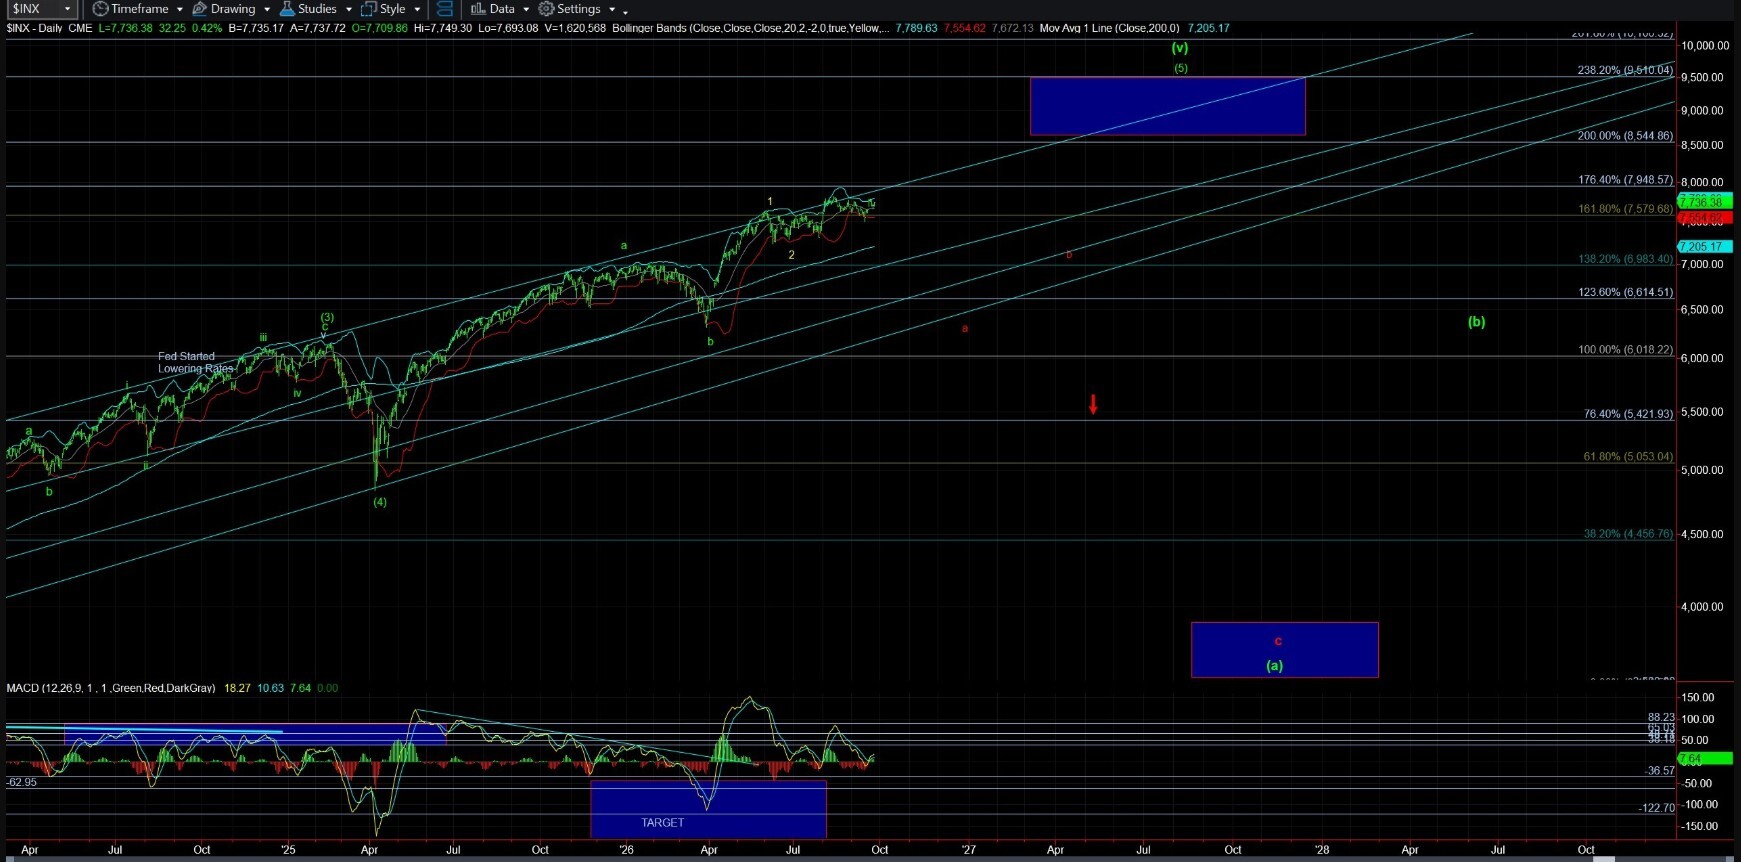
The reason I am showing Avi’s longer term chart is to highlight the red (bearish) count. If Avi and Levi are both saying the path forward is unclear, then we need to be ready for either count.
Note the red ‘a’ and ‘b’ wave on the chart above. These have been inserted as placeholders as the red count does not become actionable until we see a clear 5 down. If that were to form, Avi and the other analysts would make that very clear. So, for now, the red count is something to just be aware of. I have my bear market plan already written down, do you? I have written about this, here: https://www.elliottwavetrader.net/trading-room/tag/ExitStrategy.
Volatility
Volatility as measured by VIX is14.8, the same value as last week. Options dealers are still relatively sanguine. However, in a change from last week, liquidity was not plentiful this week; it struggled to keep up with volumes a little. Nothing alarming, but worth keeping an eye on.
Other Trades - Metals
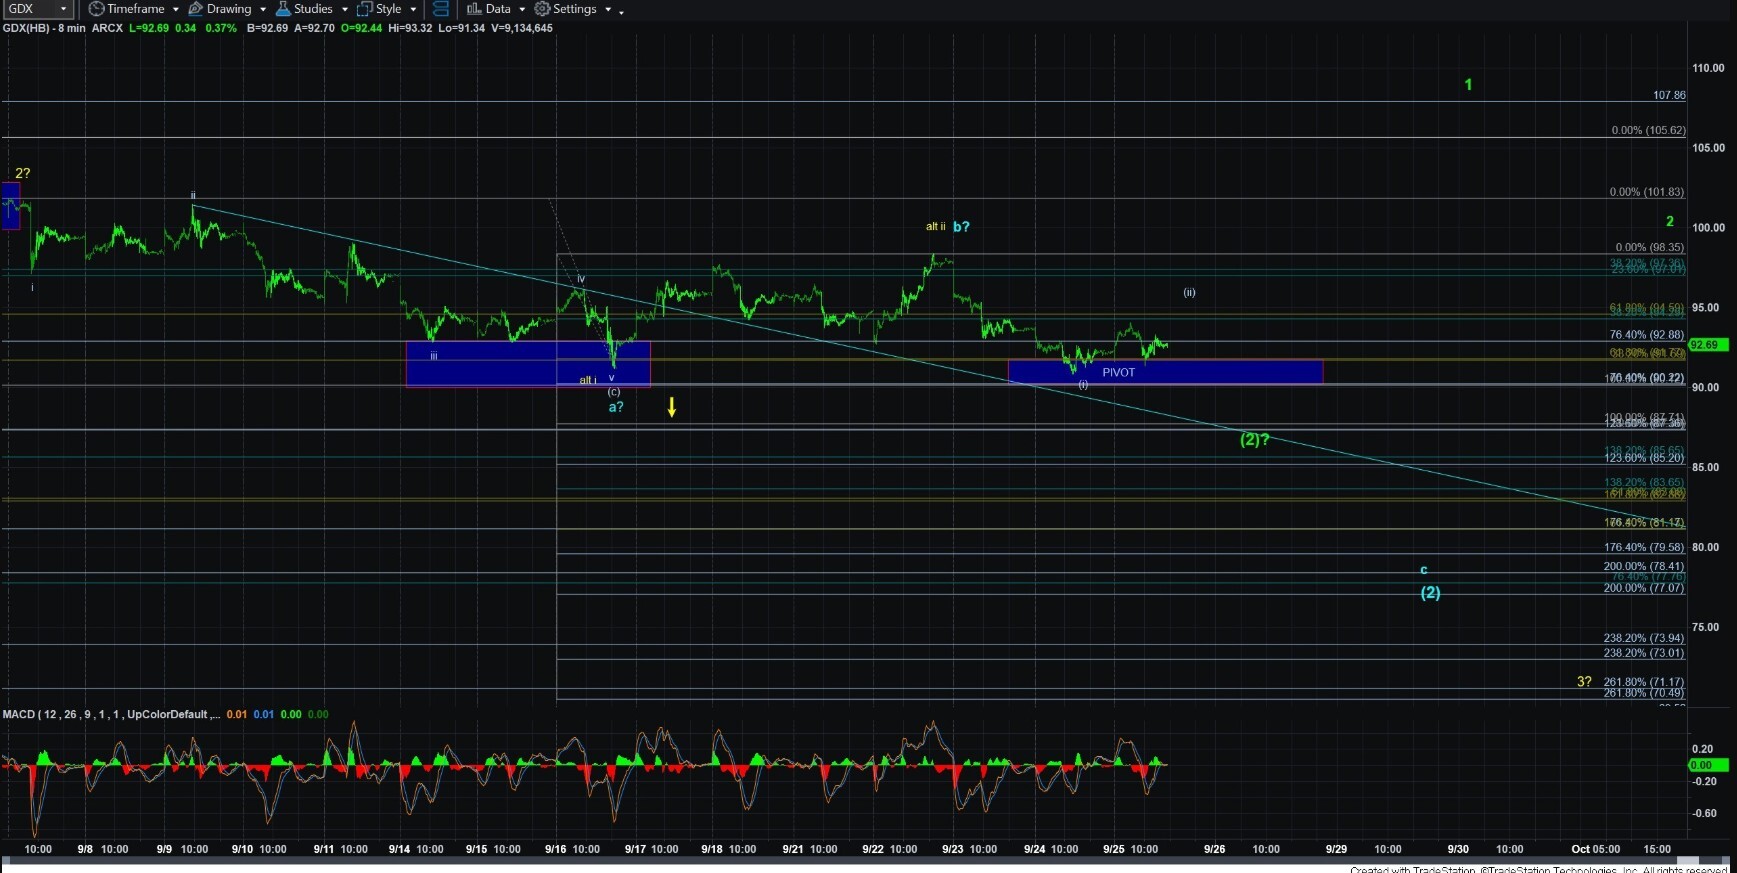
After a very smooth start, the metals and miners trade became more complex this past week. Like SPX, Avi posted his Weekend Metals Analysis early and it can be found here: https://www.elliottwavetrader.net/trading-room/post/10384057. Paraphrasing Avi is not easy and his weekend metals analysis should be read in its entirety. It is required reading for all metals traders. His GDX chart depicts the current situation nicely:
Per Avi (emphasis added):
“GDX has more options open as there is potential for the next decline towards 87 to complete a deeper wave (2) if this current consolidation is actually a 4th wave in the c-wave of (2). That is the green count. But, if we do break below 87, then I do not think we will have any potential bottoming based upon what I am seeing now until at least the 77-80 region and then we have potential for a bigger c-wave of (2) at the .764 retracement region of wave (1). The reason I have the c-wave of (2) in blue now at the .764 retracement region is because a (i)(ii) structure as we are now potentially seeing would project down to that region and a deeper c-wave of (2) in blue.”
Again, Avi’s post must be read in its entirety. But for the purposes of my positioning, I will stop out of my GDX position with a convincing break of the $87 region.
Silver
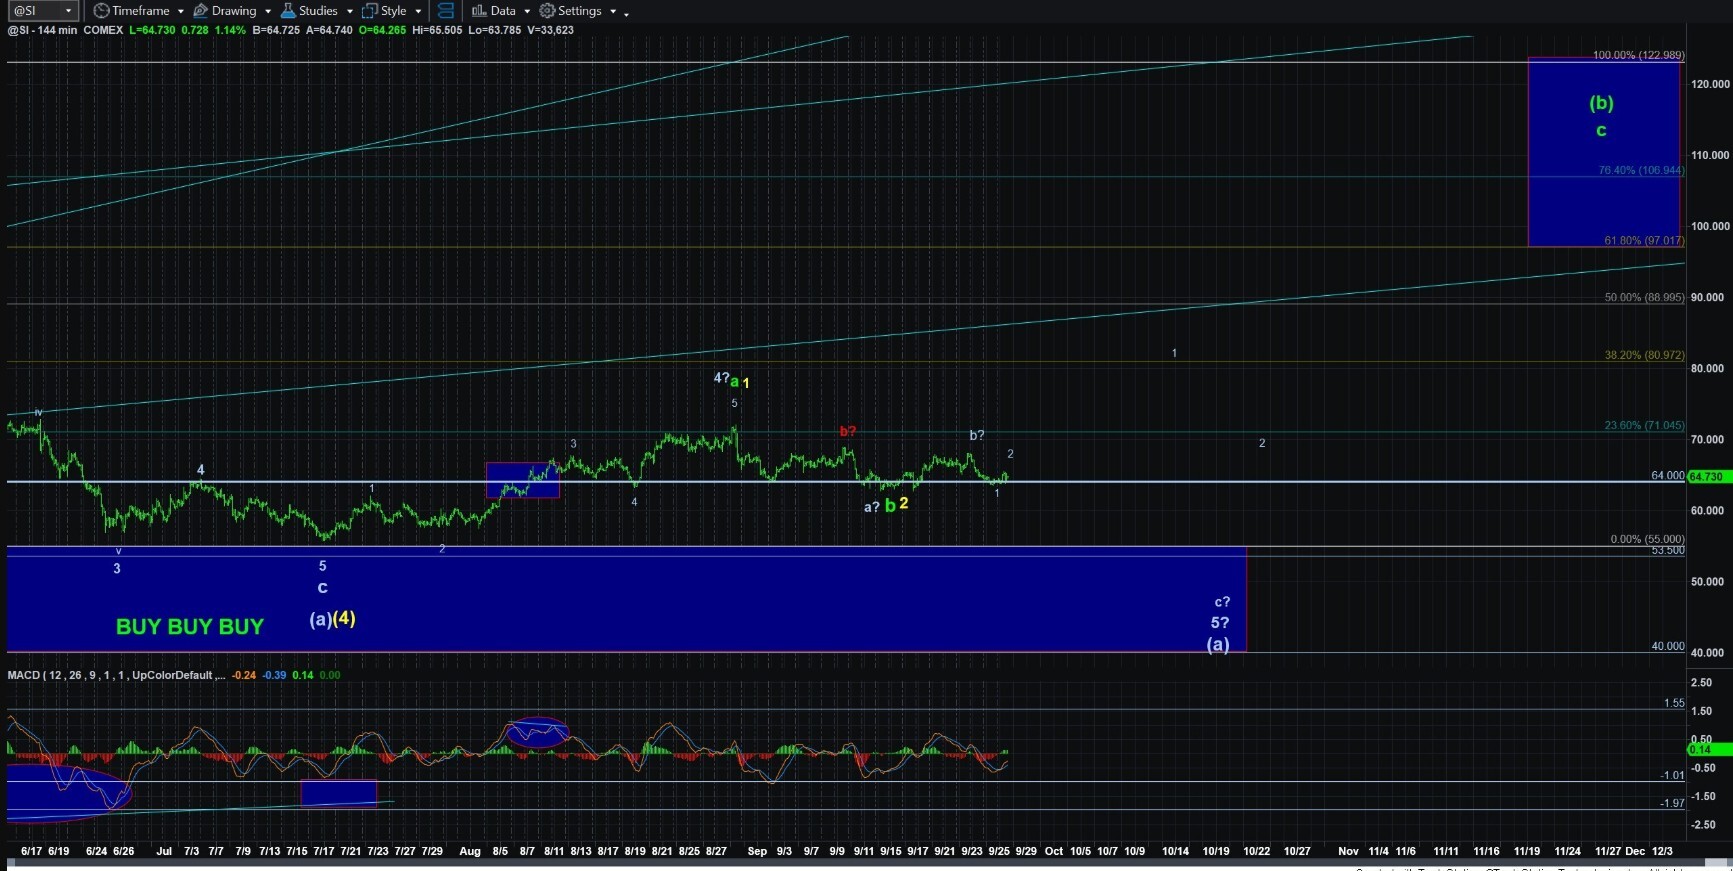
Of note is that we have a large confluence of analysts who see an immediate downside setup in silver. Avi, Jason, Arkady, MarkZ and some of the trading rooms see this potential. In fact, I now have puts on SLV myself. Having said that, I would not classify this trade as anything close to a “slam dunk,” and, if pressed, I believe Avi would agree with me. Take a look at Avi’s famous 144min Silver chart and notice that on large timeframes, most paths in silver point higher:
Other Trades – Bonds and Natural Gas
Setups may be brewing on TLT and UNG. A reversal in TLT can happen at any time now. TLT will need to evidence some sort of bottoming behavior, preferably by forming 5 waves up. The reversal in TLT is likely to be dramatic. So the open question is whether that reversal is so strong as to lock us out of an impending rally, or whether the reversal and corrective pullback give us a proper setup for a trade to the long side.
The natural gas trade, on the other hand, seems to need a few more weeks before a proper setup presents itself. We are monitoring both trades carefully.
Other Trades – Oil
Finally, Avi and the analysts have noticed a possible long side setup on USO. Avi’s Weekend (USO) Analysis was posted Friday to the Flagship and Nightly services, here: https://www.elliottwavetrader.net/trading-room/post/10384019. Like silver, this is not a 10 out of 10 setup. Avi wrote, “As you can see on the attached 8-minute USO chart, there is a potential i-ii set up now in place and as long as we hold the support box for wave ii, I am still expecting one more rally to the box overhead.” (emphasis added). Here is the chart:
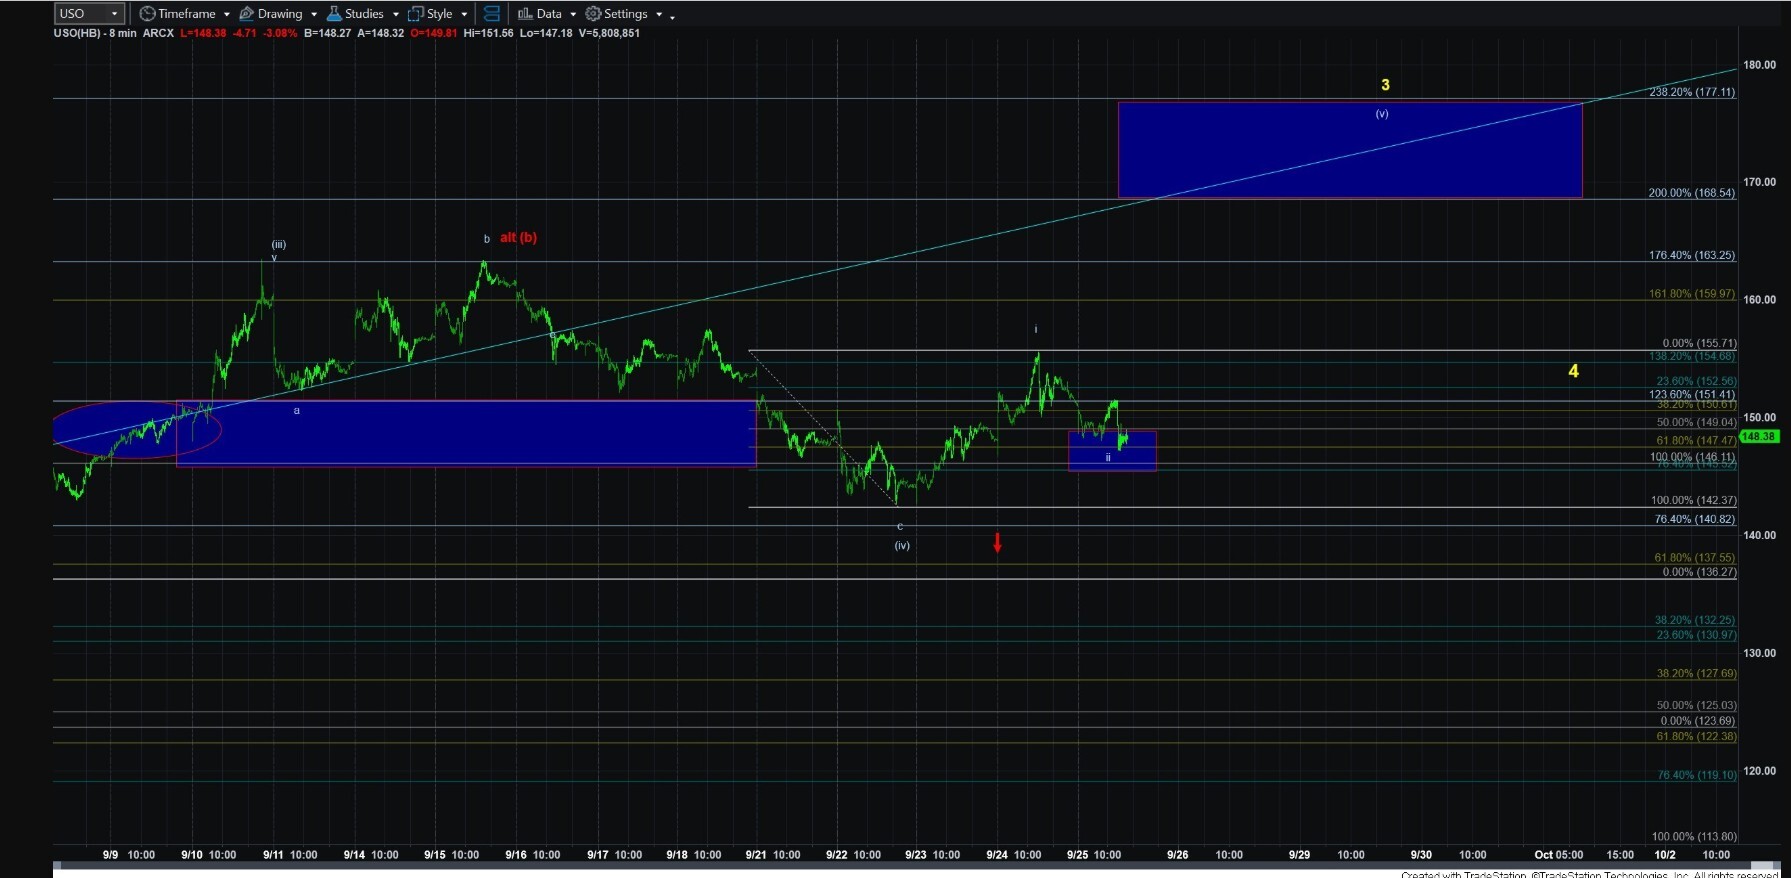
I purchased some UCO shares on Friday. UCO is a leveraged instrument that issues a k-1 at tax time. A convincing break of Avi’s blue support box will have me exiting this position.
ICYMI
Shannon Fitch is an analyst who works in our Fibonacci Markets & Stocks service with Carolyn Boroden. On Tuesday, Shannon posted the following thread to the Flagship Service: https://www.elliottwavetrader.net/trading-room/post/10379824. (This post has since been moved to the Beginners Circle so it can be accessed by all.) In this “For Fun Tuesday” post, Shannon asked for chart requests and her analysis of those charts is posted in the replies. Shannon and Carolyn also provide more information about their methodology and include an introductory .pdf file for reference. This entire thread is a great read.
In conclusion, the potential shift of sentiment pattern I am seeing on NDX has me leaning toward more upside in equities (or at least in technology stocks) in the near term. The pain trade would be for continued range-bound, sideways price action. However, if liquidity continues to drop off as it did this week, then a downside resolution becomes more likely. While we wait for clarity on the equity indexes, there are opportunities elsewhere, and we can use the Beginners Circle to track those potential setups together.
Have a good weekend everyone!
