
In Case You Missed It ... Week Ending Friday Sep 18th, 2026
 By
Lou Alfieri
By
Lou Alfieri
For those interested in the cryptocurrency space, Ryan is hosting his monthly public webinar this morning. You can register for that here: https://www.elliottwavetrader.net/trading-room/post/10376763.
In Case You Missed It…
SPX dropped approximately 6 points this week, essentially closing unchanged for the week. It is still basically in a sideways trend since May. NDX is similarly postured.
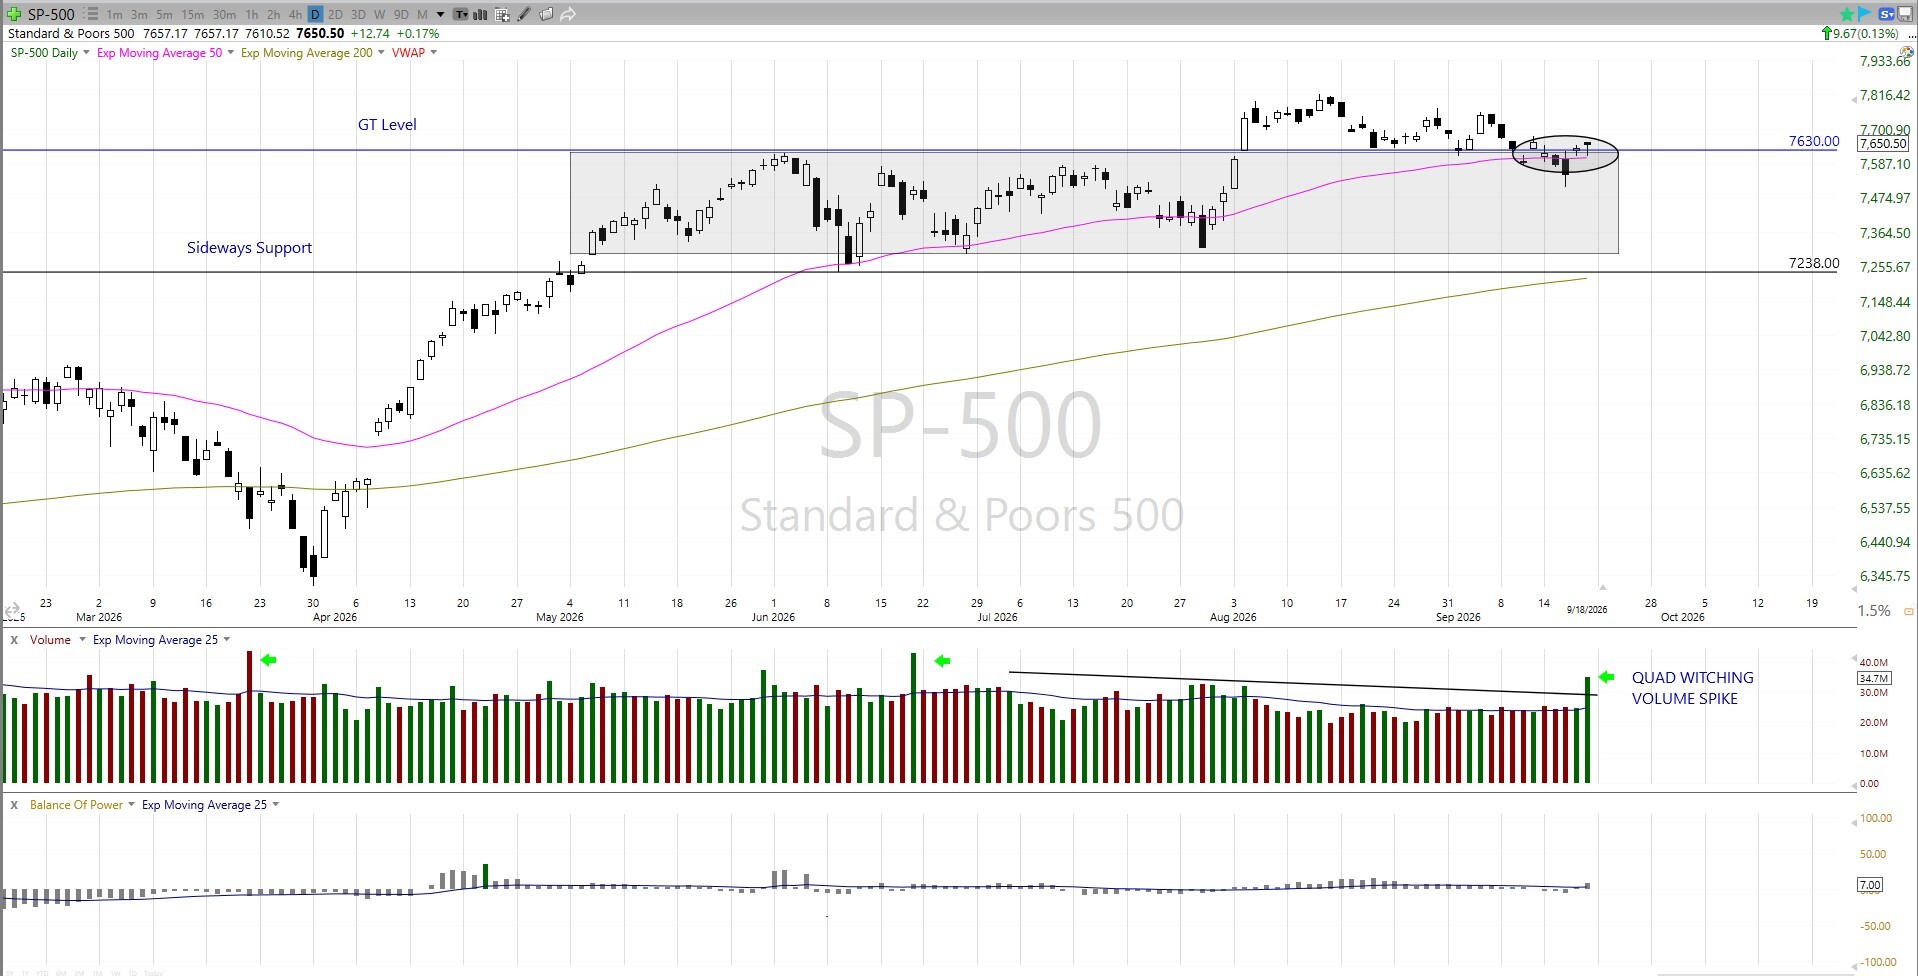
Despite the onslaught of retail news the week, SPX closed flat. This is an important lesson: catalysts/events can serve as a trigger for moving markets, but ultimately human sentiment controls the direction of the markets, and Elliott Wave Principle requires no trigger. Sentiment among the retail/small fund investor class has been divided for more than a year, and the result is choppy, whipsaw markets.
Note that the volume spike on Friday is almost certainly a result of it being a quarterly options expiration date. Otherwise, volume did return to its moving average line, though the moving average is lower than it was a few months ago.
SPX being stuck close to the gamma threshold level for so long is another indication of the divided sentiment and indecision nature of this market. Leo’s most recent post on the GT level was on Friday in the Flagship Service, here: https://www.elliottwavetrader.net/trading-room/post/10376164. Learn more about the GT level here: https://www.elliottwavetrader.net/gamma-optimizer/Understanding-the-GT-level-202012076573537.html.
So where are we in the wave count?
In Friday’s Market Update post (https://www.elliottwavetrader.net/trading-room/post/10376727), available to Flagship and Nightly subscribers, Mike presents the yellow and blue counts on the 15min ES chart:
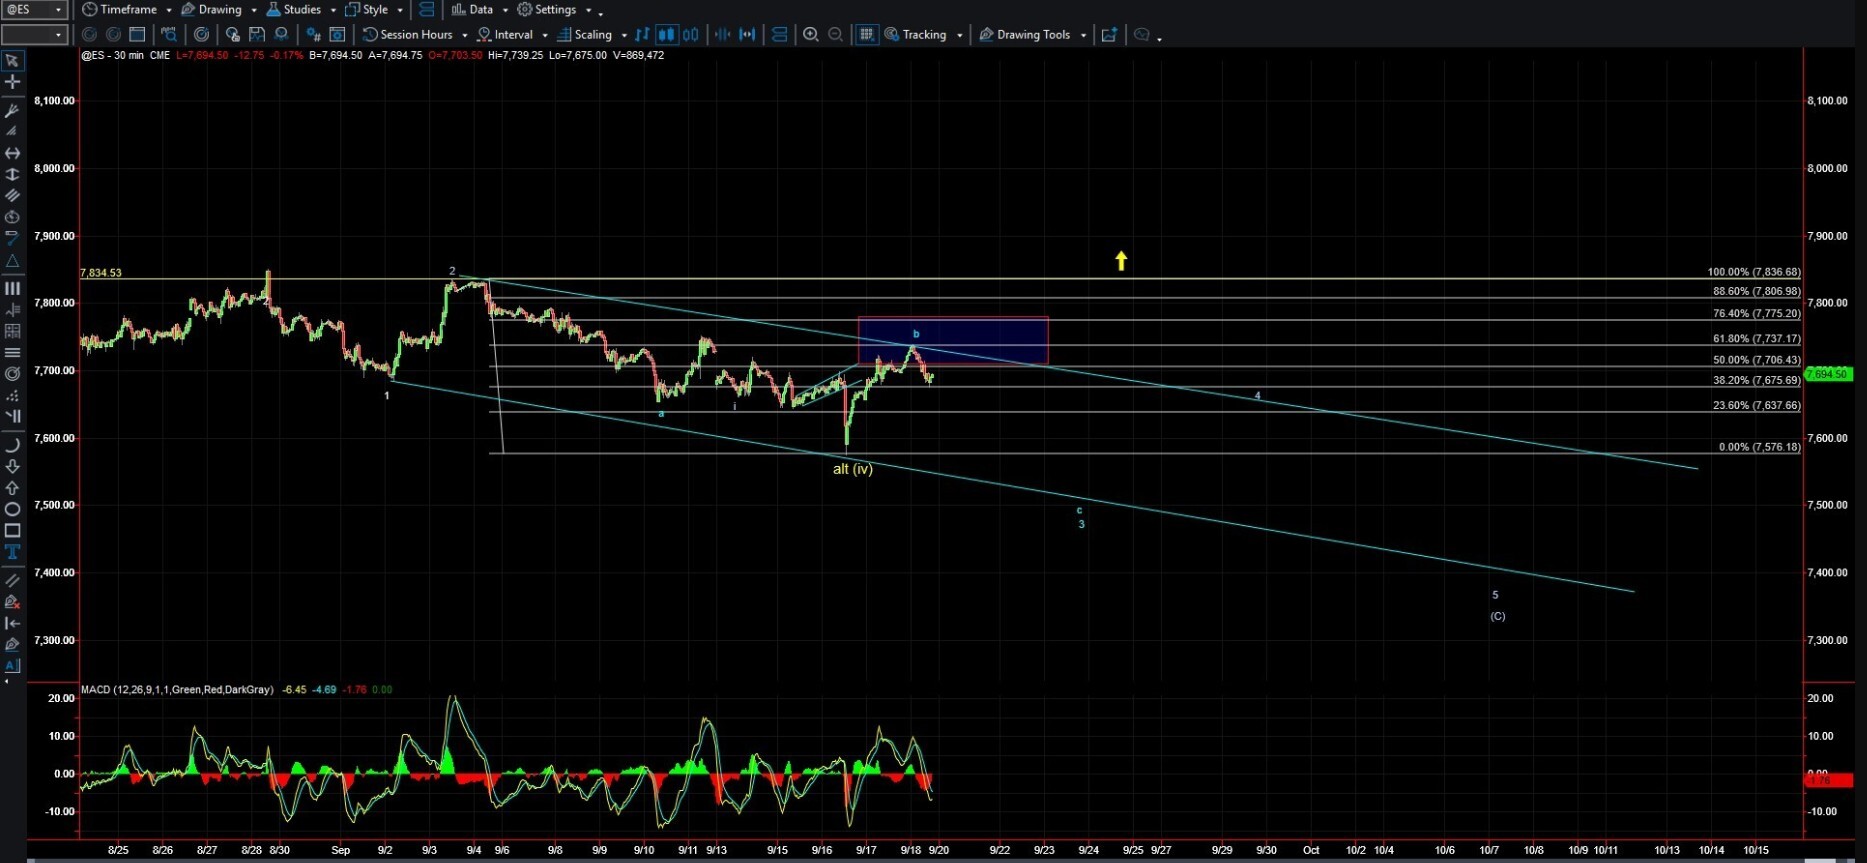
The blue count is the large diagonal with a possible leading diagonal down off the recent high. Mike is giving both counts an equal probability, though the yellow count still has a lot to prove to the upside.
Here is the bigger picture chart (SPX):
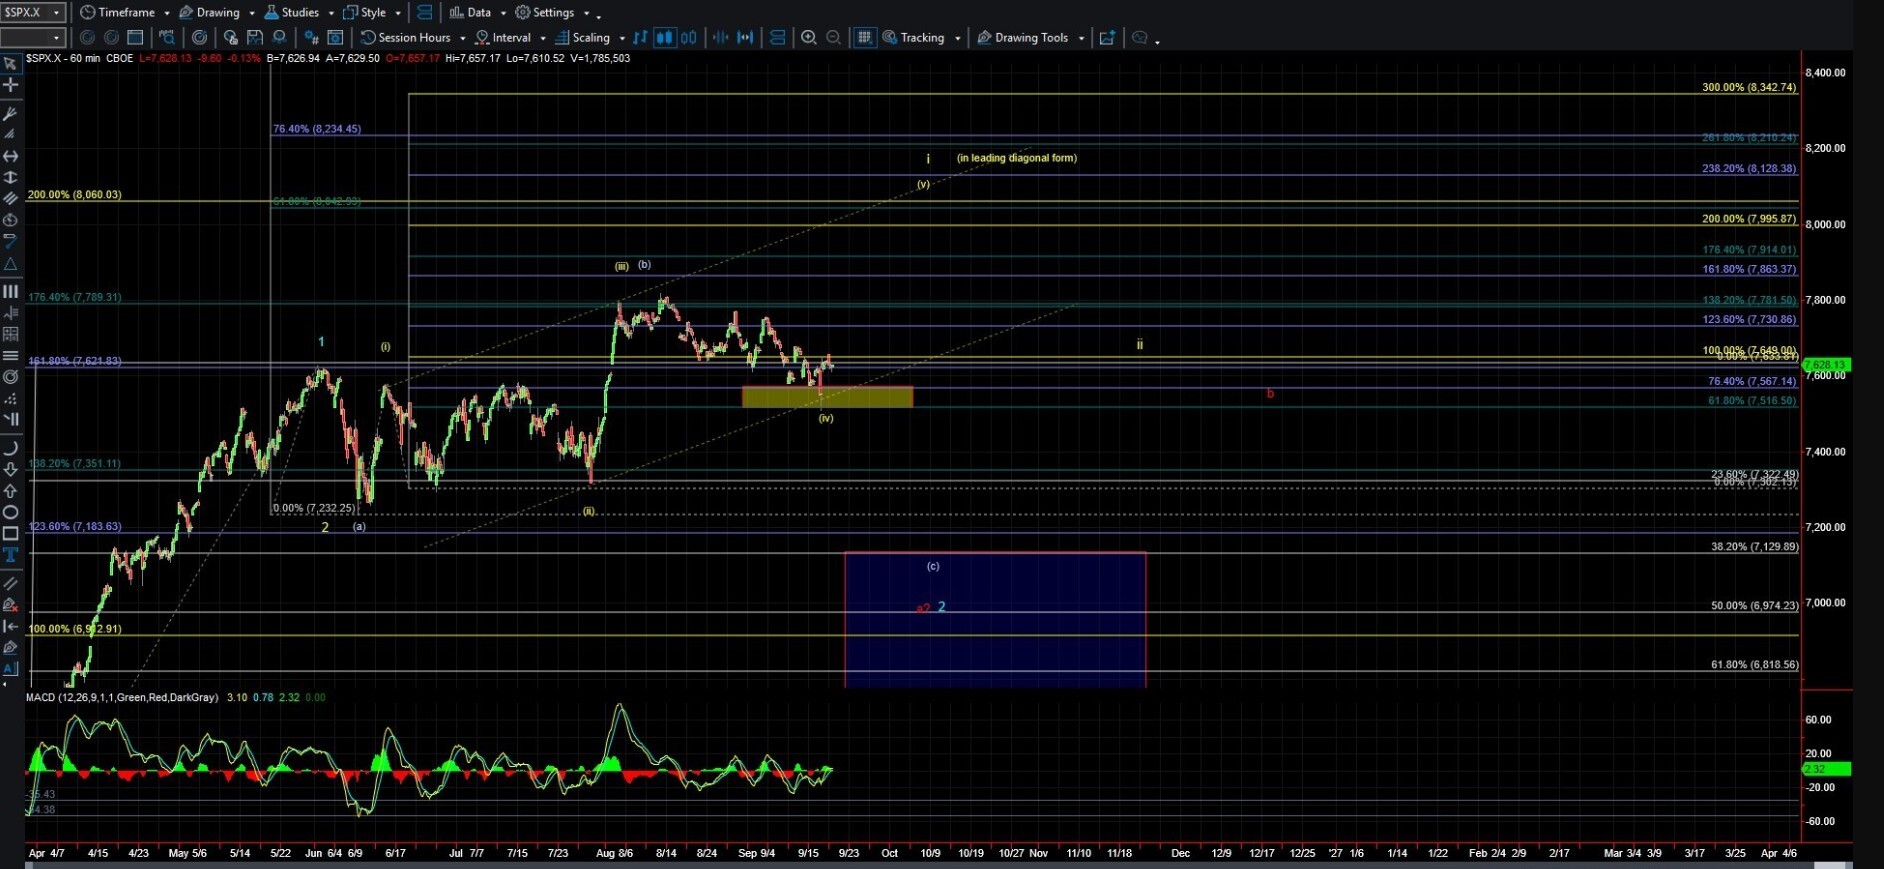
We are still waiting on resolution between the two counts, with the red count (the bear market count) on the backburner until Avi sees 5 waves down.
Mike also included a Claude-produced summary of the daily Market Update, which is something designed to help beginners learn Fibonacci Pinball faster, and to foster discussion. For those who cannot access the link above, I am attaching the .pdf file to this post. This is just the tip of the iceberg of what we have been able to accomplish with the help of AI.
Volatility
Volatility as measured by VIX is back down to 14.8. Options dealers are relative sanguine. Liquidity indicators also suggest that market makers have no near-term concerns.
I am working to ensure that I am not caught off guard by a strong rally (have a watchlist!) and I am also prepared with a bear market plan of action for when that time arrives. With Mike being “close to 50/50” in preferring the yellow or blue counts, and knowing SPX can’t trend sideways forever, I want to be ready. My bear market strategy can be found here: https://www.elliottwavetrader.net/trading-room/tag/ExitStrategy.
For anyone who thinks a large rally from here is not possible, Levi posted his weekend SPX review to the Flagship Service this morning, here: https://www.elliottwavetrader.net/trading-room/post/10377036.
Other Trades - Metals
I added a third metals miner to my repertoire this week as well as an initial (about one third) tranche of GDX at $93.28, and am looking to add a little more if we can come back down to the low $94s. My stop loss is set at $90.40. I have now invested about 35% of what I intend to invest. My ideal plan is to hold these positions for a very long time. I will likely have a core position that I trade around.
To be clear, the metals complex has a downside setup. Here is Avi’s 8min GDX chart (keep in mind that this is a very small time-frame), posted to the Flagship Service on Friday, here: https://www.elliottwavetrader.net/trading-room/post/10376513:
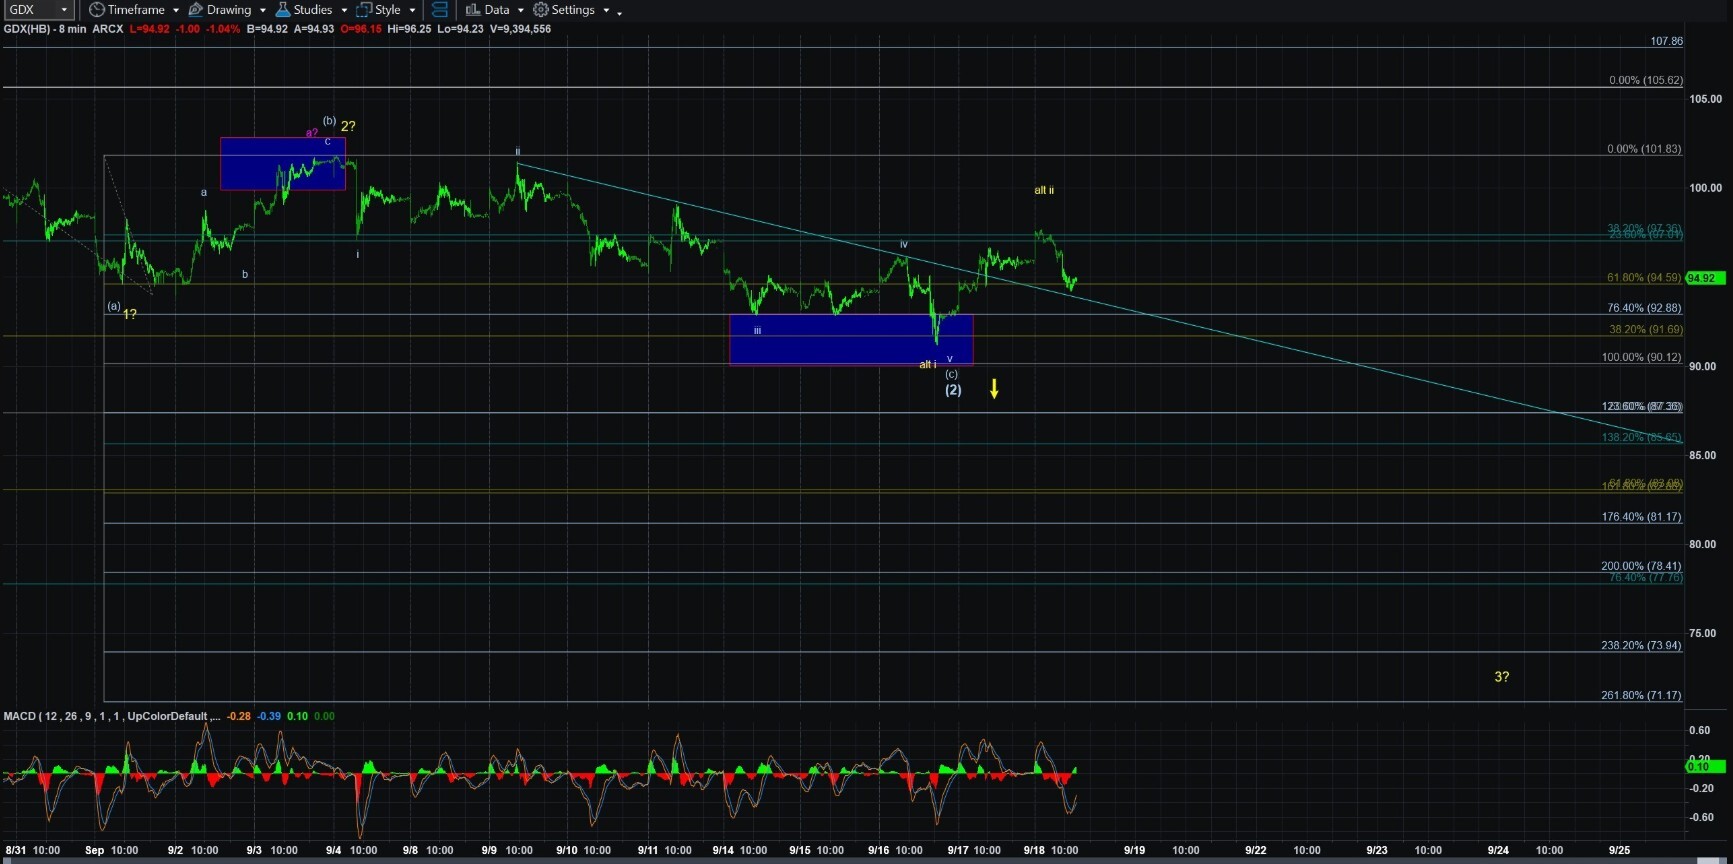
The yellow count looks completely plausible to me, though it remains an alternate. Avi suggested the most conservative approach is to place stops below this week’s low. At 35% invested in a potential rally that I do not want to miss, I am fine holding what I have through the yellow count (except for my stop loss on GDX, which I will respect). My personal risk tolerance allows it. Avi’s stop loss is good for traders who do not want to hold through the yellow count.
Other Trades – Bonds
TLT has formed what could be a completed corrective pattern to the downside, portending a rally to follow. And TLT has bounced a little off the low struck, but it appears to be only three waves up. Avi’s comment on TLT rang very true to both me and MarkZ; he said, “Not touching TLT unless I see 5 waves up over 84 … then I buy pullbacks with target of 105-110.”
Here is a chart posted by MarkZ on Friday to the Flagship Service: (tempting, but not ready)
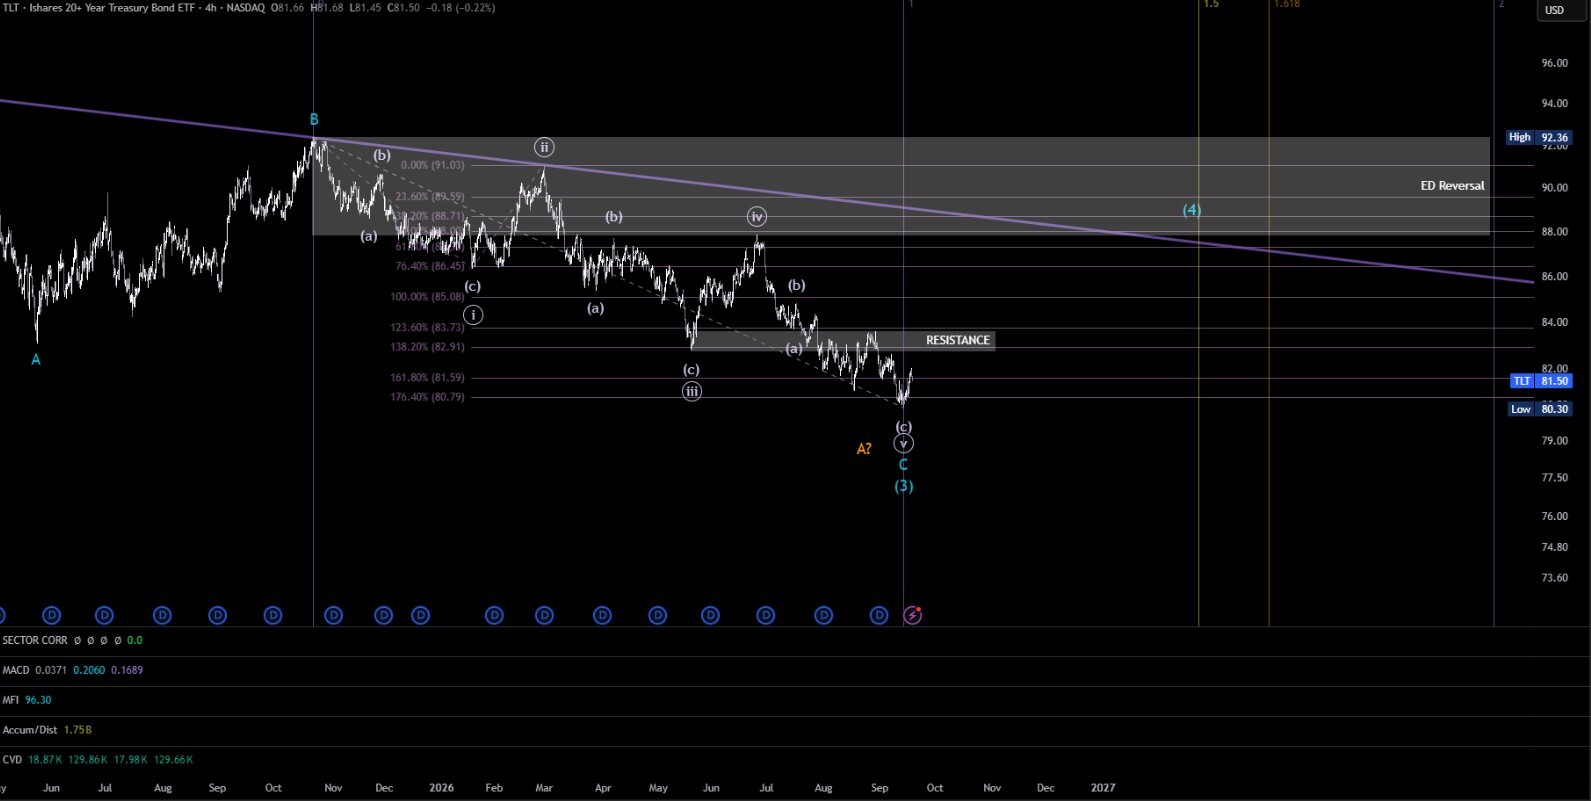
Mark’s analysis can be found here: https://www.elliottwavetrader.net/trading-room/post/10375969.
Other Trades – Natural Gas
I received several questions about a possible trade recently, and I got to work. The quick answer is that we may have a trade opportunity in the near future, but the context is not ideal.
First, I checked in with Arkady. His primary count looks like this:
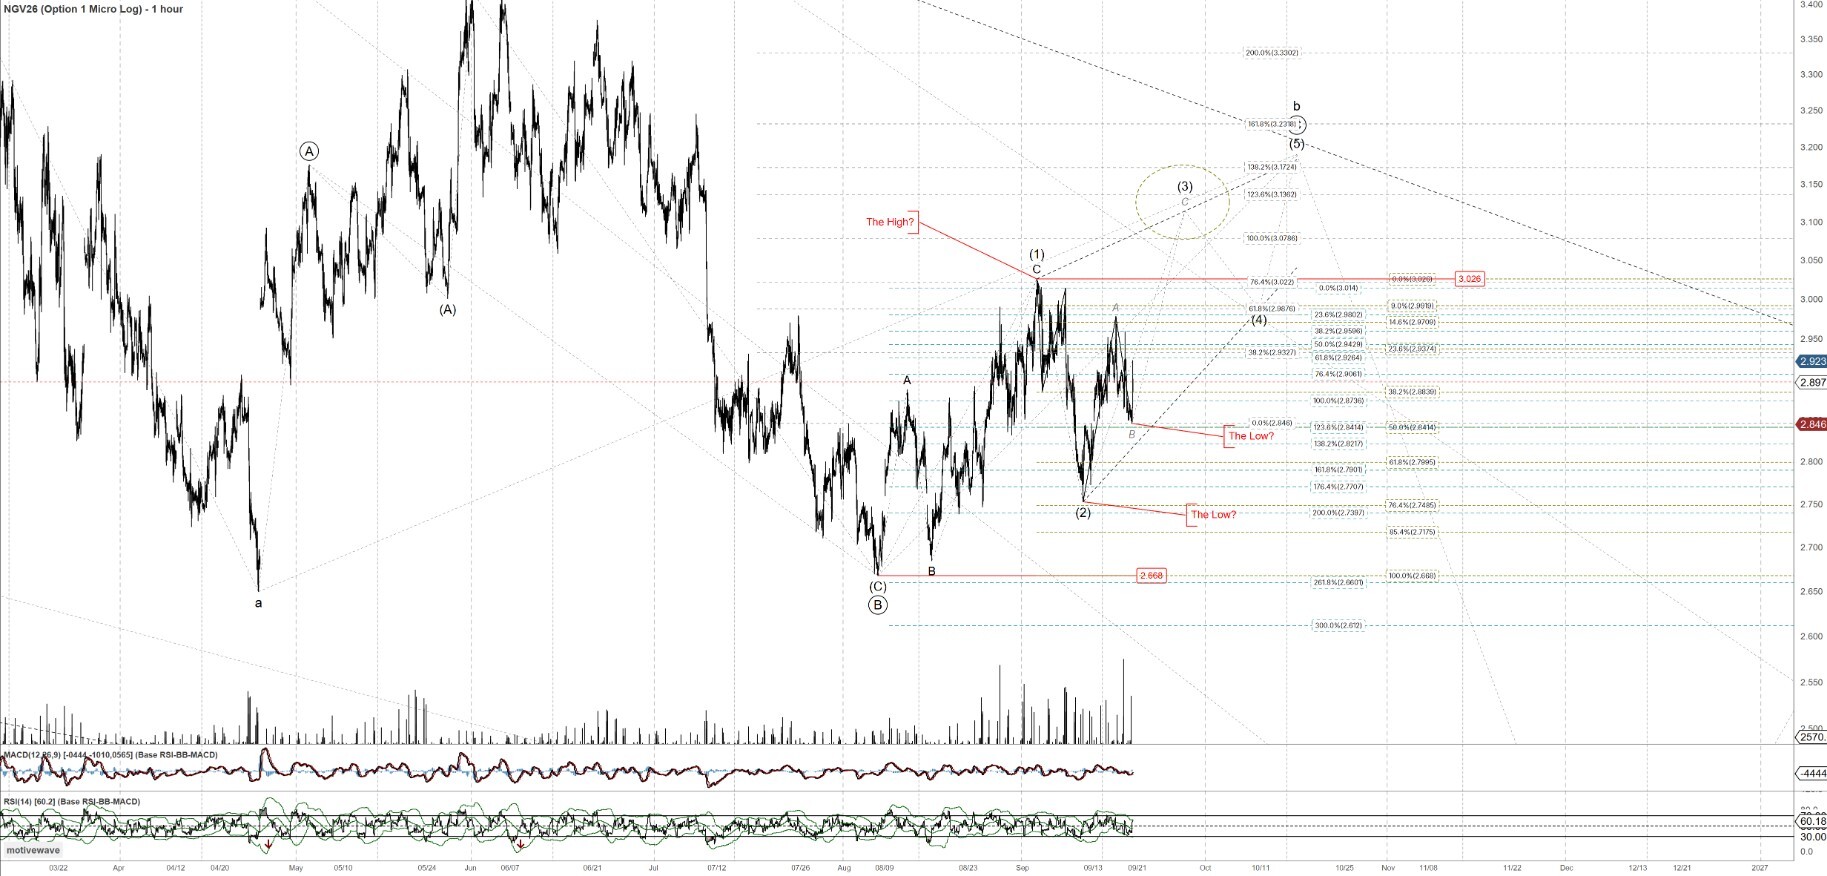
Notice the overlap off the low. The c-wave to the upside is an ending diagonal (the ‘A’ and ‘B’ after the completion of circle (B) are your first clue). I asked Arkady if he was trading this and he said, “No, I don't trade inside the diagonals in possible nested corrections. Unless the setup is too tempting - but this is not the case.”
The link to his post from Friday in the Flagship Service can be found here: https://www.elliottwavetrader.net/trading-room/post/10375993.
Next I researched what Jason had to say about natural gas. He also has an upside diagonal in play in the near term:
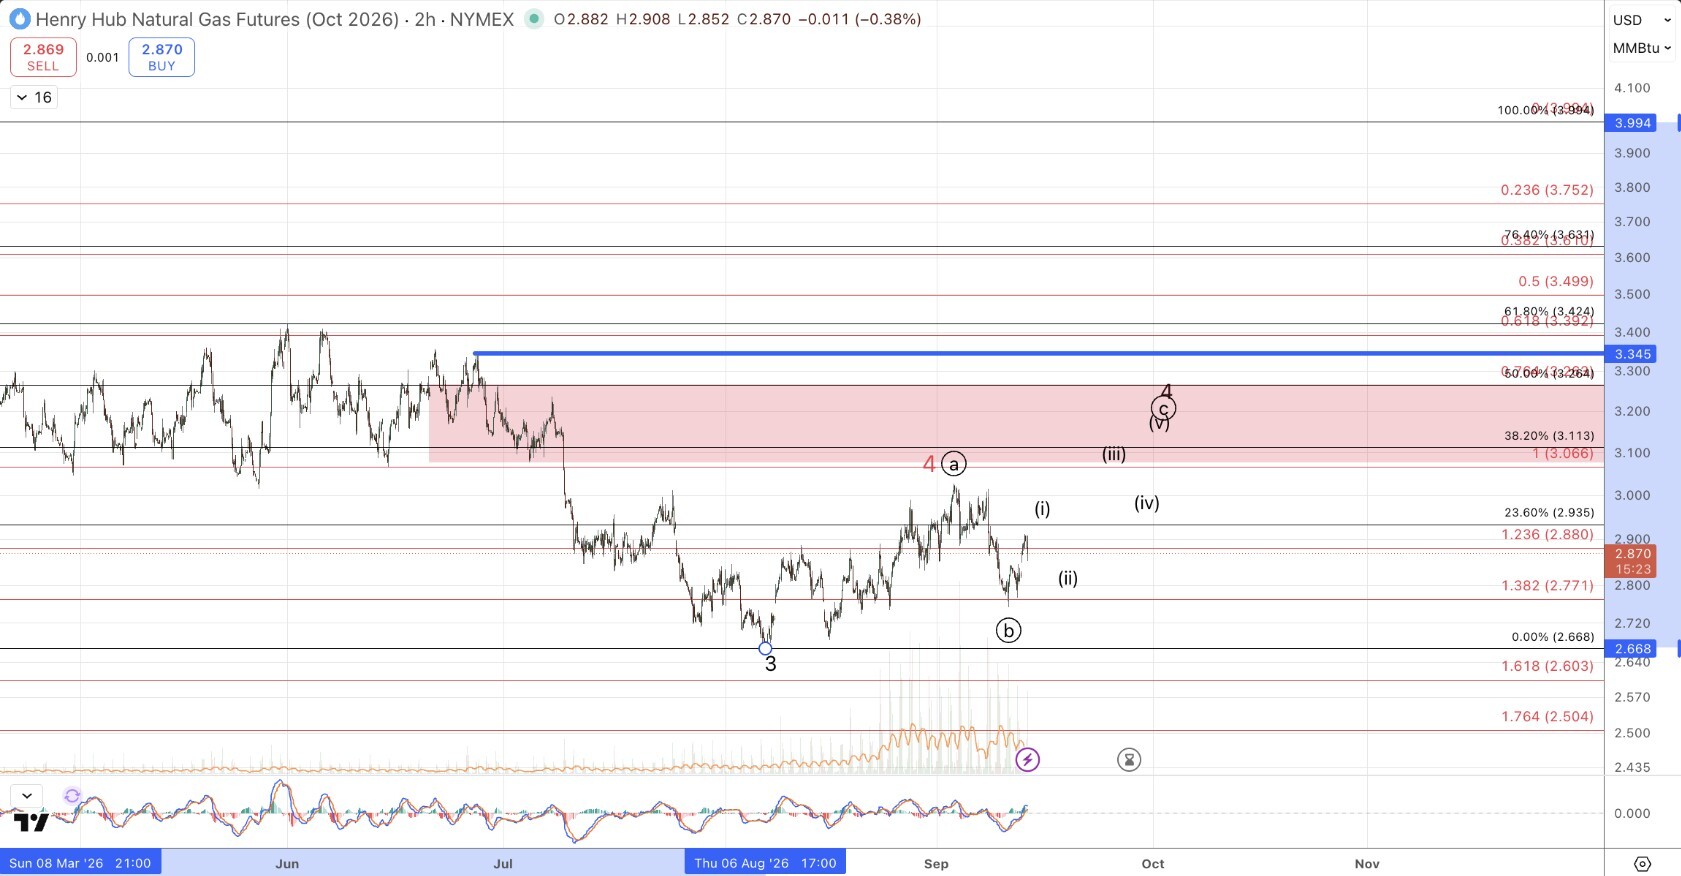
It is encouraging that both analysts saw an upside setup but Arkady’s was inside a B wave and Jason’s is inside a 4th wave. By then, I had lost most of my excitement for an immediate opportunity.
Jason’s analysis was posted to the Flagship Service on Monday, here: https://www.elliottwavetrader.net/trading-room/post/10370480.
Finally, I asked MarkZ what he was seeing because I know he was tracking it anticipating a possible trade in October. Mark’s chart is very similar to Arkady’s, above, and he said, “I don't expect much higher than $3.00 - $3.18.” Mark’s latest analysis was posted to the Flagship service on Thursday, here: https://www.elliottwavetrader.net/trading-room/post/10375598. Mark added that he is much more interested in an NG trade once all of this plays out.
Elliottitians speak about confluence of fibs and timeframes. I believe that confluence of analysts is also a factor, and we have direct access to some of the best on the planet. So when I research a trade I take full advantage of our website and set out to learn what the relevant analysts think. If I need to, I ask questions. The more analysts in alignment with a certain count, the more confident I am in that count.
It is clear that the analysts are stalking a trade on natural gas, but it is not the c-wave up that interests me most. It is the setup that may present itself when the pattern of one larger degree completes.
That is the beauty of how Avi encourages all our analysts to put out their analysis irrespective of counts by him or the other analysts. Because we know the analysts are not trying to agree, we can have confidence that when they do agree, they mean it. In this case, all three analysts agree on an ending diagonal up in progress. And all three see the setup as not ideal for trading at this time. But natural gas has their attention, and so it has mine now, too.
We are still waiting for a trend to emerge on the major equity indexes. SPX price will expand out of this range. I can be 100% certain of that. And because that can happen at any time, we must remain vigilant and have plans already in place. If anyone needs help with that, we should discuss it in the comments.
Have a good weekend and a blessed Yom Kippur.
