
In Case You Missed It ... Week Ending Friday October 9th, 2026
 By
Lou Alfieri
By
Lou Alfieri
In Case You Missed It…
SPX gained approximately 89 points this week on average volume. As noted last week, SPX has been compressing to the upside.
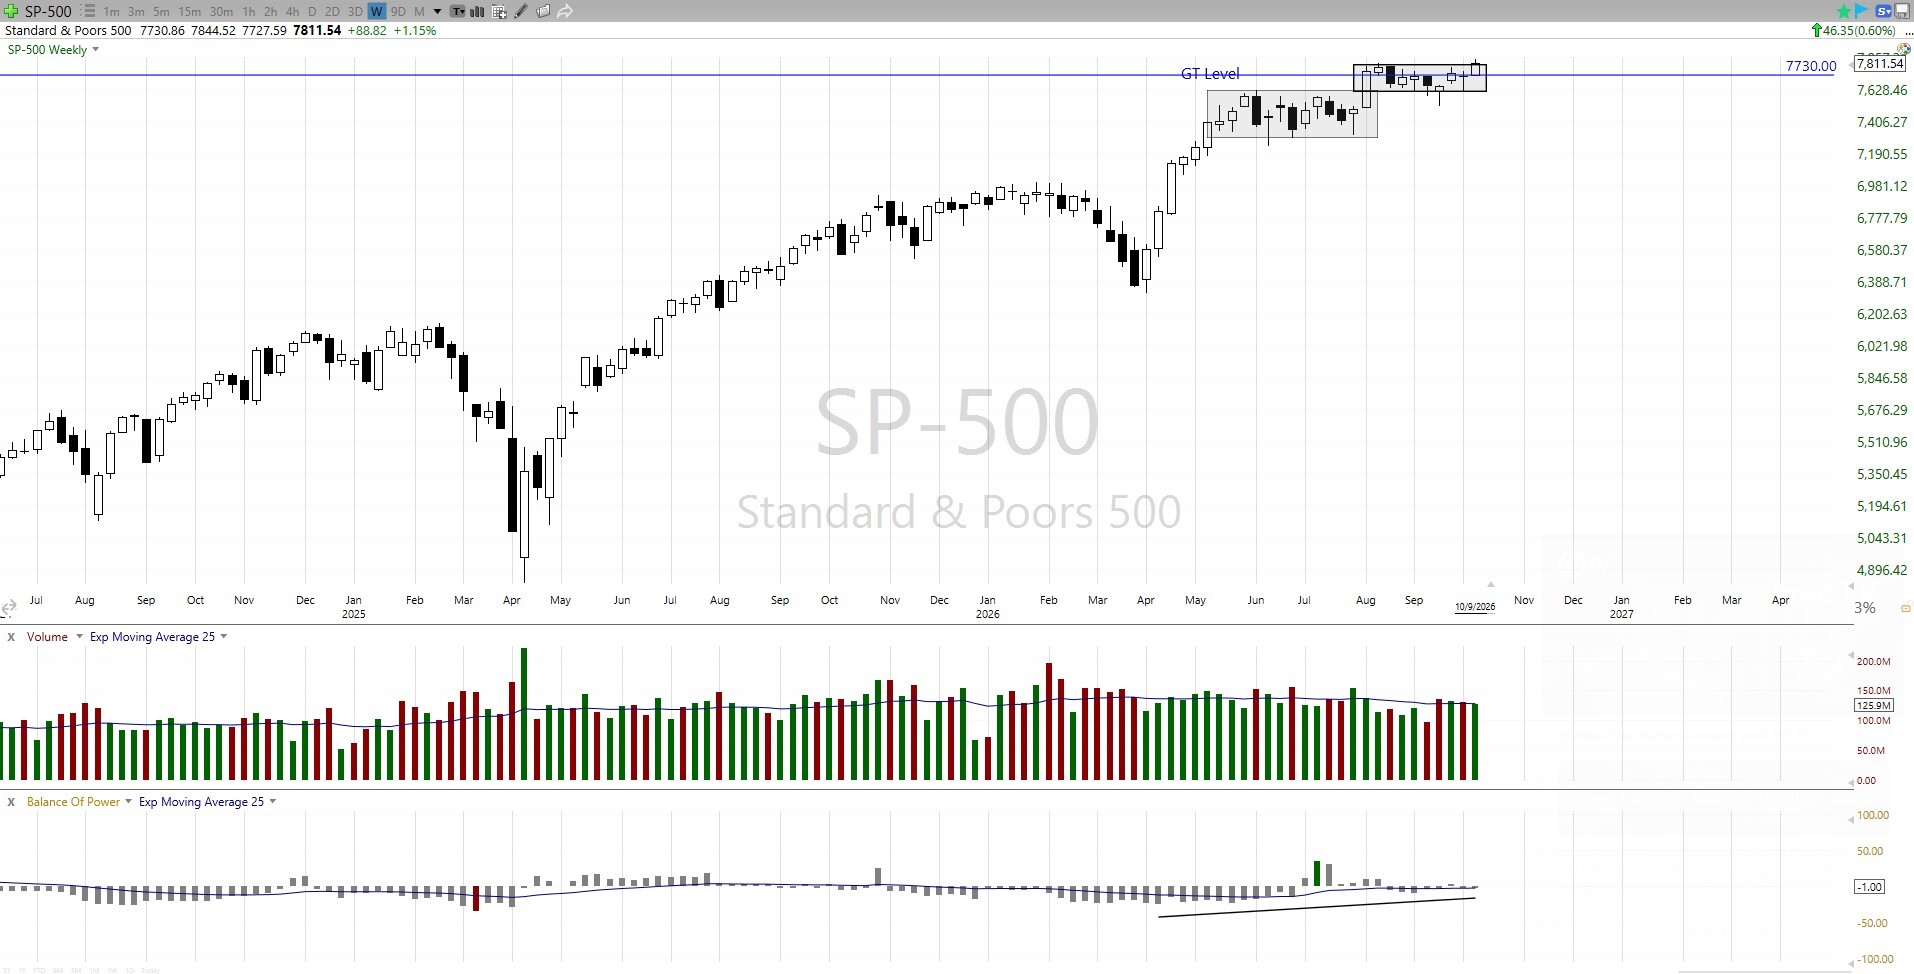
The SPX Gamma Threshold level is in the 7720-7740 region. SPX is comfortably long gamma and thus low volatility and slow upside drift should be expected. Learn more about the GT level here: https://www.elliottwavetrader.net/gamma-optimizer/Understanding-the-GT-level-202012076573537.html.
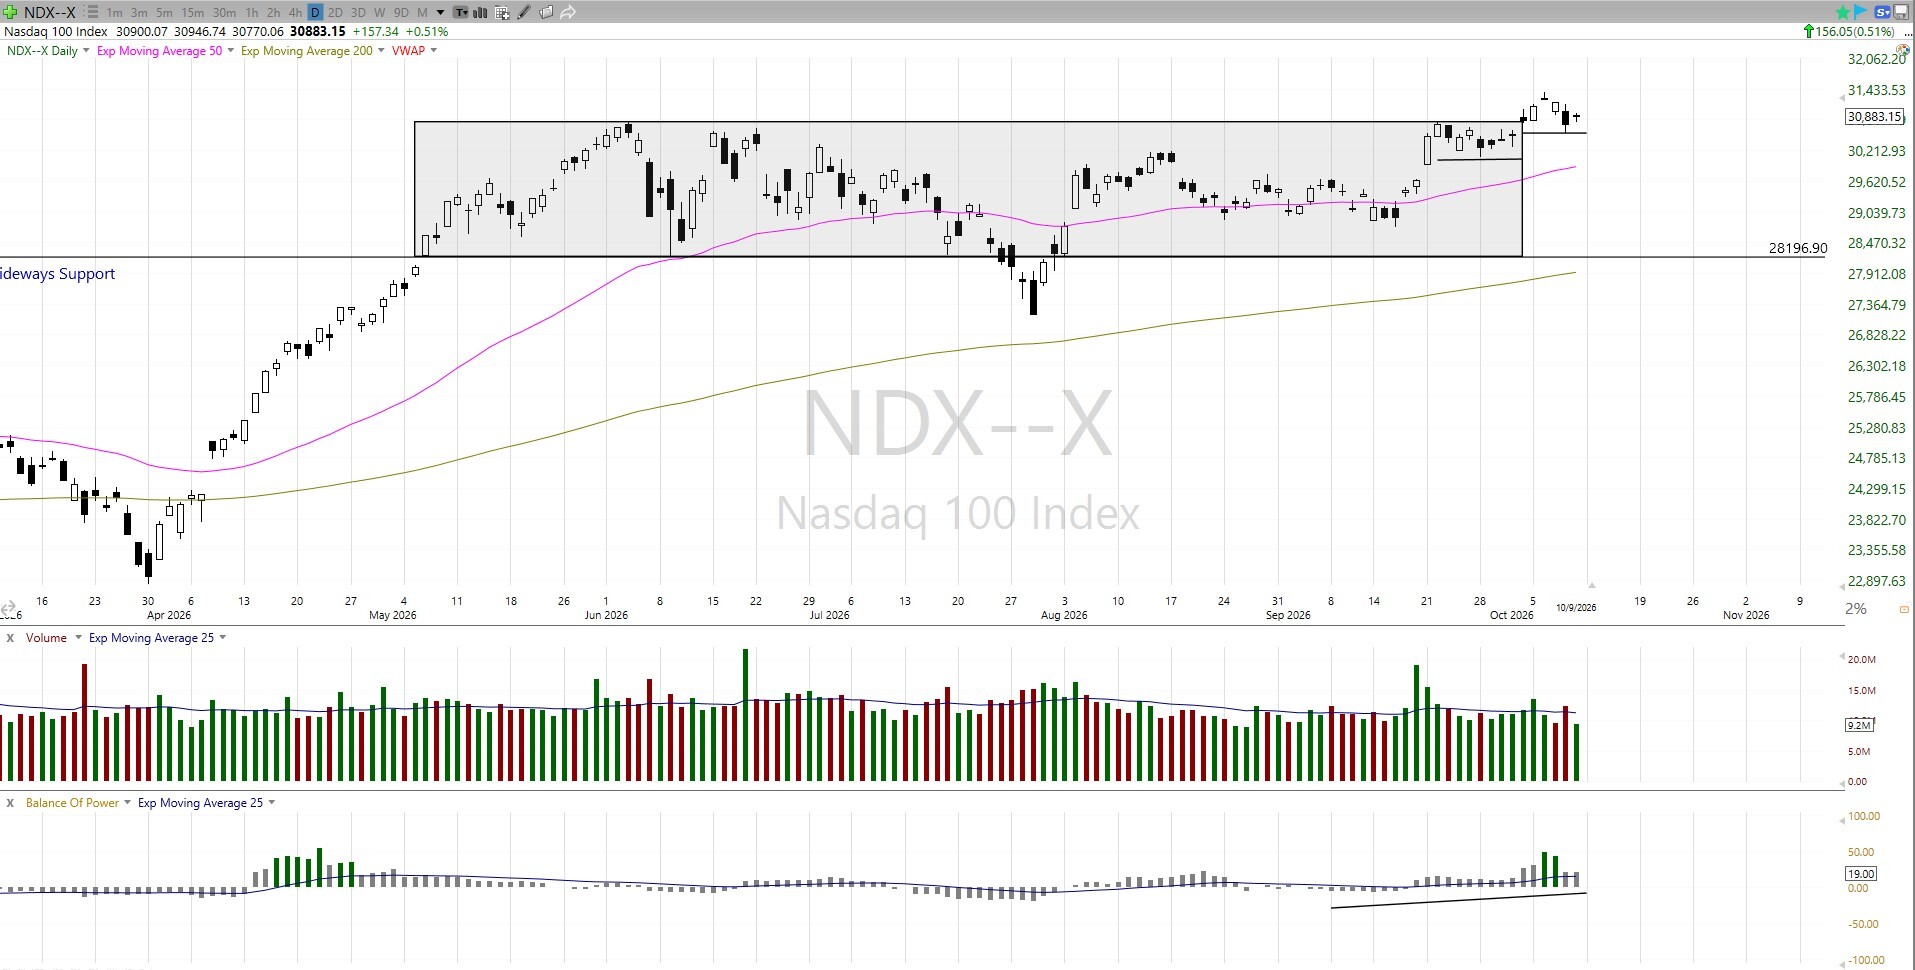
NDX made another new all time high on Tuesday of this week. The compression pattern to the upside is even more stark on NDX. Volume for the week on NDX was slightly below average with Friday being a low volume day. Neither of these charts are showing a sell short condition.
So where are we in the count?
On Friday afternoon in the Flagship Service, Mike posted the most recent Market Update post: https://www.elliottwavetrader.net/trading-room/post/10398006. Mike’s 30min ES chart lays out the near term projections:
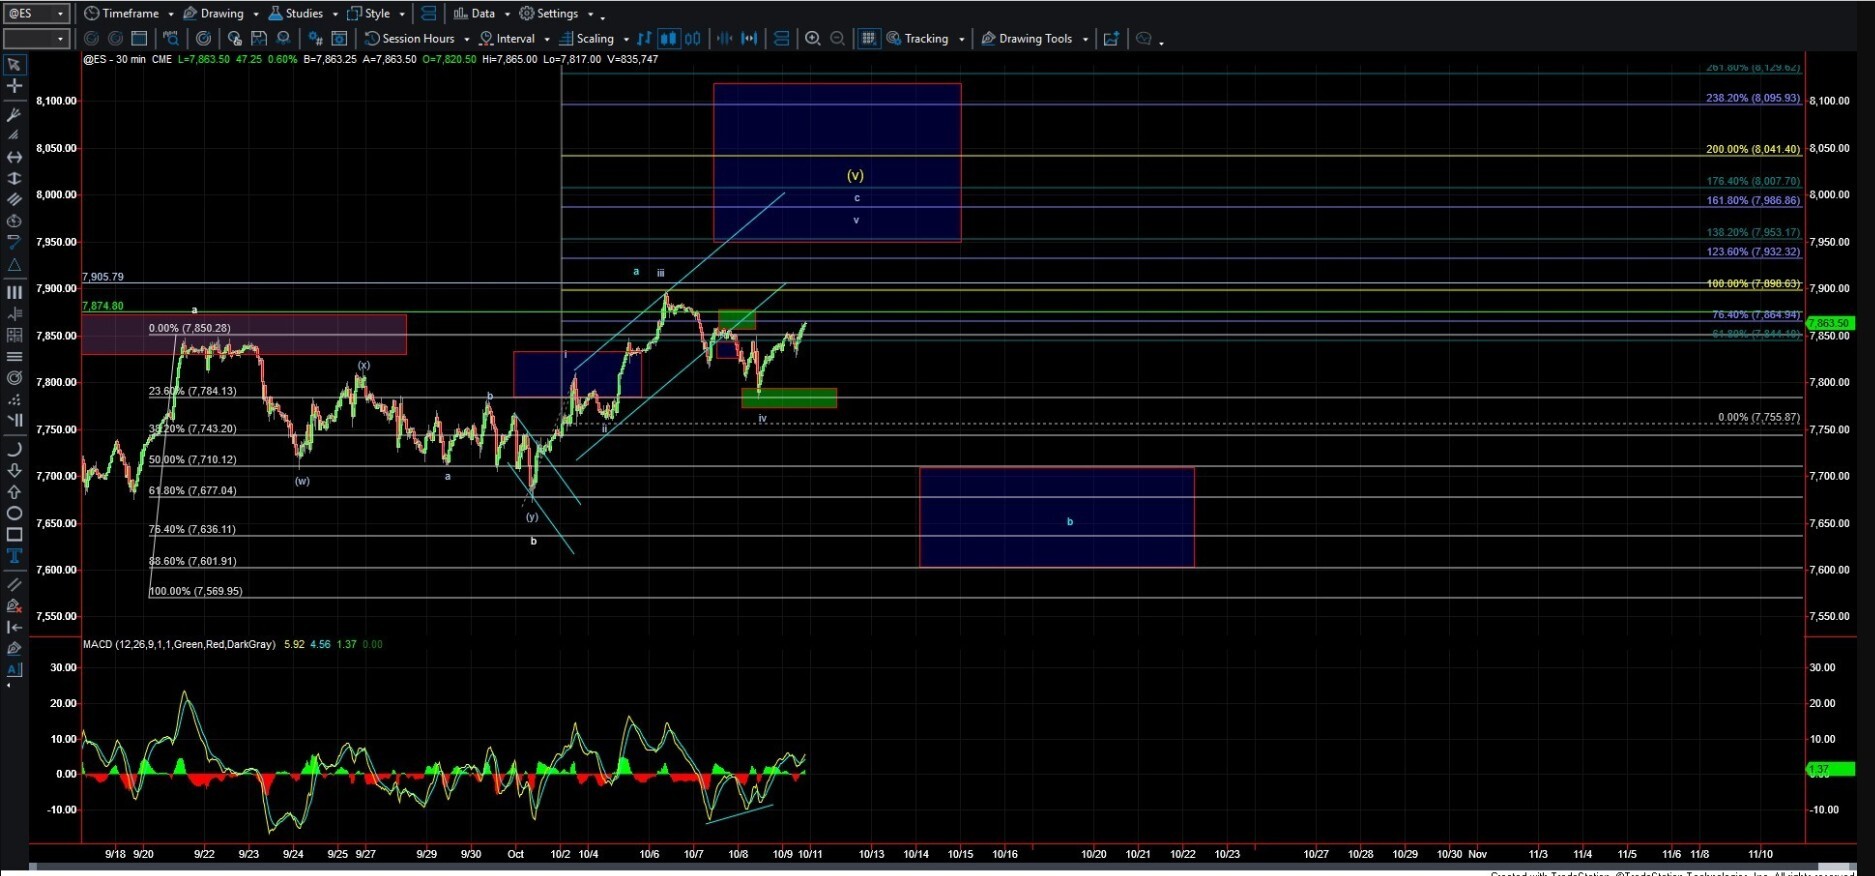
One path has us moving directly higher to at least a local top. A second path has us heading lower in a b wave first. To quote Mike, “Unfortunately, neither of the two potential paths higher is without its issues, making it difficult to favor one decisively over the other.” Of course, this ignores the red count. The red “Alt Top” is shown on Mike’s 60min SPX chart:
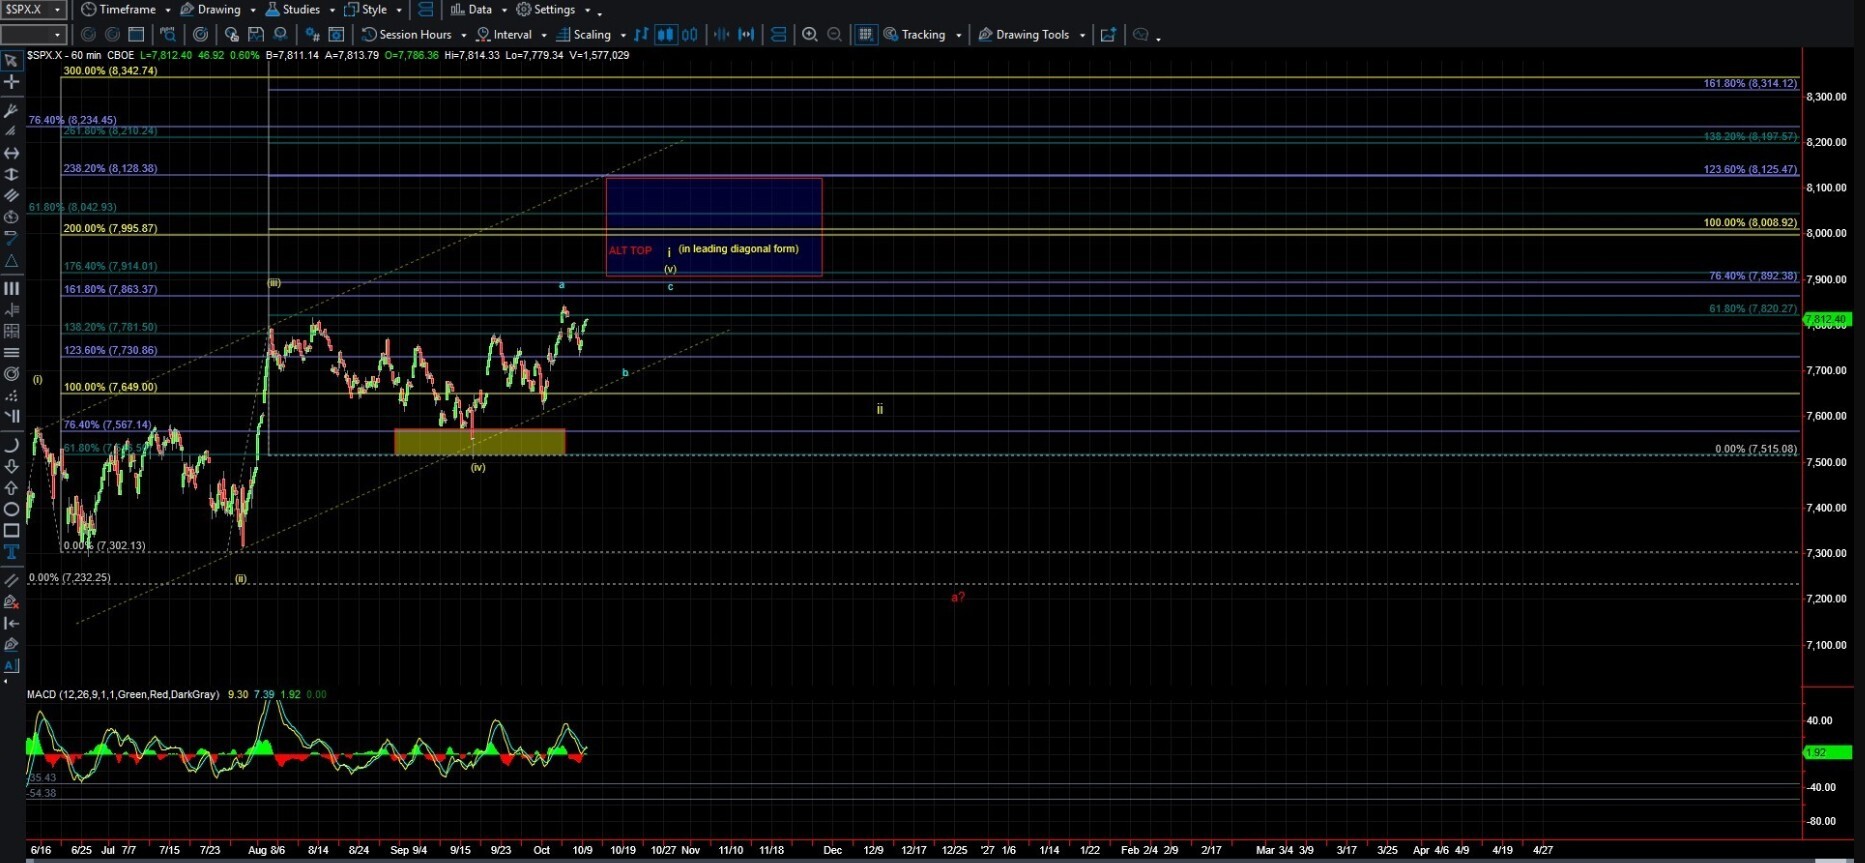
The red count would increase in probability if price formed a clear 5 waves down and/or took out support. Mike stated, “Should we break below the 7646 level, followed by a break under 7500, it would open the door to the larger diagonal having already completed, whether following the yellow or red count. However, as long as we continue to hold that broader support region, I still think the cleaner interpretation favors at least one more push higher before a more significant top is formed.”
It should also be noted that a break of Avi’s wave 2 at 7233 would place the red count front and center, but there is a lot of room between 7500 and 7233. Additionally, price could be completing ending diagonals of multiple degrees and it behooves us to have action plans in place should we see a sharp reversal.
Volatility
Volatility as measured by VIX came down slightly this week to 14.84. VIX is slightly elevated and seems very comfortable in the 14.5 to 16.5 region. Liquidity sputtered at some points this week but did improve slightly over the past couple weeks. If liquidity continues to improve next week it will support more upside in equities.
Other Trades – Metals
Metals have been… busy, for lack of a better word. I will try to simplify things as much as I can. I will attempt this using two silver charts.
First, know that Avi does not yet have the 5 waves up he would like on gold (/GC). Avi has also not been shy about discussing his positioning in the complex, and is getting close to fully invested. I still own about 40% of what I plan to invest and stopped out of my GDX position. I plan to re-enter GDX on a corrective retrace after 5-up. I also plan to continue adding to my miners portfolio (both precious metals and uranium) using our Metals, Mining, & Agriculture’s Wave Setup list.
If Avi is so positioned, then shouldn’t we all be significantly invested by now? Avi’s 144min silver chart would support that view:
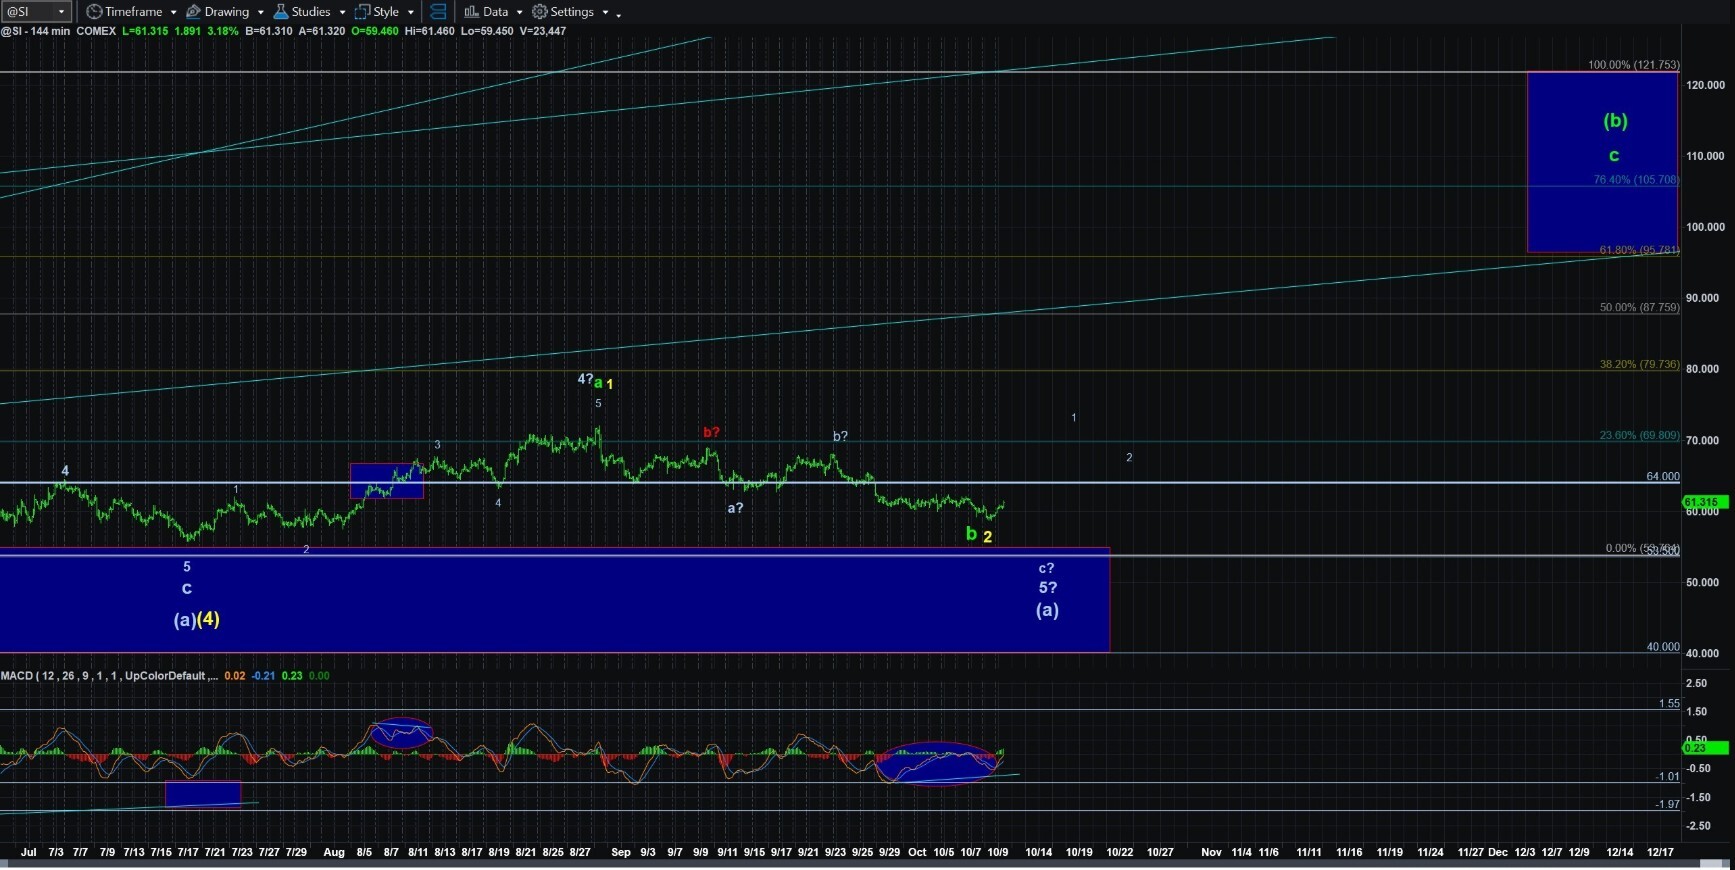
The skew on this chart shows large point gain potential with a relatively close stop loss level. And long term investors who size their position to match their risk tolerance can choose to trade this chart without delving deeper. Delving a little deeper, here is Avi’s 5min silver chart:
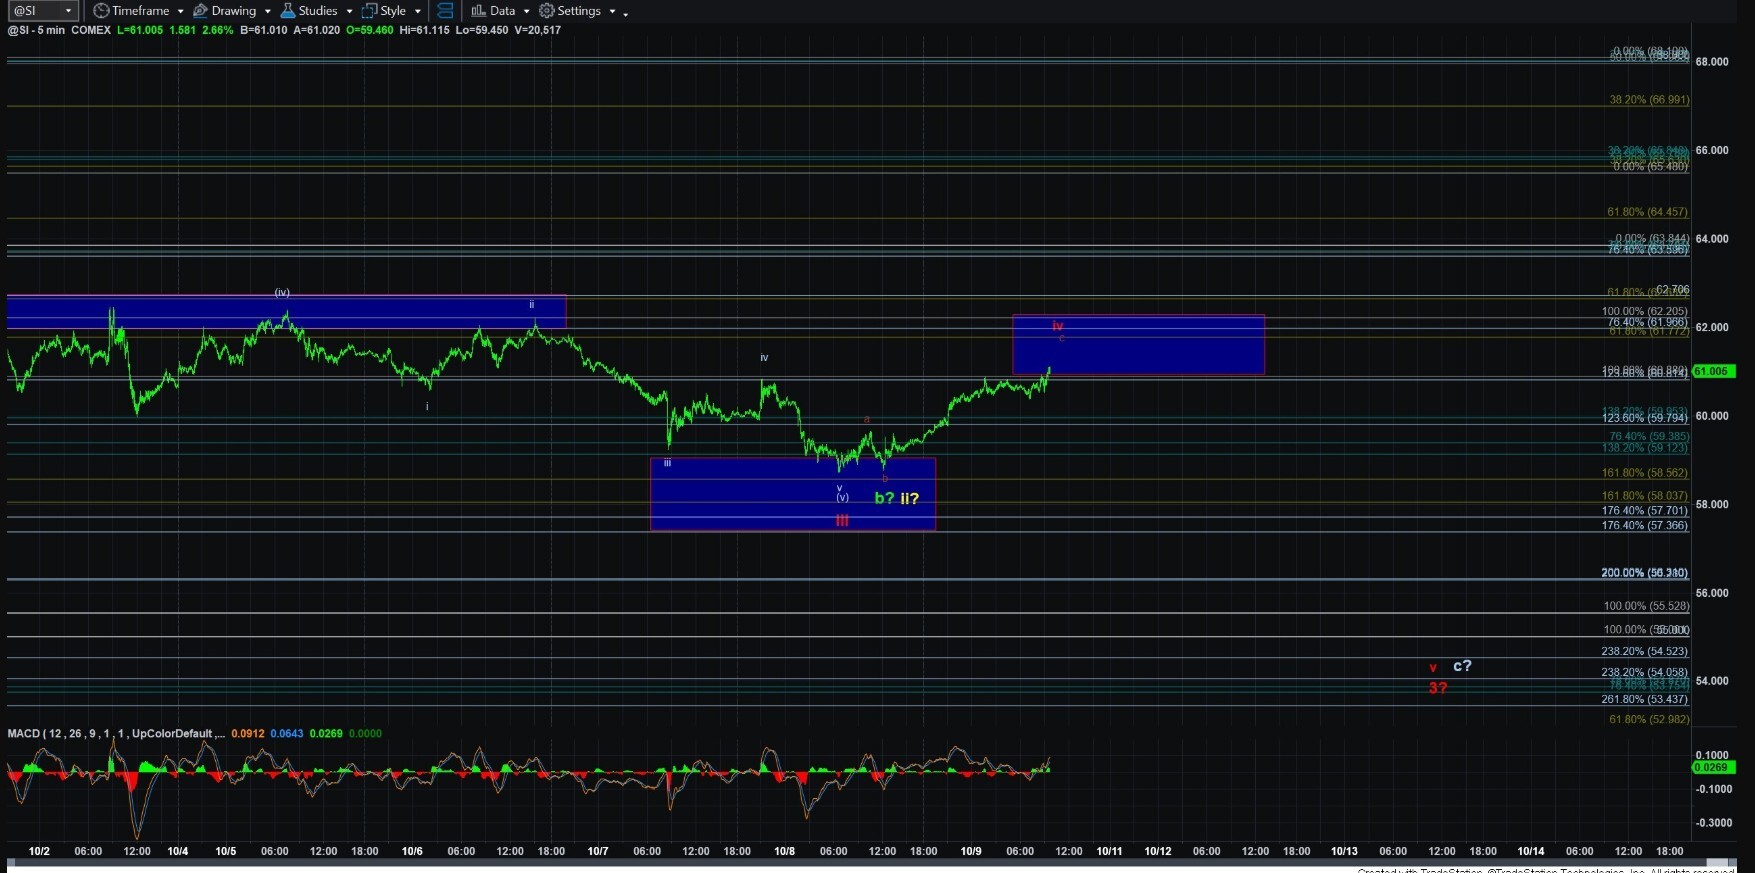
Many traders would prefer to remain cautious while this potential path lower looms. This is why I think an approach of being partly invested for now is wise. I have positions that will benefit from an immediate breakout and I also have room to add lower or, preferably, after a corrective retrace following a larger degree 5 waves up. There is no one-size-fits-all solution to investing and trading which is why all the analysts can do is share their own positioning but the decision of when and how much to invest is a very individual one.
ICYMI – Bi-Weekly Sector Review
Last weekend, analyst MarkZ posted his bi-weekly Sector Review. These can be found here: https://www.elliottwavetrader.net/trading-room/post-type/initial/section/366/links/1. Mark’s latest review covers the 3rd quarter and year to date performance of each sector.
ICYMI – Daily Beginner’s Reports – “Key Takeaways”
Every afternoon, Avi or Mike will post the daily “Market Update.” This is a more detailed look at the market than the intraday market “wave alerts.” Mike recently announced a beginner-friendly break-down of the Market Update posts, called “Key Takeaways”. These beginner’s reports are produced by Mike and his AI model (trained on ElliottWaveTrader content). They explain the Market Update in beginner friendly terms and highlight any teachable items in the report. The Key Takeaways reports are posted in the reply to the Market Update and are available to Flagship Members. I am attaching the most recent report to this post.
ICYMI – Fibonacci Markets & Stocks
The following links to a compilation video of Carolyn Boroden’s NVDA analysis this week. https://www.elliottwavetrader.net/videos/A-Week-of-NVDA-Target-Timing-Pullback-Carolyn-Boroden-2026100925683.html .
It is a short, 3-minute video that follows along for 5 sessions as Carolyn flags a key extension target and a timing window for a possible high, discusses trailing stops as the move gets extended, and then shifts to identifying new support zones for potential buy entries once the pullback arrives. It’s a real-time look at how she combines price targets, timing, and trend parameters to help members manage a trade from one stage to the next.
ICYMI – Beginner’s Circle Weekly Webinar
On Wednesday afternoon, lead analyst Zac Mannes hosted the Weekly Webinar for the Beginner’s Circle. Zac covers a lot of ground, from equities to metals, oil, natural gas, and bitcoin. The video is here: https://www.elliottwavetrader.net/trading-room/post/10395542.
In addition, Zac posted a follow-up post to that video, with charts, here: https://www.elliottwavetrader.net/trading-room/post/10398099.
Conclusion
Avi and Mike agree that the major equity indexes would look better with one more push higher in a 5th wave. However, both are wondering aloud if a local top has already been struck. The picture is less than clear. Perhaps the most important take-away is that once a top has been struck, the nature of the pullback off of that top has the potential to inform us as to the likely path equities will take in the intermediate to long-term. That is what I am looking forward to learning over the next couple weeks.
Have a wonderful weekend everyone! As always, please feel free to ask questions or type “@Lou” into a post during the week to get my attention.
