
In Case You Missed It ... Week Ending Friday August 21, 2026
 By
Lou Alfieri
By
Lou Alfieri
In Case You Missed It…
I was unsure what to expect this week, but was ready for continuation higher. We got slight weakness instead. The larger takeaway is that equity indexes did hit a new high in early August, traded sideways for two weeks, and is now headed down to test the top of the sideways range it had been in for months. Volumes are consistent with summer trading.
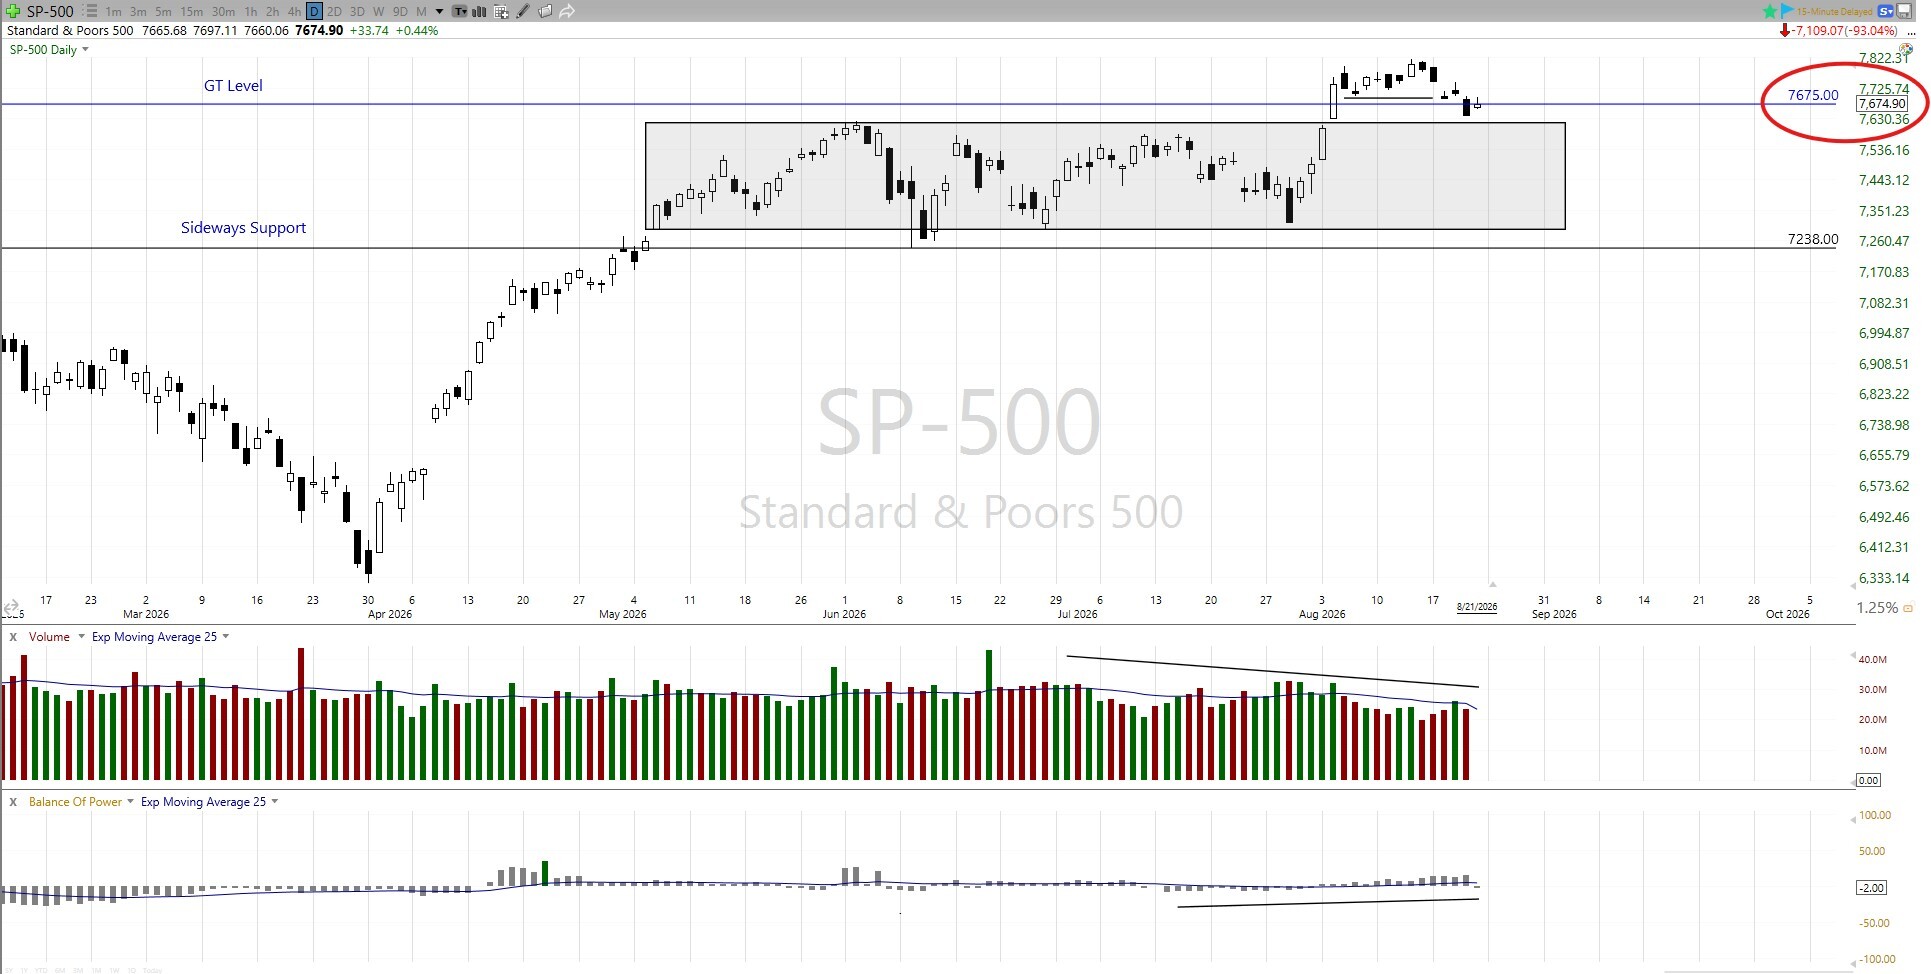
SPX closed the week at 7674.37, approximately 111 points above last Friday’s close and right at the Gamma Threshold level. The GT level currently sits close to 7675 SPX and has been stable for the past few sessions. (If we are near the GT level on a Friday morning, it is quite common to close the week at or near that level.) Analyst and host of the G.O. Room, Leo, updated the Flagship Service on the GT Level Friday, here: https://www.elliottwavetrader.net/trading-room/post/10348931. This post also provides a link to an explanation of the GT level.
Last week, Avi’s yellow count on SPX was looking very promising. This week, price retraced back toward its prior sideways range. NDX never escaped it’s sideways range (to the upside).
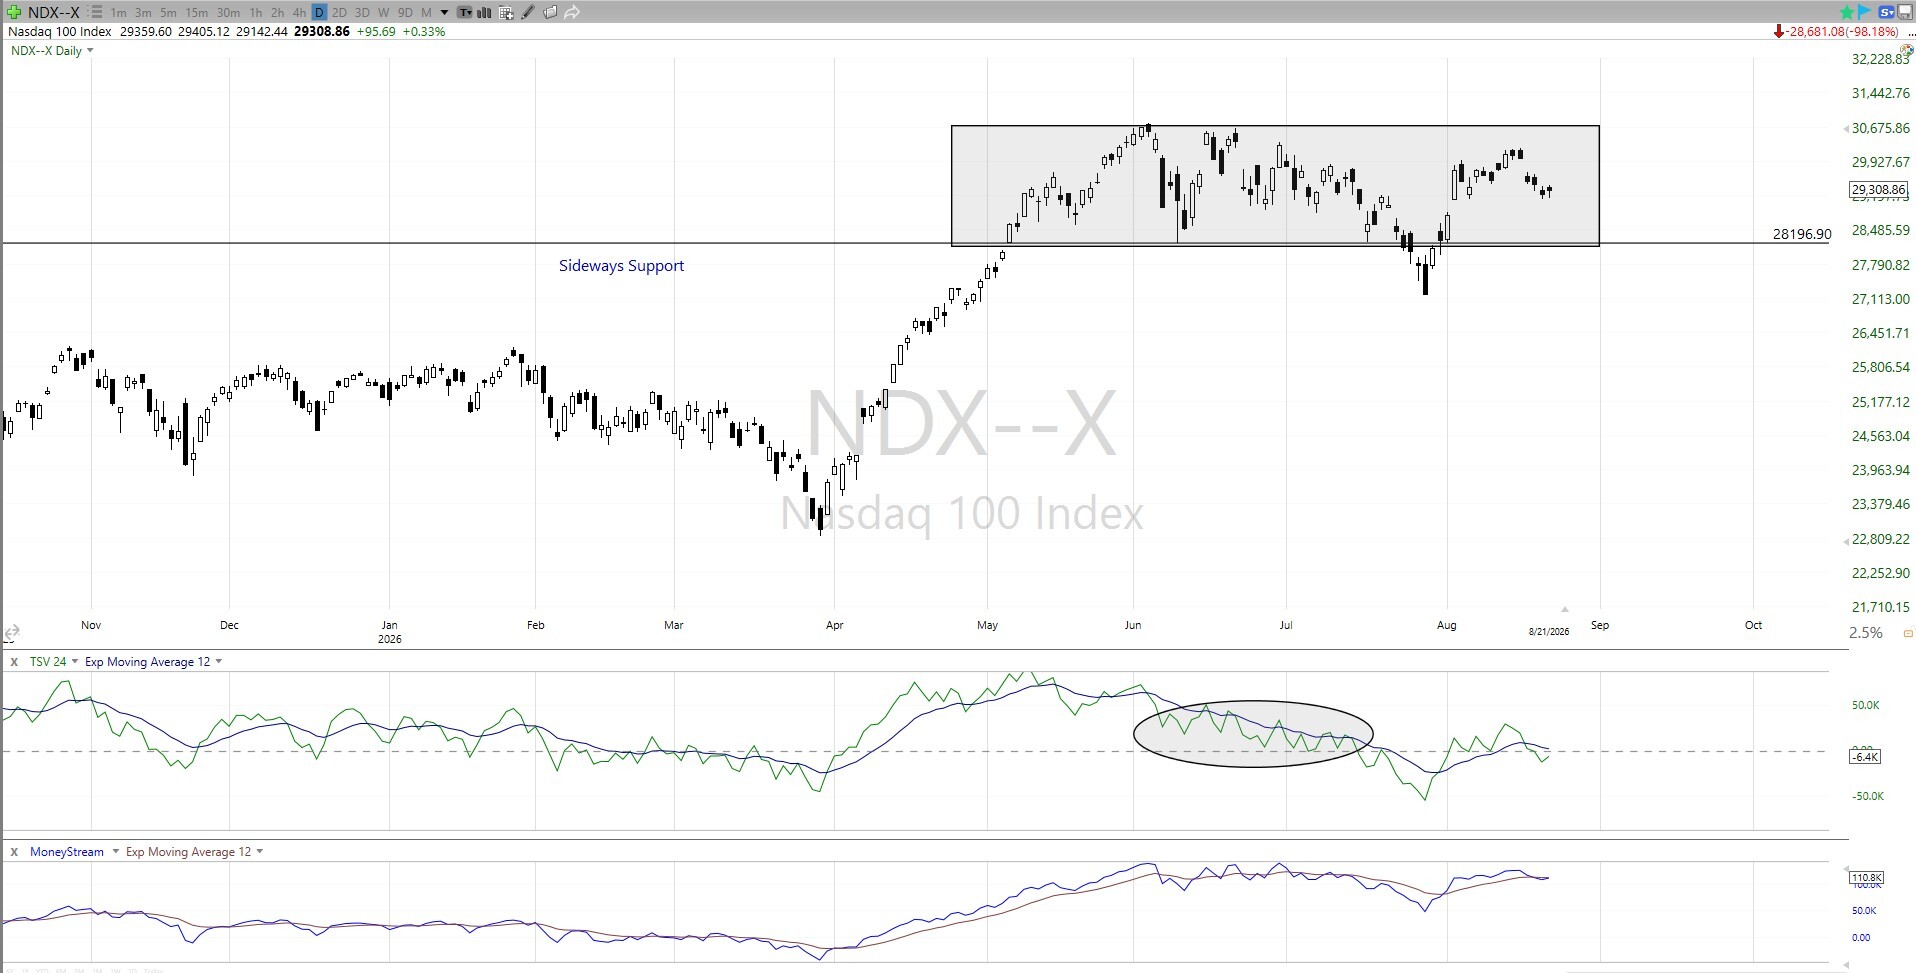
The two major indexes are exhibiting slightly different postures, from a basic TA standpoint. SPX is trying to establish a platform above its prior high while NDX chops around. There is a lot to go over this week (including Jason’s equity charts), so I will put a pin in equities for now by briefly going over Avi’s counts:
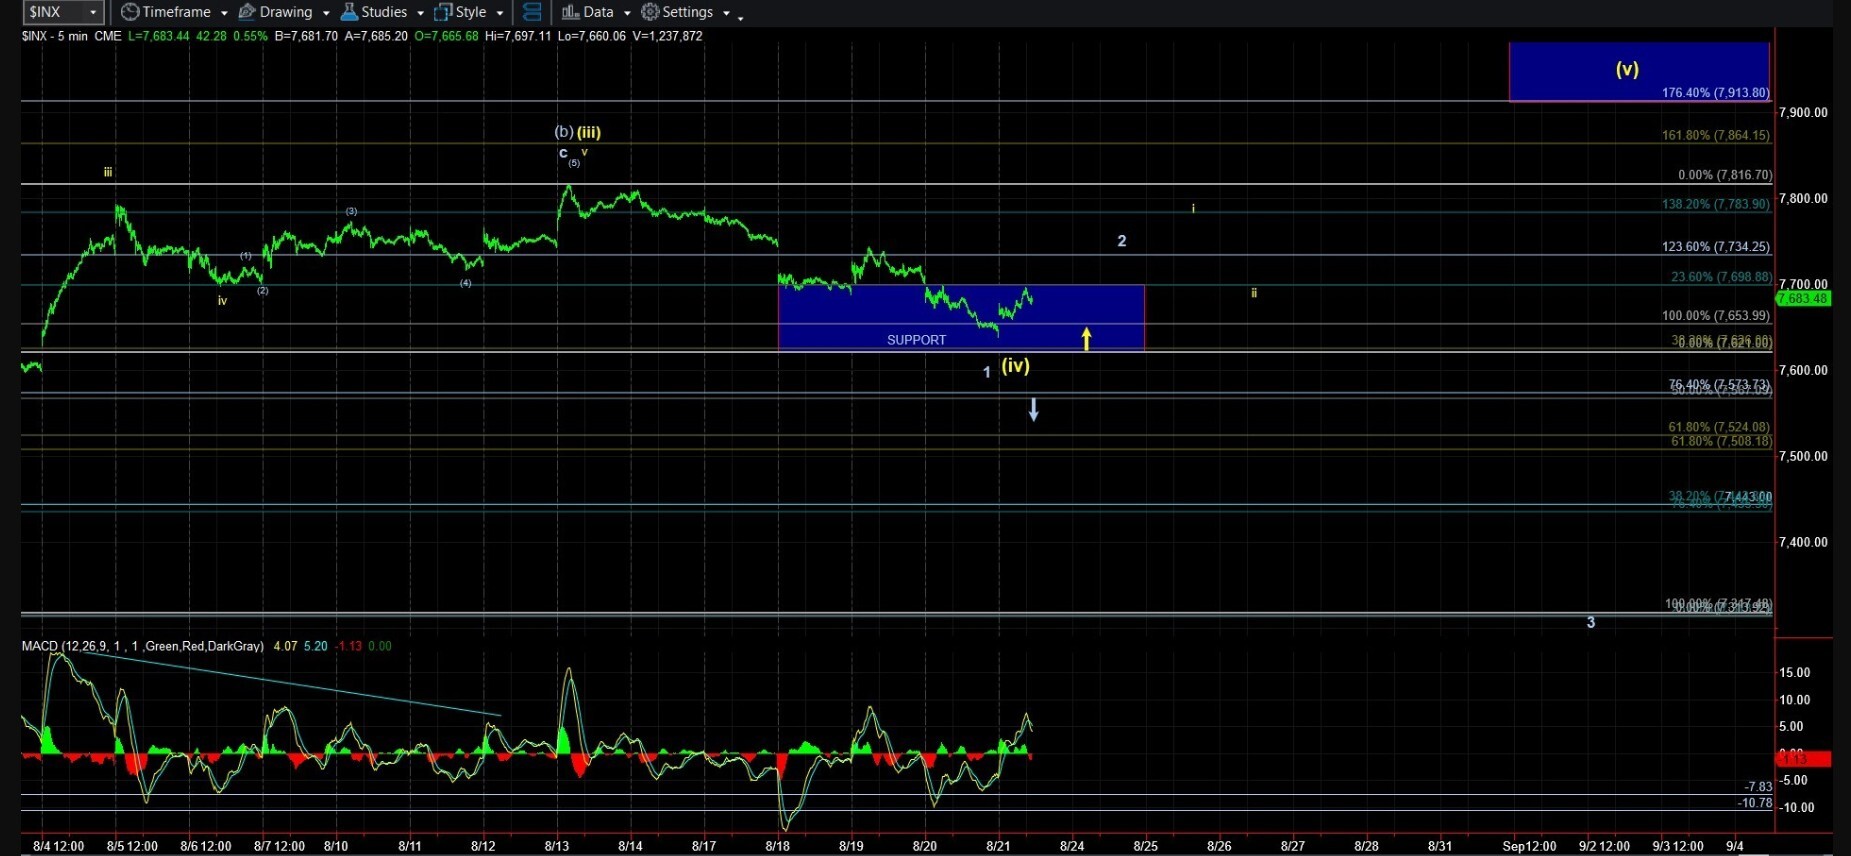
There are still two colors on the near-term chart: white and yellow. Avi added a place-holder 1-2 to the yellow count. Last week we discussed looking for a corrective pullback into Avi’s blue box. If that pullback was corrective (we will talk more about this later), we were on alert for a wave (v) to the upside to begin. Well, that pullback may not have been corrective. To quote Avi, “The next bigger degree move will come after either the yellow i-ii takes shape in the coming week, or a break of support. Simple.”
Volatility
Volatility perked up a little this week, but VIX returned to the low 15s by Friday’s close.
The Metals (and Miners) Trade
The complex rallied again this week. Our analysts still agree that a pullback across the complex would be most probable from an Elliott Wave perspective. The nature of that pullback will determine if we will be refreshing our positions on a wave 2 pullback.. To that end, Avi is quite pleased with the structure of what looks like a wave (1) on GDX. The bearish thesis would come into play if we were to decline impulsively. I’d rather not paraphrase Avi so Flagship Service members can read his latest thoughts, posted Friday, here: https://www.elliottwavetrader.net/trading-room/post/10349375. I am sure he will provide more detail in the Weekend Metals Update, but this trade is straightforward for now.
Avi did re-iterate this week that it may be prudent to hedge your metals exposure at this juncture. I did this by trimming a significant amount of my holdings. But there is no one-size-fits-all approach to hedging and Avi discussed how he is approaching this with members of the main room in this thread, posted Friday in the Flagship service: https://www.elliottwavetrader.net/trading-room/post/10349298. The entire thread is a sneak peek of Avi’s approach to hedging so I suggest reading the comments as well.
Oil
We have a new chart to monitor. It takes a lot to get me interested in trading oil or natural gas. This week, Avi brought the following chart to the attention of the Flagship Service:
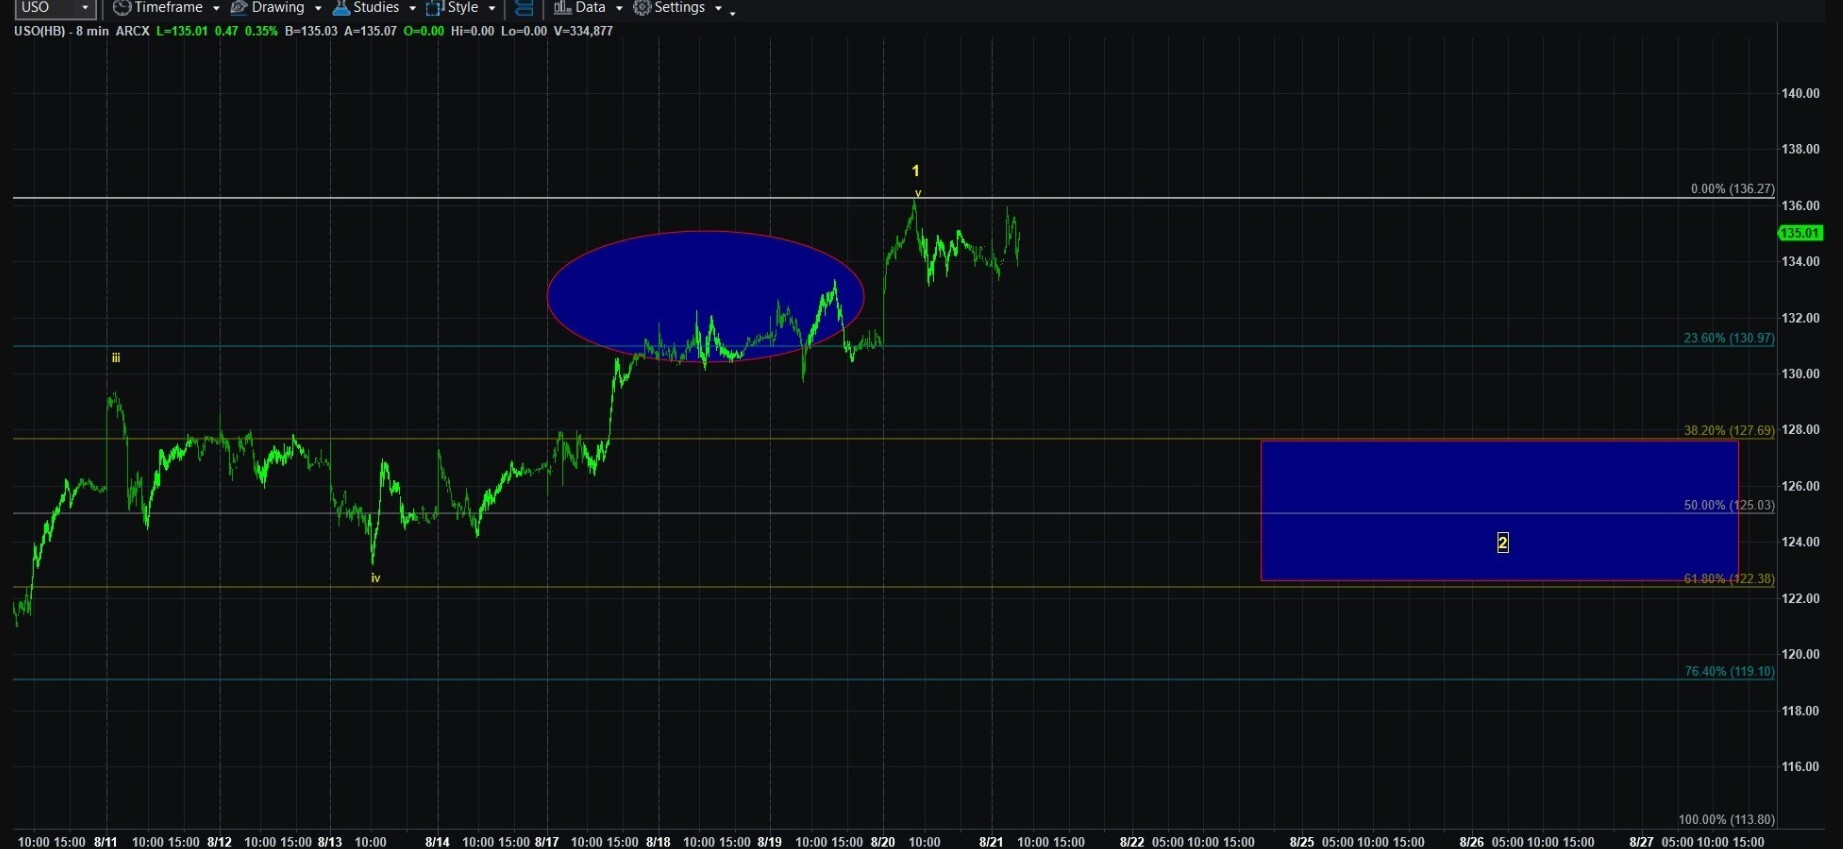
This is the latest USO chart from Avi. He is looking for a “CLEARLY corrective” pullback in order to adopt the yellow count (the emphasis was Avi’s). Here is what I understand that to mean: he is not ready to adopt the count shown yet. He wants a proper corrective pullback first. So that is what we should be looking for, too. For now, that is all there is to do.
Start Using Elliott Wave Analysis Yourself
You do not need to be an expert at Elliott Wave analysis to make valuable and effective use of the framework starting right now. I mentioned several times already the need to assess whether the next move on a chart is corrective or impulsive. One does not need know the exact target fibs for a fourth wave in a leading diagonal to put Elliott Wave into practice. It is very helpful to just be able to recognize a corrective vs impulsive wave pattern. It is not hard to look for and spot overlapping price action.
For example, if I am planning to short ES futures at 7700, and we approach that level from below in an impulsive fashion, without overlap, then I would hesitate. The weight of the evidence in favor of shorting will have significantly lessened. This is a simple way to incorporate EW into your everyday trading. If, on the other hand, we approached 7700 with a lot of overlap, the weight of the evidence for shorting would increase and I would have higher confidence in the trade. This is an easy, quantitative way to assess a trade setup in real time.
The Bearish Count in Equities
In the context of trading I have been taught to “trust your instruments.” But if you’re like me and are not comfortable with the whipsaw and knee-jerk nature of this market, then you want to be prepared in case we have to get bearish quickly. Analyst Jason Appel presented clear charts and analysis for that scenario this week. He did so in the Beginners Circle on Thursday: https://www.elliottwavetrader.net/trading-room/post/10346972.
Jason states that one more high in equities (ES) is certainly on the table and he discusses the levels he wants to see taken out (impulsively) to the downside in order to invalidate that potential. He notes that he is curious to see how SPX/ES react to revisiting their prior highs, which they may do this coming week. I am watching for the same thing.
If you belong to the Flagship Service, Jason also provided excellent coverage of NQ, RTY and EEM throughout the week and laid out parameters for a short trade on MME (emerging market futures) in his Applying EW Counts Webinar on Thursday and posted about it on Friday in the Flagship Service, here: https://www.elliottwavetrader.net/trading-room/post/10348791.
To be clear, Jason is not calling for a decline in equities. Jason is tracking a downside potential and plainly stating what he would need to see to be convinced it is playing out. He is not convinced yet. (I purposefully did not include a chart because the bearish count is front and center and I did not want someone to see the chart without reading and place a trade. See Jason’s Beginners Circle post, linked to above, for his ES and SPX charts.) For convenience, here is a link to Jason's posts: https://www.elliottwavetrader.net/trading-room/post-type/initial/user/18885.
Next week contains two timing catalysts that I am aware of: NVDA earnings on Wednesday after the bell, and Kevin Warsh should give his Jackson Hole speech on Friday morning. Don’t forget, though, that while a catalyst can serve as a trigger for price movement, it does not determine the direction of that movement, which is why traders who trade based on “news” do so poorly. All that is to say I am unsure where equity index prices are going next week, but we have Avi's and Mike's charts and we can see which of the two paths fill in. As we approach Wednesday’s close I do expect increased realized volatility.
Enjoy your weekend, everyone!
PS. There was more I could write this week. For example member Kenneth_Aydt does amazing work with fractals and even has managed to find a timing edge by identifying two timing windows per month when price reversals are more likely to happen. He has made some excellent posts this week. Also Fib Queen Carolyn Boroden shared some of her charts with the Flagship Service this week. Searching both of their names will yield interesting results.
