
In Case You Missed It: Mike's Friday Afternoon Market Update & More
 By
Lou Alfieri
In Case You Missed It…
SPX lost approximately 36 points this week. The NDX fared a little worse, while IWM and DIA ended the week in the green. I was distracted for the latter part of the week due to travel plans and a wedding this weekend. I need to do a little catching up. I am going to walk through the process of re-orienting myself after time away from the market.
First, I want to briefly look at the larger picture on the major equity indexes. I can immediately see that prices have managed to remain in their sideways ranges:
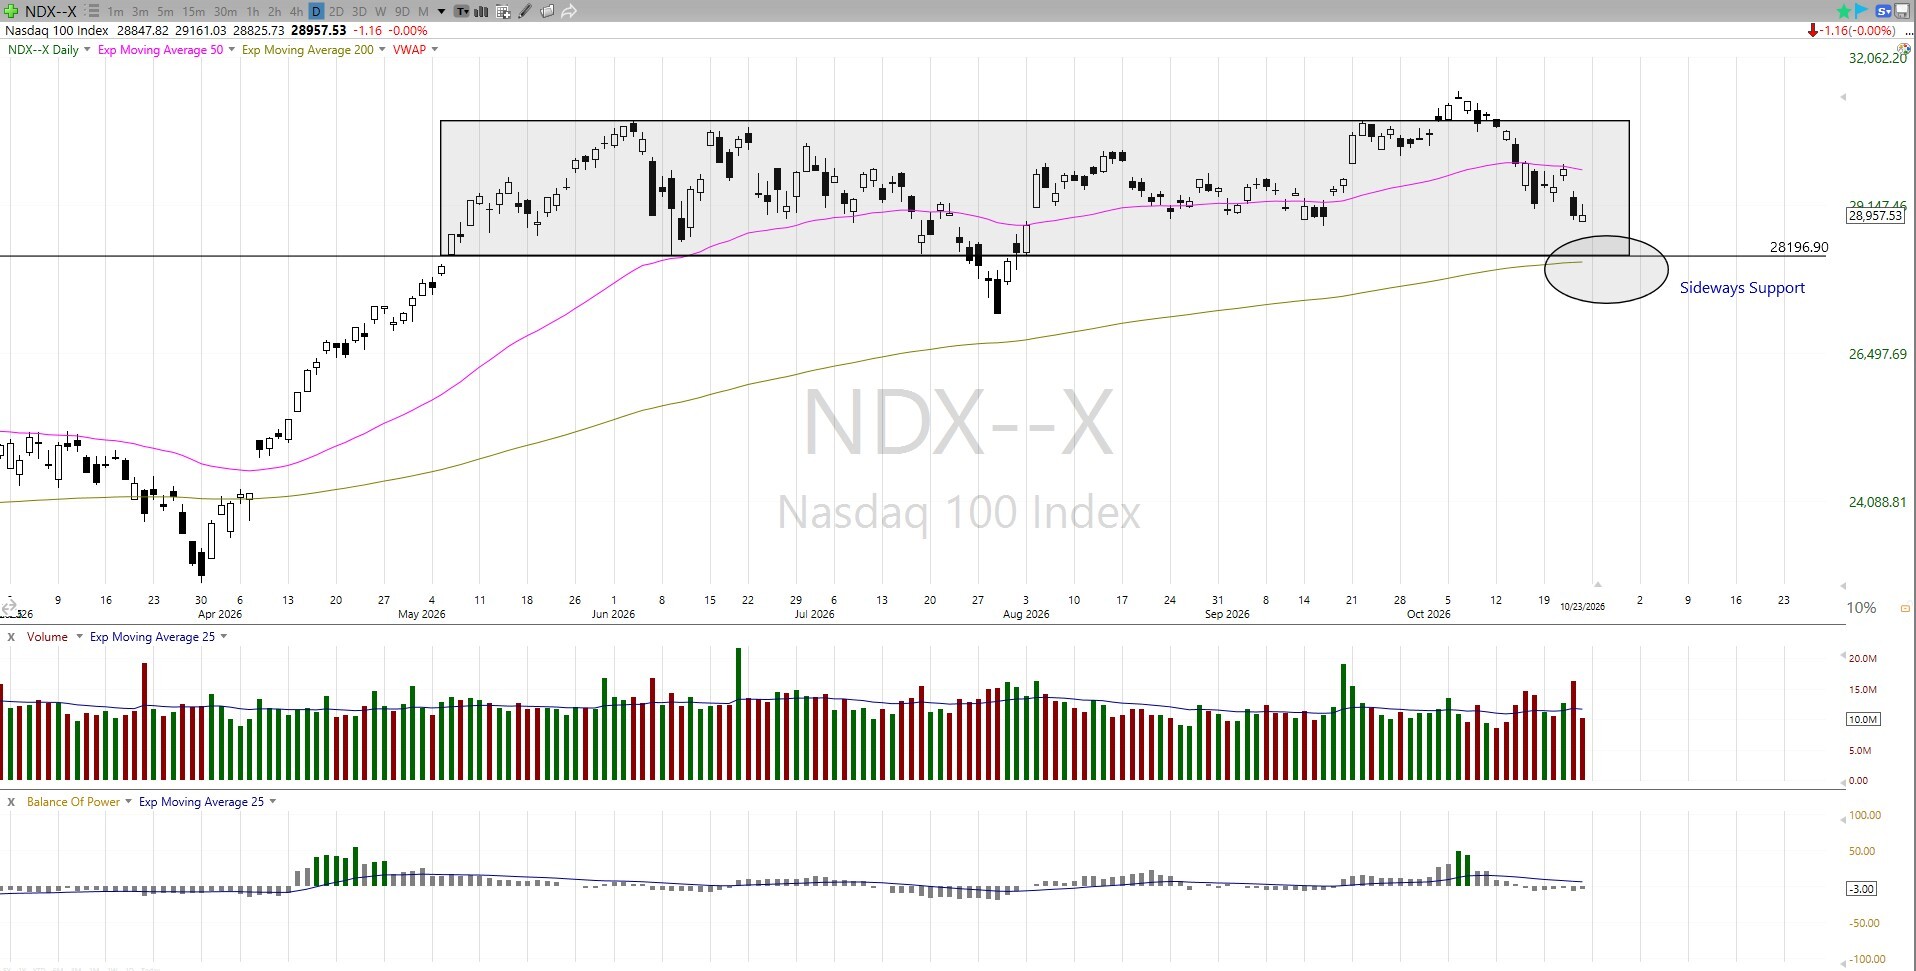
Note that NDX is below its 50-day moving average (pink) and is approaching its 200-day moving average (gold). Also note that the 200-day moving average is attempting to line up with NDX’s sideways support at 28,197. That level may act as a magnet attracting price. We need to study the wave counts to determine if that is likely or not.
Meanwhile, SPX is similarly postured and probing the highs of its summer range:
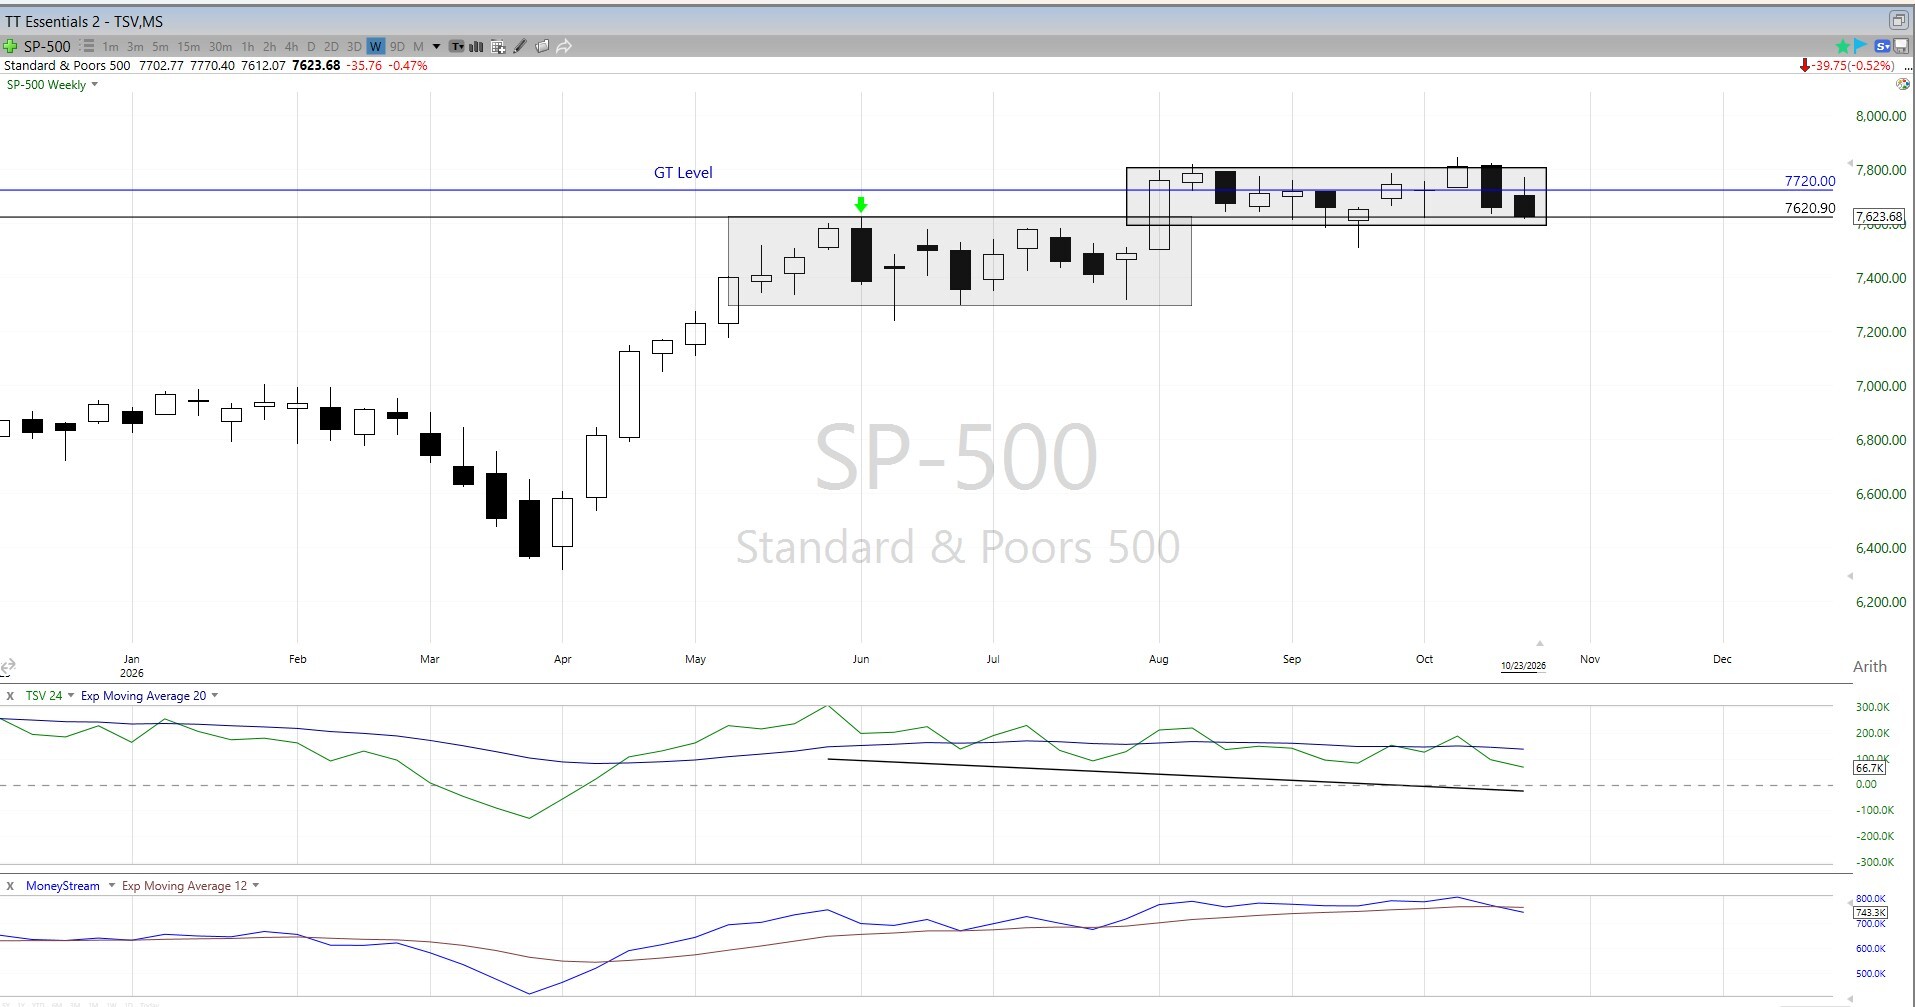
SPX is testing the 7620 level (the June high) from above. Will it find support there? (more on that below). One of the first things I notice is that the technical indicators are weakening.
Notably we are below the Gamma Threshold level and as such elevated volatility (both upside and downside), due to options dealer hedging activity, should be expected in the near term. SPX has been bouncing around the GT level for all of 2026 and we have yet stray too far from it. I am suspicious of whether this short gamma regime lasts. Importantly, liquidity was sufficient this week. Market makers seem more sanguine than options dealers at this time. (Learn more about the GT level here: https://www.elliottwavetrader.net/gamma-optimizer/Understanding-the-GT-level-202012076573537.html.)
Volatility
The VIX index closed at 19.45, little changed from last week and well above the 14.5 – 17 range it was happy with for much of 2026. Last week, the front end of the VIX futures term structure rose dramatically and inverted while the back end of the curve remained unchanged. When options dealers get nervous over a possible impending liquidity event, but have no idea when it may happen, they raise prices across the whole curve.
Sure enough, a quick check of the VolChart.io tool shows that this week the back end of the VIX futures term structure was rerated upwards, and we can conclude that options dealers are not sanguine about the future:
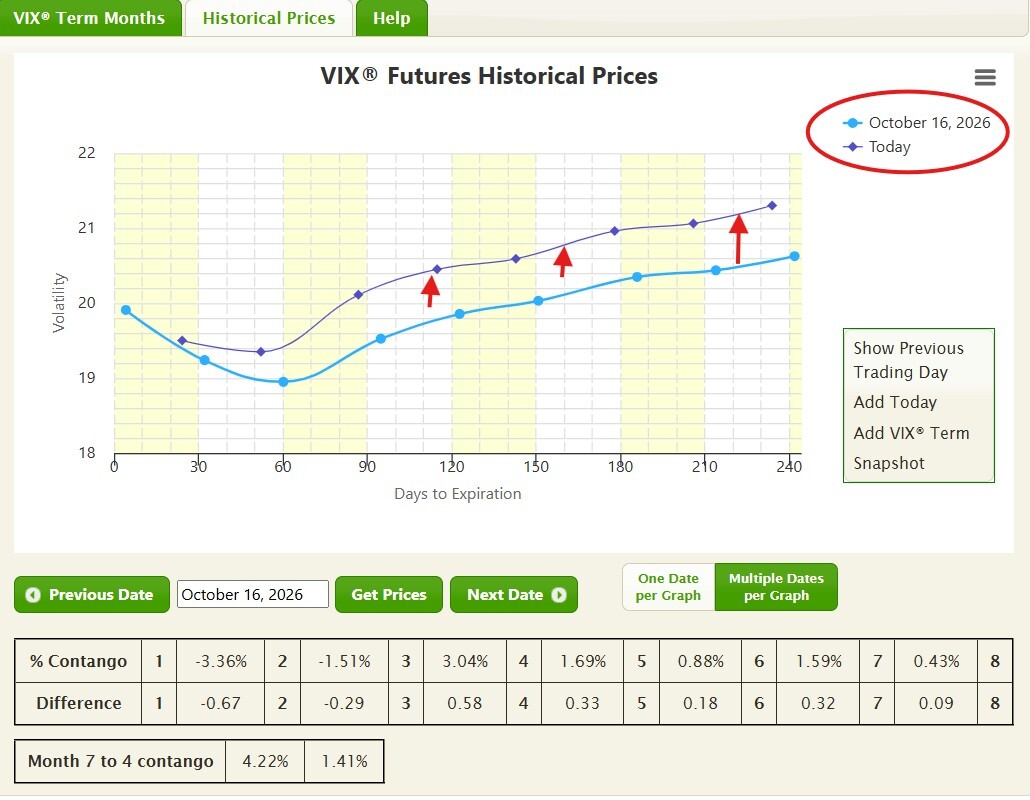
This chart depicts a volatility space that is flashing a yellow warning sign, not red because the curve is still generally in contango. My take-away from this first cursory pass over the major equity index charts is that prices are descending into a support region. At the same time, the technical indicators are weakening, so a bounce off of that support is not at all guaranteed.
So where are we in the count?
When I need to catch myself up on the wave counts, the first place I go to is to the latest “Market Update” post(s) in the Flagship service (A Weekend Report post is even better, and should always be read in order to understand where we are in the larger context). First, select “Avi & Mike’s Market Alerts” from the Bulletin Board, and then select Market Update and/or Weekend Reports.
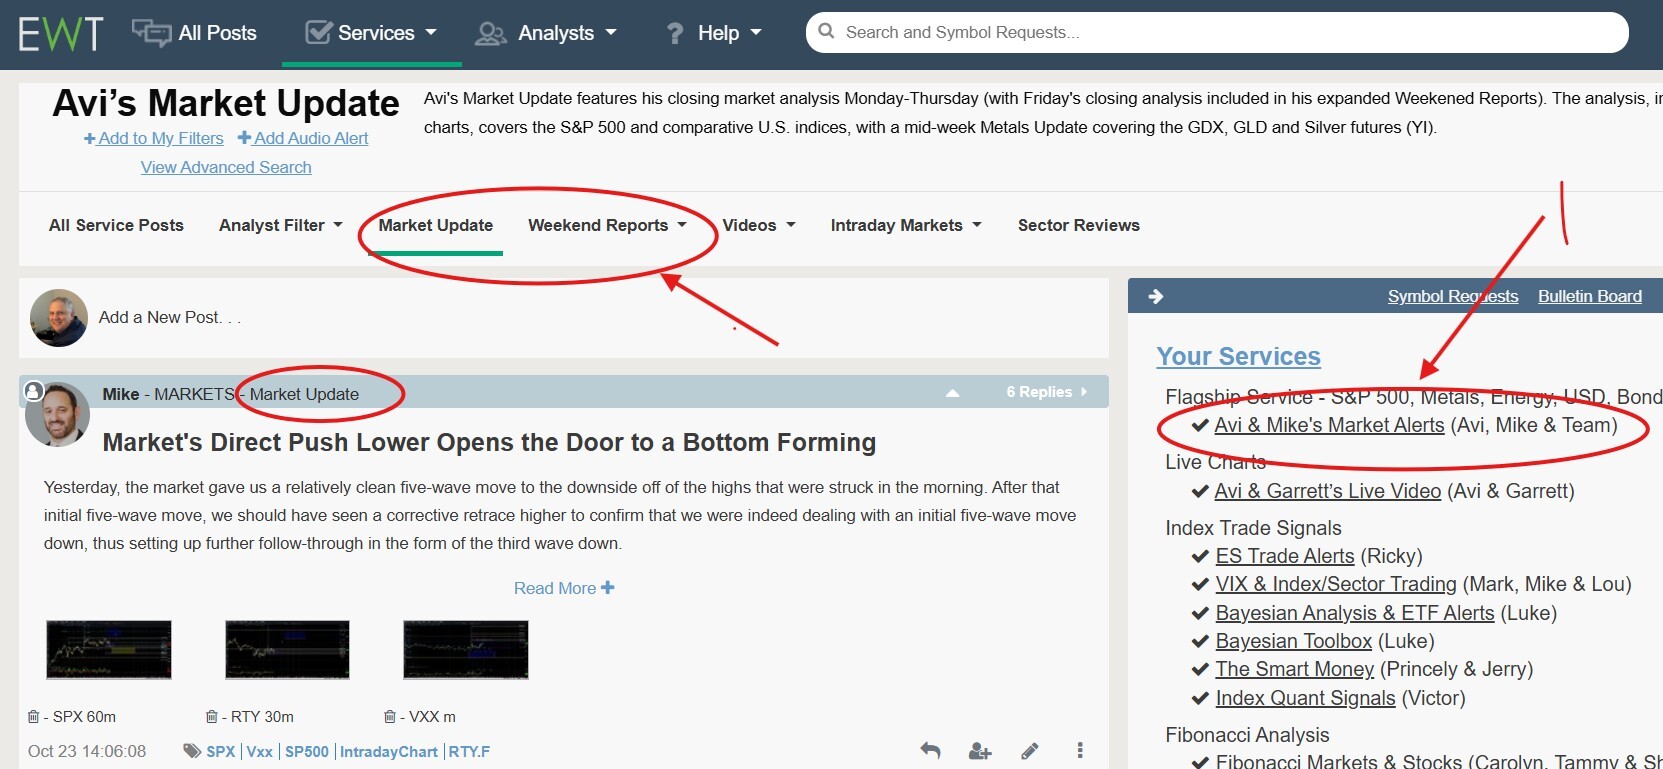
As you can see, the latest Market Update was posted on Friday afternoon, here: https://www.elliottwavetrader.net/trading-room/post-type/initial/section/25/section/235/header/AviMarketUpdate/links/1. It is an excellent update, and includes supporting analysis from the Russell 2000 and VXX. The title of the update is “Market’s Direct Push Lower Opens the Door to a Bottom Forming.” This was a bit of a surprise to me (as just one day prior, we were looking for a larger sell-off) but comports with what we already determined. It should be noted that “surprise” is just one of many emotions which must be kept in check while trading. Instead, we continue reading.
Mike wrote, “Overnight and today, we saw the market continue to grind lower after seeing a very shallow retracement, which, rather than confirming the initial five-wave move [down], made that initial move much more ambiguous. Furthermore, the entire move down off of yesterday's high is now approaching the ideal target region for a standard ABC move off of the 10/6 high.” This is helpful, as it explains why Mike may be expecting a bounce from these levels. I am no longer “surprised”; knowledge trumps emotions.
Mike continued, “With the inability to give us a clean structure to work with, I am becoming much more cautious about seeing the market make a more sustained and direct break lower, and this structure now looks to be setting up at least a local bottoming pattern before seeing any sort of direct break lower.” But recall that our equity charts, above, do allow for more price weakness before hitting a stronger support level.
Mike addresses this, too, saying, “Furthermore, while I think it is less probable at this point in time, we have not fully invalidated the blue count. It would still look better for this to make another lower low, even if we are forming a local bottom, but the failure to see a corrective retrace after what was a decent five down, and now the failure to see strong follow-through lower, has me looking more and more at the potential for this to be forming at least a local bottom and potentially a larger bottom in that blue wave b, rather than seeing a direct push lower in the larger wave c.”
Everything seems to be lining up. Here is the chart (Note that I typically would not hold hands through one of Mike or Avi’s update in detail, but since I am reviewing my own process I will be putting a lot of Flagship service analysis in this report):
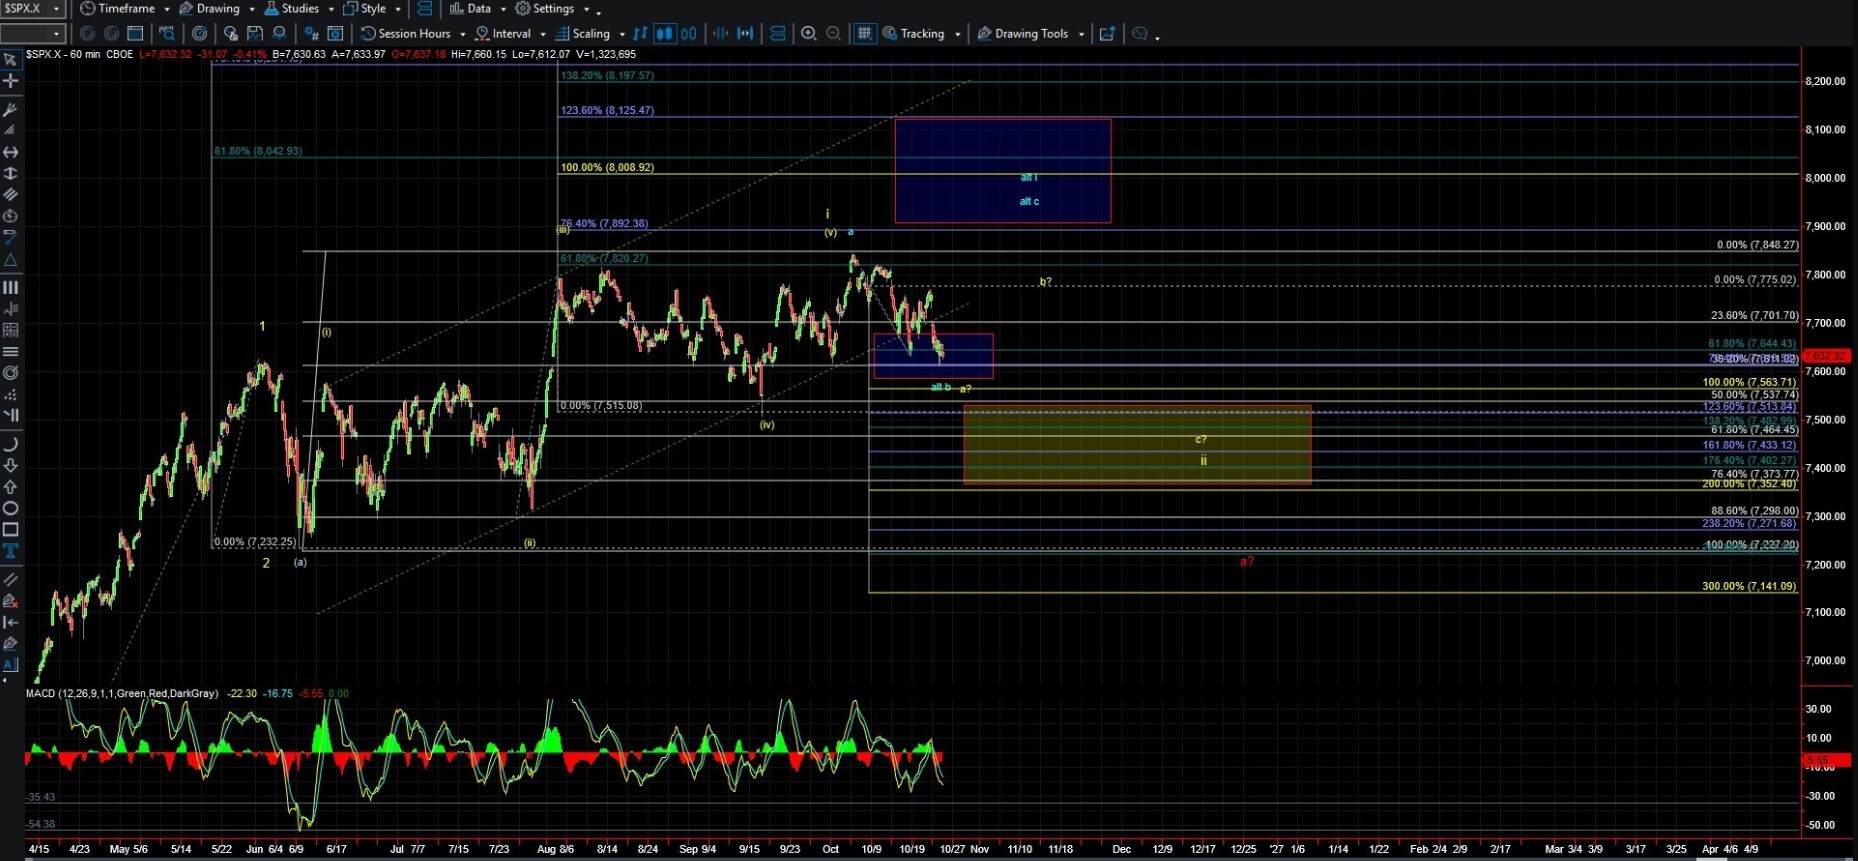
There is a little room for lower in the blue and yellow counts but we are in a support region. A bounce can happen at any time and that is what we must be ready for next week. Mike’s analysis was bolstered by a bullish setup on IWM and a setup for a lower low in place on VXX.
Levi’s Analysis
Levi is very reliable in that he is quick to supply us with a context-providing update whenever price action on the major equity indexes causes confusion or otherwise alters the count. This is especially true on weekends. I also want to take a moment to say that while staying abreast of Levi’s wave counts is a core part of my own trading system, Avi pays very close attention to Levi’s counts as well.
On Friday evening, Levi shared his latest SPX analysis with the Flagship service, here: https://www.elliottwavetrader.net/trading-room/post/10413095. His analysis first notes the same thing Mike did. Namely, that the spot from which SPX declined late in the week was not ideal for bullish continuation; we reversed strongly from a resistance level.
Levi then states, “Again, the market has provided us the potential for a low of sorts. I do find it interesting that this could be a backtest of sorts into the prior high area of 7620. Clearly, that level was initially violated with the drop into the mid-September low at 7507. But today’s low at 7612 may mark a pivot in price.” So, Levi is also looking for a possible bounce from this level and he, too, noted that we are probing the highs from this summer.
Next, Levi challenged himself and asked what price would need to do in order to validate the thesis of a local bottom in place. The answer is that Levi would need to see a “clear five waves up from here.” Now we know what to expect and what to look for. If we do get a clear five waves up from this region followed by a corrective pullback, I would not fight upside price action.
Levi fully admits that he is approaching the market through “a bullish lens.” Here is his accompanying chart:
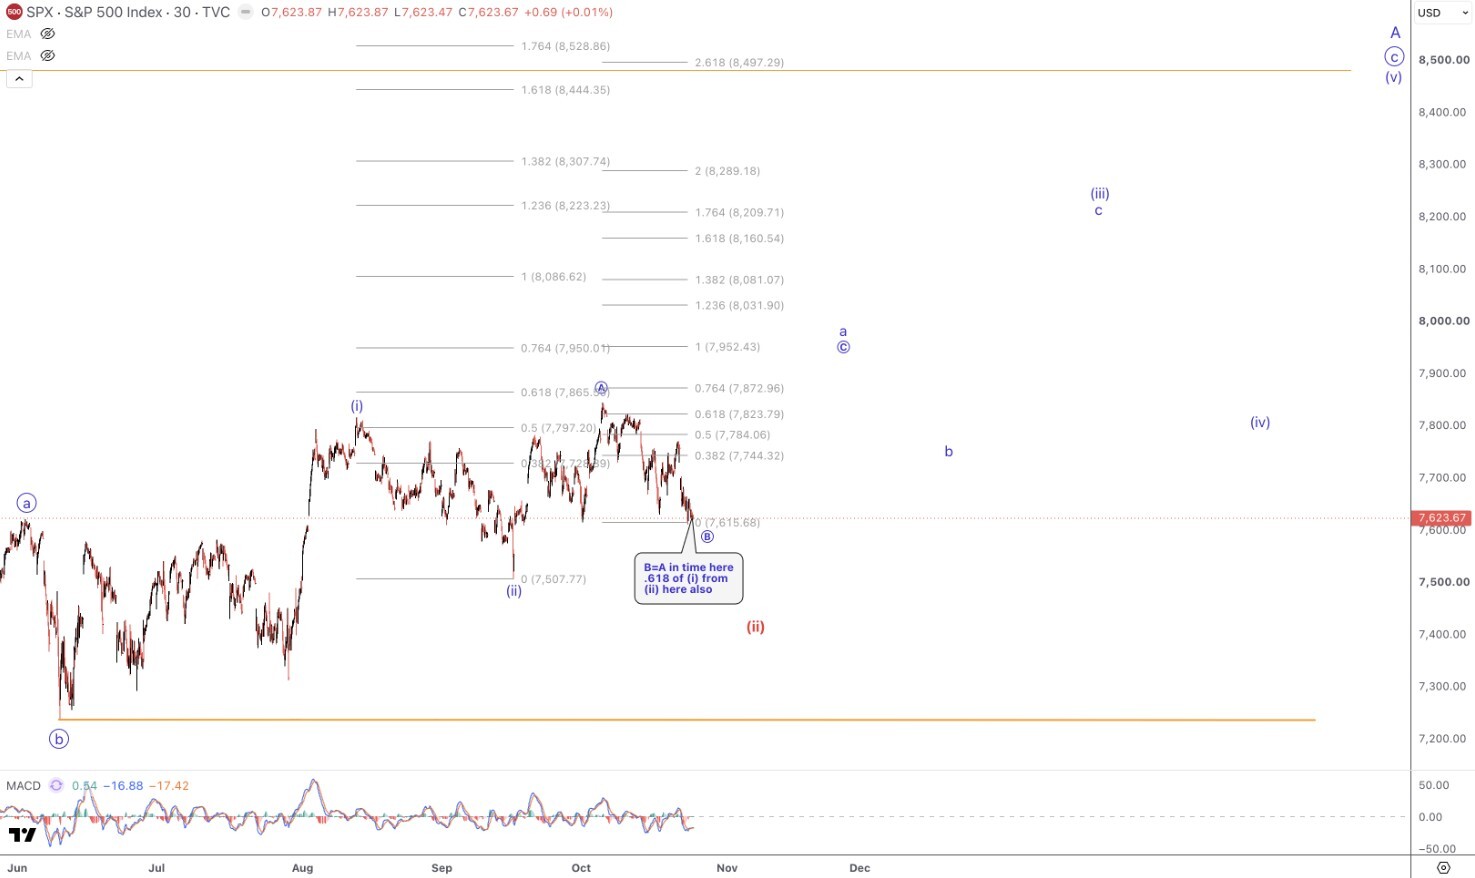
Finally, we have to ask ourselves what we need to know if the bullish/bounce thesis is wrong. Levi addresses this, writing, “If the bears are viewing this through their telescope and prove correct, then down the rabbit hole we go. The move down would actually be a leading diagonal, and it would target the 7400–7500 region for a more protracted wave (ii). Again, the structure will clearly tell us which is which. Five up says bullish, with a stop at the prior low of 7612. A corrective move up sets the stage for lower first. Pretty straightforward.
A nominal lower low down to the 7600 area yet leaves the bulls with a shot at a five up and higher first. In the bigger picture, taking out the June low at 7237 would change the calculus to a greater pullback instead.” Those are the levels that should be drawn on our chart. 7237 should be a familiar level as we have discussed it before. Should that level break, then we will have a strong indication that a larger degree top has been struck. Unfortunately, 7237 SPX is quite far from current levels. (Edit: Levi has since informed me the that the structure of a major decline will project important support levels that we can use on the way to 7237, which is very helpful.)
Turning back to Mike’s Market Update, Mike also discusses the bearish path, stating, “If we were to see a direct and strong break of the 7563 level, that would suggest we are seeing a more direct and sustained break lower. However, as long as that level holds, I have to lean toward the market seeing at least a bounce higher before any strong and sustained break lower.” This places a finer point on the upper support level. We can now draw 7563 and 7233 on our SPX chart, and should have plans in place now for what to do if those levels break.
ICYMI – Metals and Miners
Next, I will go through the same process with the metals and miners charts. Fortunately, Jason did a lot of that work for us in a Flagship service post on Friday, here: https://www.elliottwavetrader.net/trading-room/post/10412941. In one sentence, Jason sums up my thoughts on positioning: “I'm layering only lightly until we have good evidence of a low in place and I have clear stops to trade against.”
ICYMI – Charts from Lead Analyst Zac Mannes
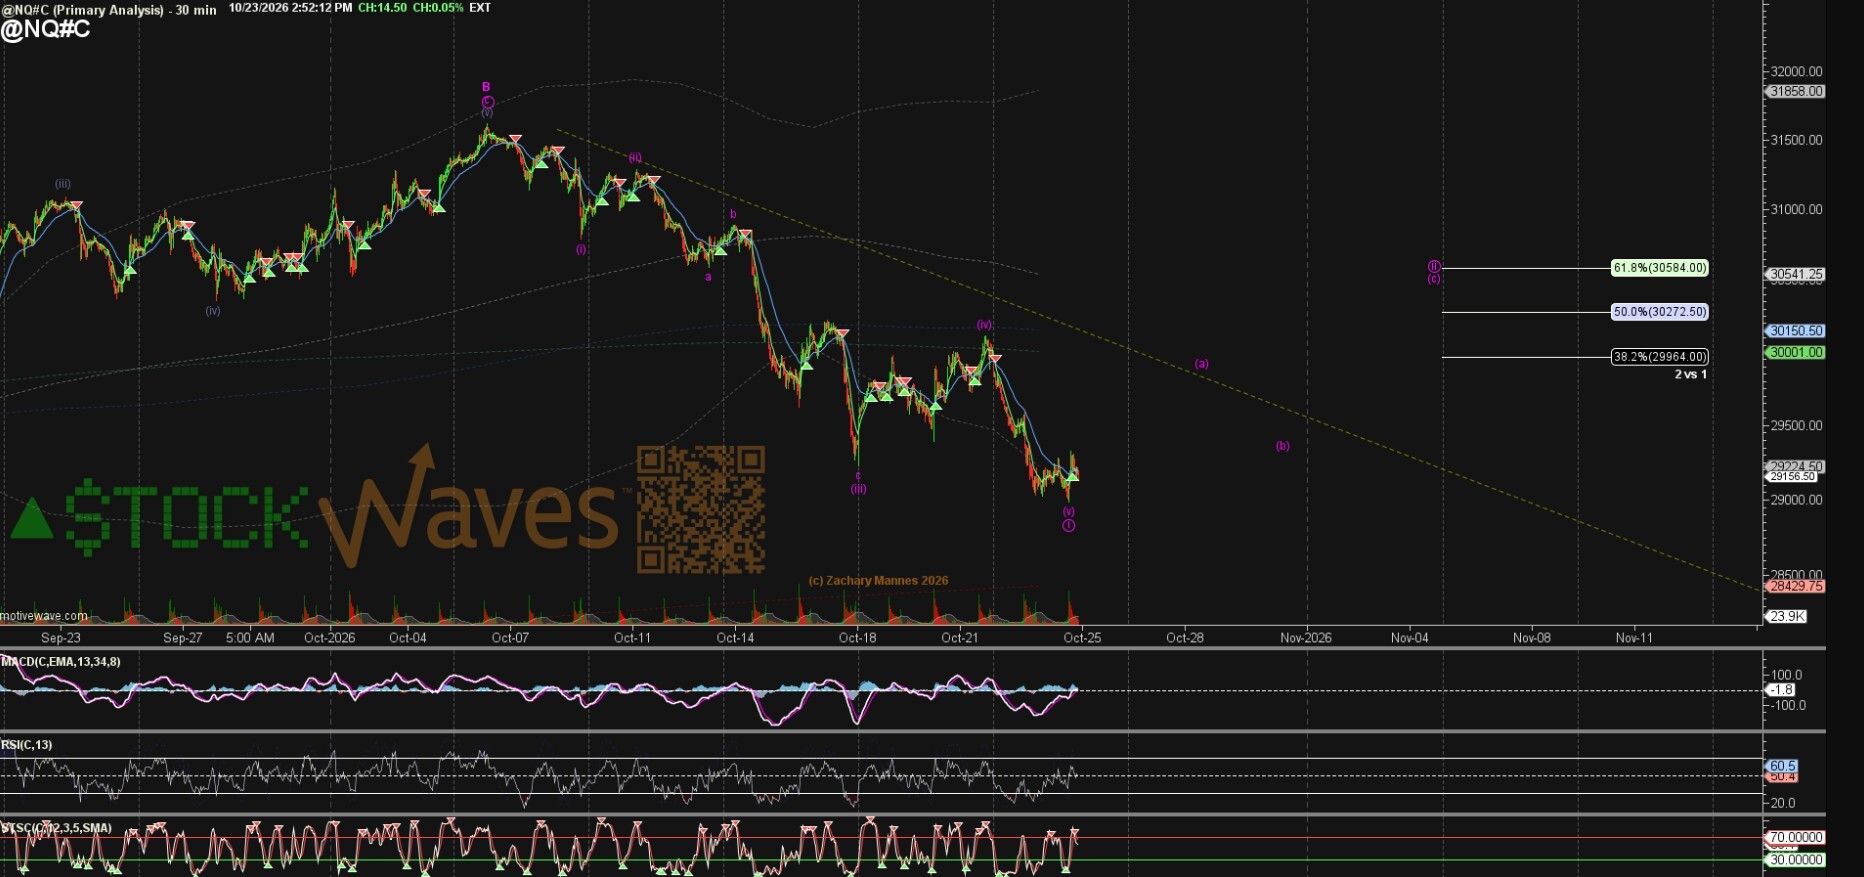
On Friday afternoon, Zac posted a bunch of charts to the Beginners Circle, here: https://www.elliottwavetrader.net/trading-room/post/10412867. Zac reviews RSP, NQ, Tech charts, and commodities. Note that Zac’s Nasdaq chart is also depicting a possible upcoming bounce:
Have a good weekend, everyone. This exercise has provided me with clarity regarding what to expect from the major equity indexes next week. Avi’s Weekend Analysis update tonight (usually posted on Saturday evenings) will provide further insight. Next week I will be revising TLT/bonds. Meanwhile, there is no dearth of catalysts mid-week next week so I will leave you with this blurb from Jason:

