
In Case You Missed It: Bi-Weekly Sector Review (Video) & More!
 By
Lou Alfieri
In Case You Missed It…
Before we review the week, MarkZ’s Bi-Weekly Sector Review is being replaced this week with a Webinar and Report available to all. Mark posted this Friday to the VIX & Index/Sector Trading Room, here: https://www.elliottwavetrader.net/videos/Sector-Review-October-30th-2026103025869.html. The video approaches sectors from the standpoint of “looking for a high probability trade” but includes a brief macro overview at the outset.
We had an eventful week, as expected. Volume for the week was decidedly above average and Friday’s volume on SPX and NDX was especially high, even for end-of-month ETF rebalancing. There were some signs of a possible forced selling on Friday; if so, we will learn more details early next week.
SPX lost only 43 points on the week. The Dow 30 was also down slightly, and IWM closed the week up over 1%. Meanwhile, NDX sold all the way down to its sideways support, where the 200-day moving average also resides:
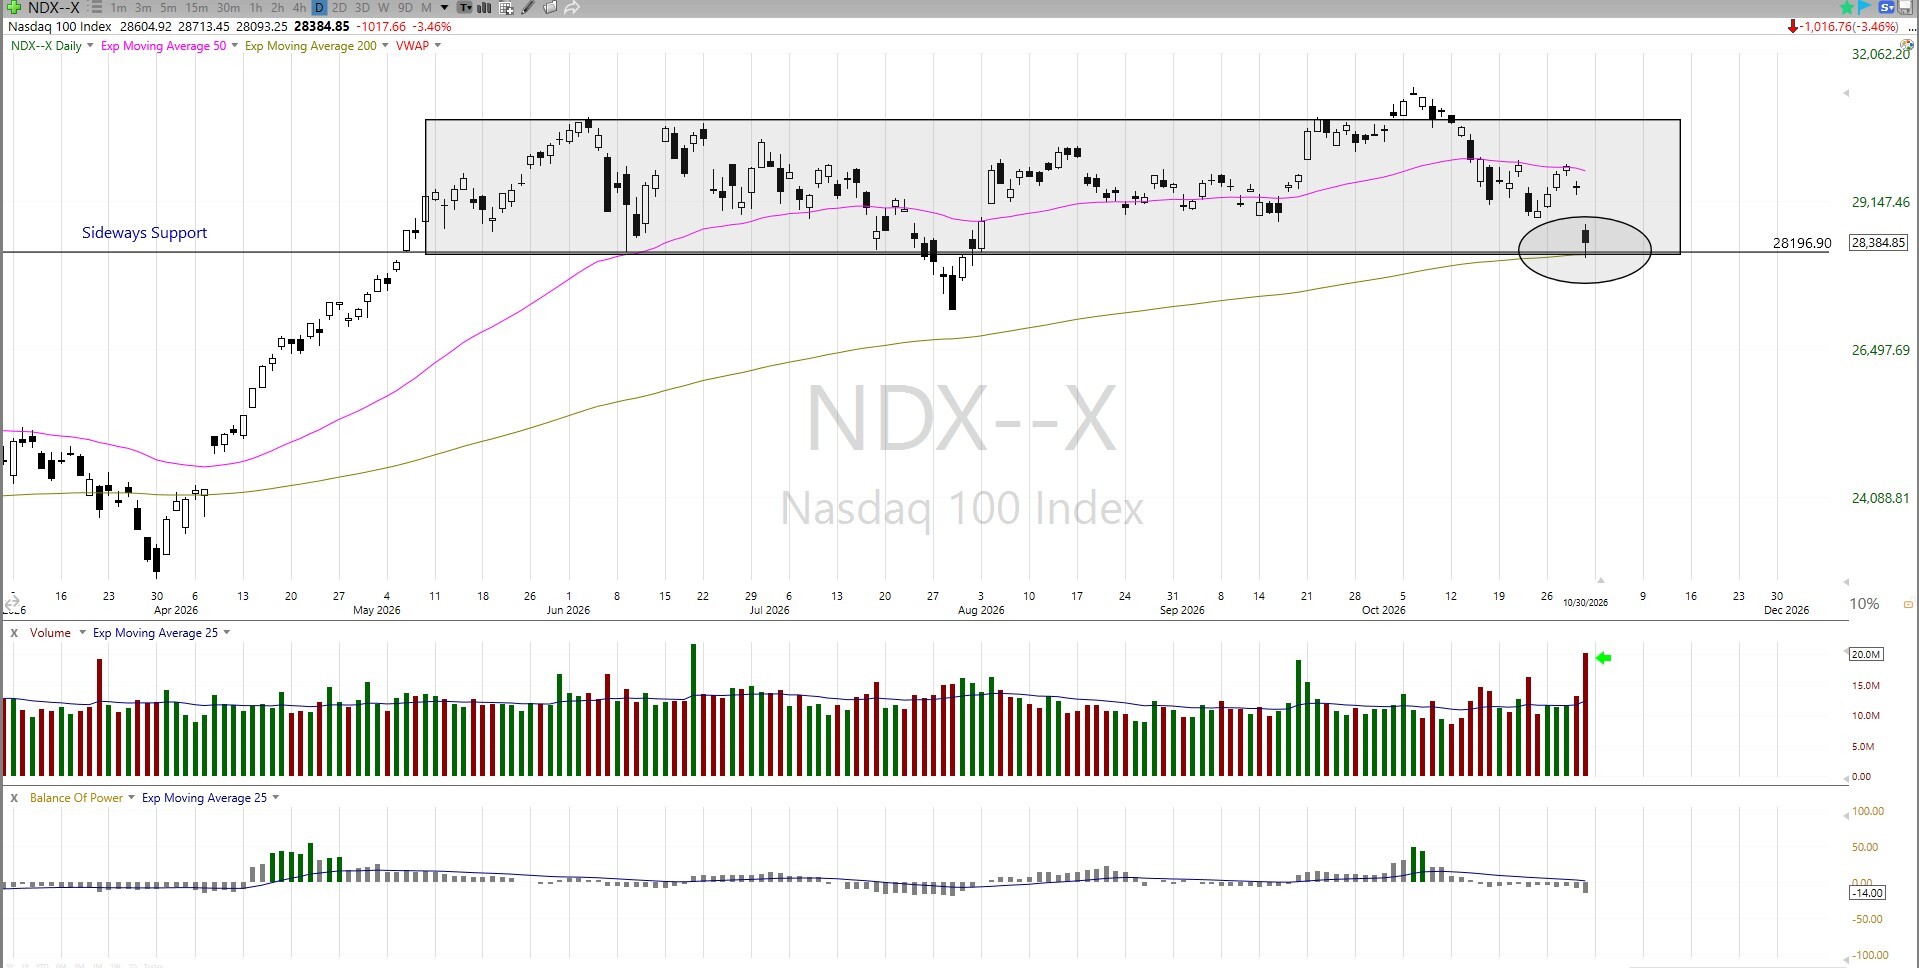
Last week, we drew a circle where the sideways support and 200-day moving average were likely to converge and said, “[t]hat level may act as a magnet attracting price.” That level held as support on Friday. And the Elliottitians are expecting at least a bounce in equities from here, but importantly, their charts do allow for slightly lower first.
We need to check the wave counts, but first here is a weekly chart of SPX:
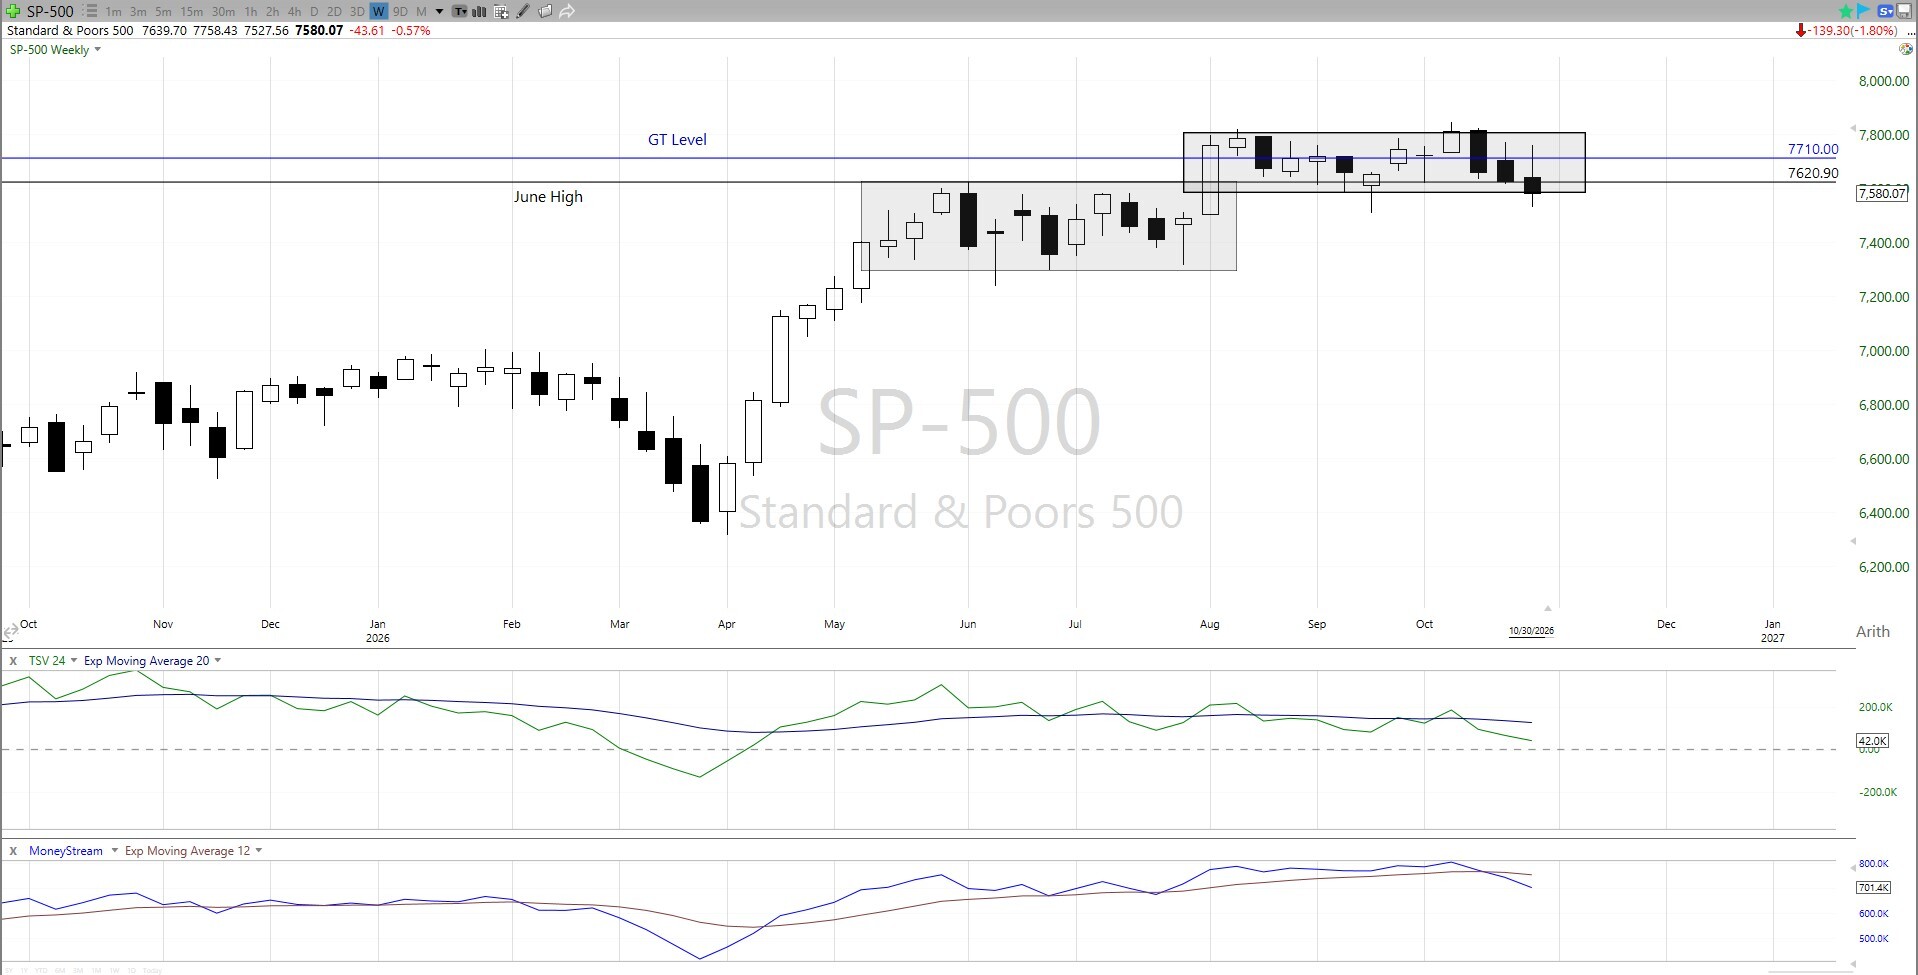
Price managed to stay inside its upper, more recent sideways range, but did close below the summer highs. Technical indicators continue to weaken.
This is the second week in a row that we closed short gamma. When short gamma, options dealer hedging activity exaggerates moves in both directions. As such, increased volatility should be expected in the near term. Importantly, liquidity has been sufficient for the trading volumes we have been seeing. The selling on Friday was controlled. (Learn more about the GT level here: https://www.elliottwavetrader.net/gamma-optimizer/Understanding-the-GT-level-202012076573537.html.)
Volatility
After a wild session on Friday, the VIX index closed at 19.40, essentially unchanged from the last two weeks.
The VIX futures term structure is also little changed from last week, although it does depict a slight inversion at the very front end of the curve. (Options dealers seem to be worried about a volatility event in the very near term.)
So where are we in the count?
Avi posted his Weekend Equities Analysis on Friday this week to the Flagship service, here: https://www.elliottwavetrader.net/trading-room/post/10420984. “REGION OF RISK” is a phrase we are all going to become more familiar with next week. Here is Avi’s 60min SPX chart:
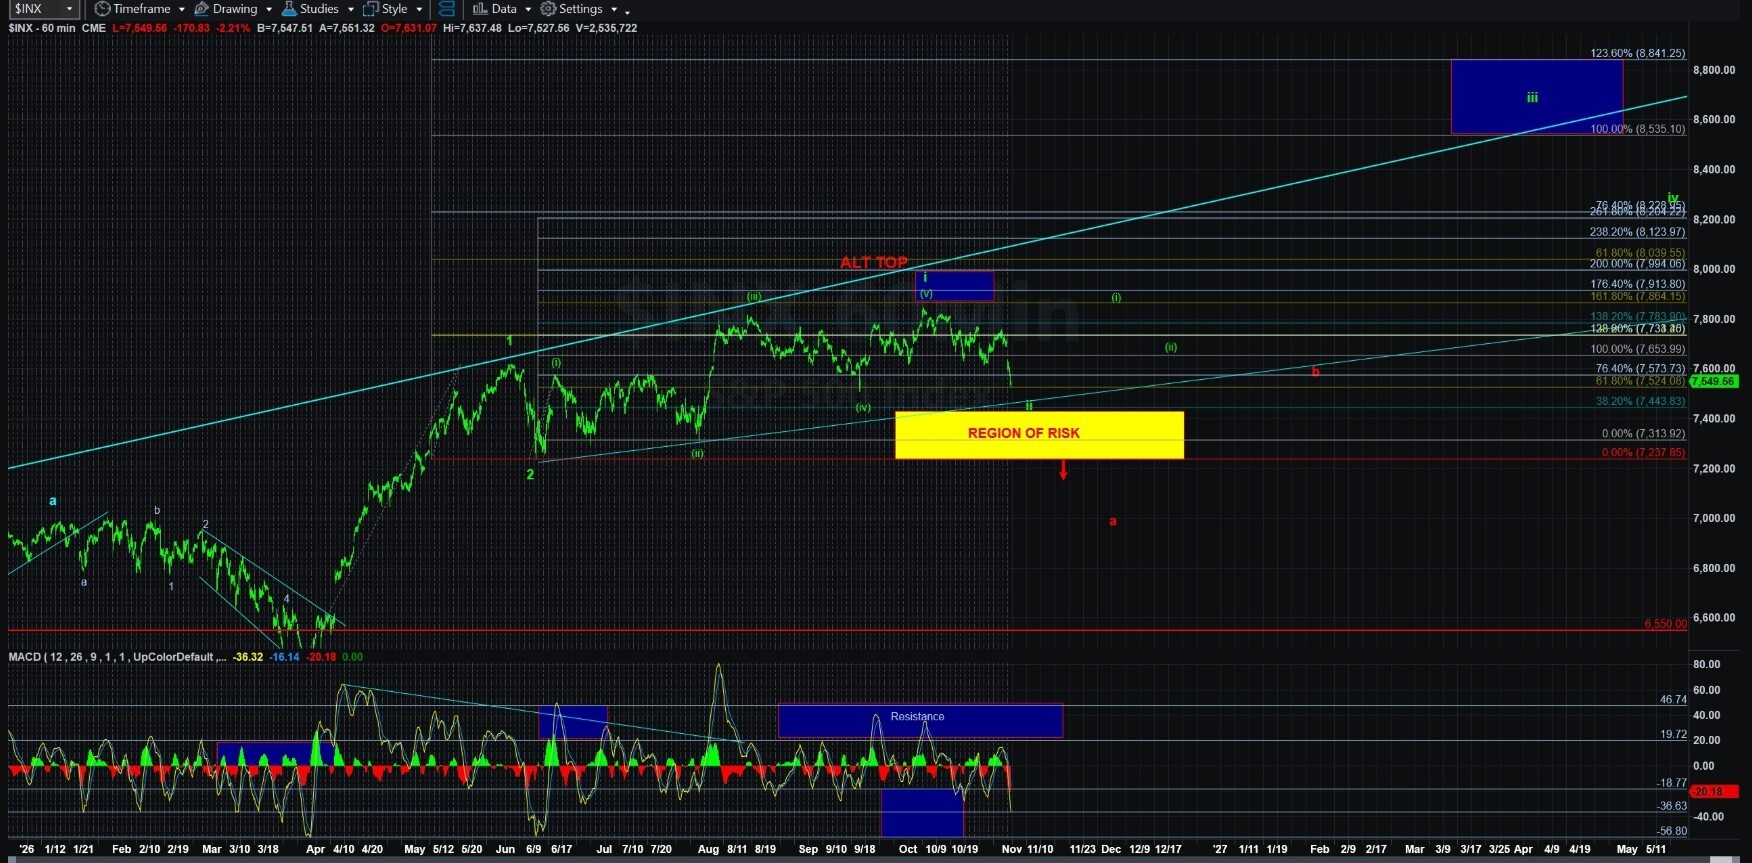
The low of the Risk Region comes in at 7237 SPX, a level we have been discussing for weeks that is now not very far from our green wave ii target area. (Note the MACD in the chart above).
Avi’s Weekend Analysis makes three major points:
- The bullish count to much higher targets in 2027 remains on the table, though slightly complicated in the very near term by the fact that the ES and SPX charts are ever so slightly out of sync,
- Avi then discusses a few potential ways to trade that potential rally, including exploring better opportunities in individual stocks via Stock Waves, and
- It is time to start thinking more about risk management vis-à-vis the red count.
If, like me, you want to trade a potential bottom in this region, then Avi lays out several ways to do this and I refer you back to Avi Weekend Analysis post. If you are concerned for the fate of any long portfolios you may have, Avi provides some important levels to monitor:
“For now, I am seeking a bottoming of sorts either today or maybe early next week, as long as the market holds the 7439-7469SPX support zone, and the bottom of the current box. In fact, the ideal target for wave 3 in green would be the 1.618 extension of waves 1-2 which is the 7500SPX region. But, of course, this can easily extend to the 1.764-2.00 extensions which is why I cited the 7439-7469SPX zone as ideal support for us right now.”
And
“The other point you MUST always take into account is that there is still potential that the market has indeed topped in the long-term structure. And, a break of the 7237SPX level would be a first indication of that potential. For now, we are quite a ways away from that and I cannot say that I would consider this structure as strongly suggesting we will break that on this particular decline. We would need some sizeable further downside extensions early in the coming week to place that potential on our plate.”
As such, we all should be monitoring 7237 SPX, 7439-7469 SPX, and the 7500 SPX region.
The Metals and Miners Trade
The entire metals complex saw a sell-off this week. Luckily, Avi’s Weekend Metals Update is also complete, posted to the Flagship service Friday afternoon, here: https://www.elliottwavetrader.net/trading-room/post/10420863. The post is entitled, “GDX Will Soon Distinguish Between Yellow and Green.” Here is the GDX Chart:
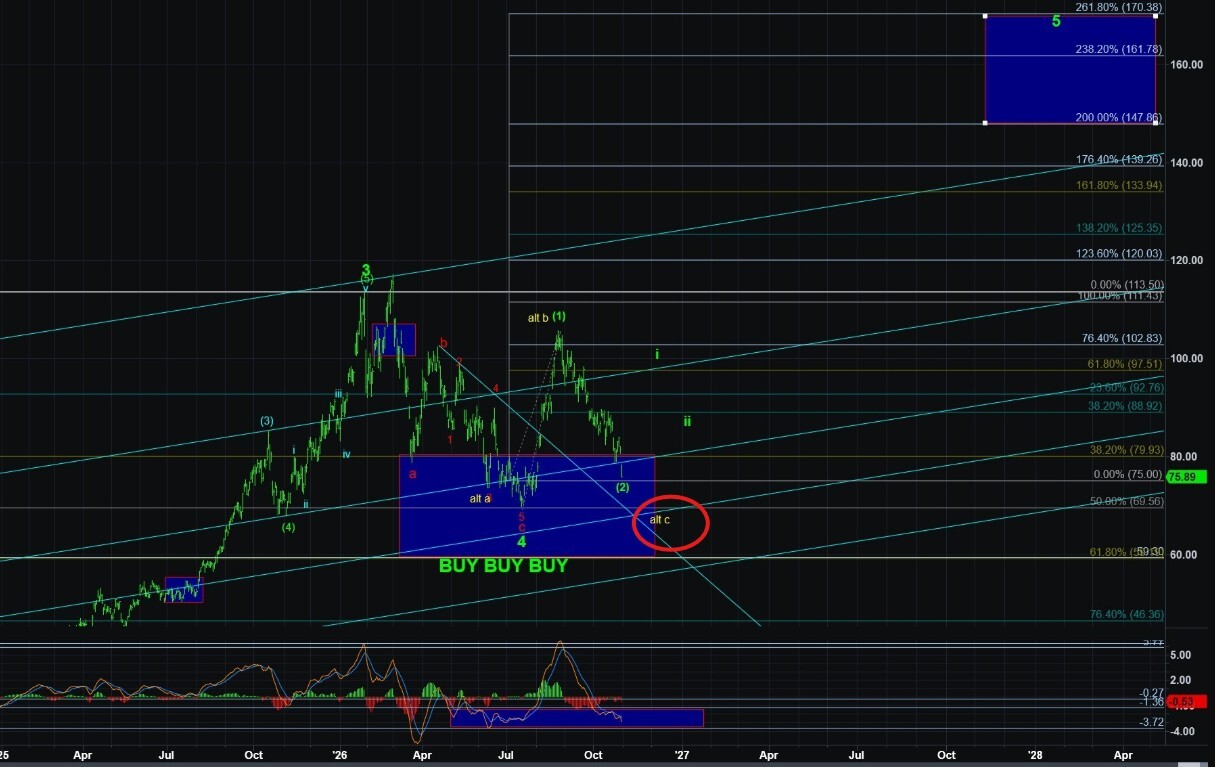
As you can see, the alternate ‘c’ wave is a good distance lower than current price. I have a ½-size GDX position and I am comfortable holding it all the way down to the bottom of the blue BUY box. However, as Avi mentioned in his weekend equities update, risk tolerance is a very individualized metric. If you need help determining your risk tolerance or risk profile, please ask in the replies, or in the rooms.
Here is the 8-minute version of the GDX chart:
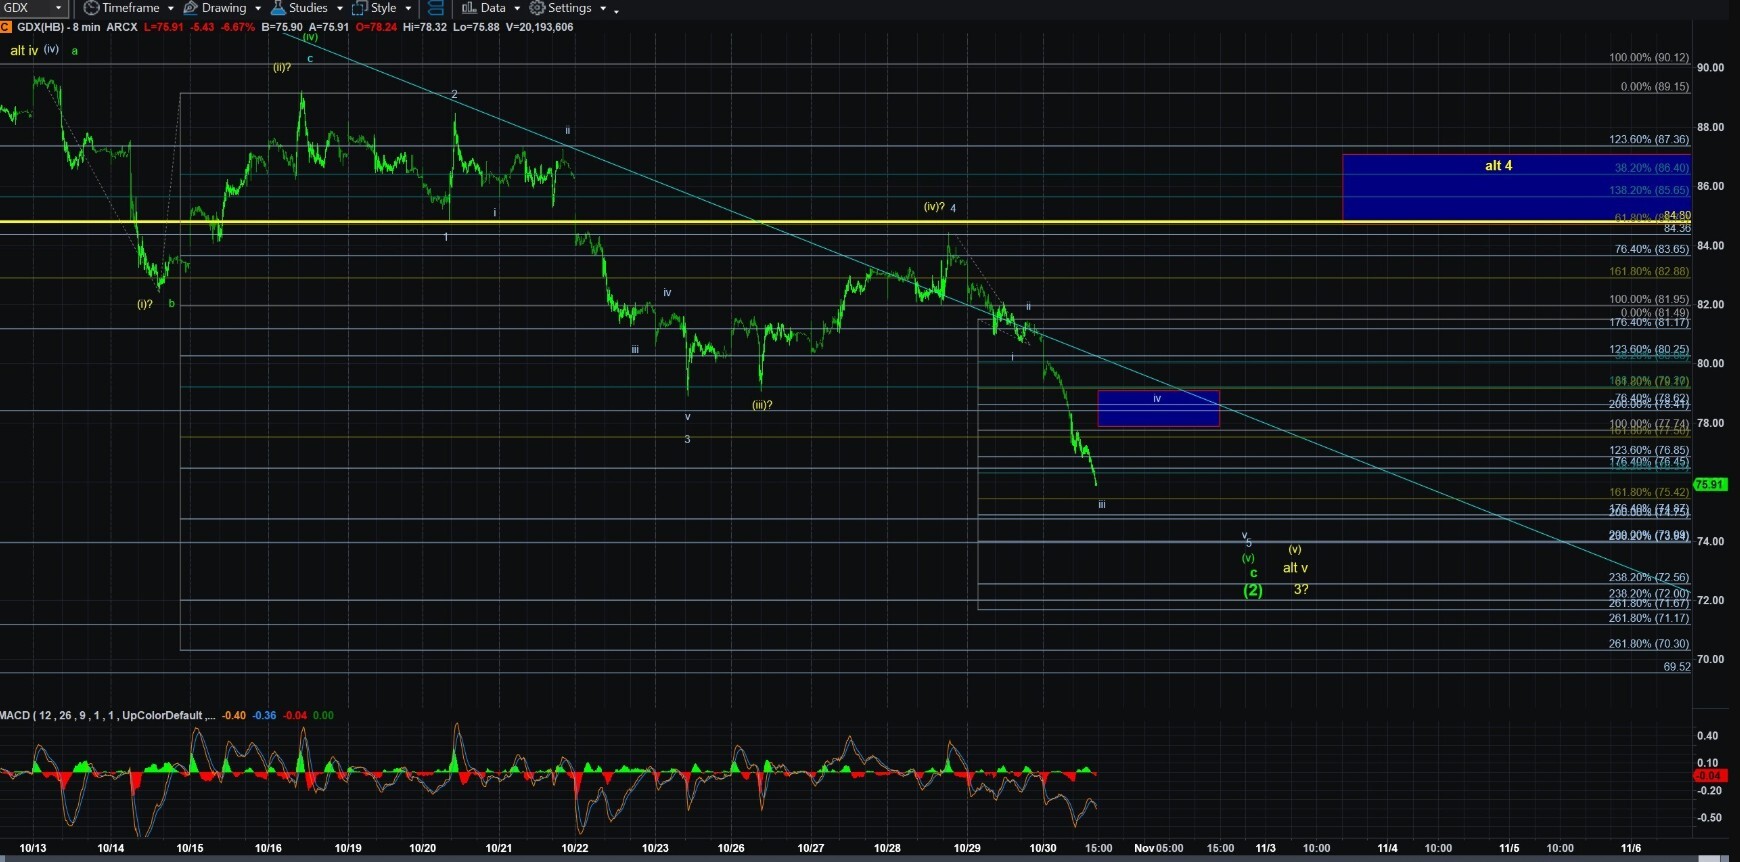
Note that even in the green count there may be another sub-waves iv-v before the wave (2) count is complete. Per Avi, “for now, I am retaining the wave (2) count in green on the charts. But, the deeper this drops beyond the 77 region, the more likely this becomes the wave 3 in the yellow c-wave count. Even within the micro count, it still looks like we will need a wave iv-v to complete this 5th wave, as long as we remain below the 80 region. But, I am trying to give this a little extra room for the green count.” Again, summarizing Avi is not an error-proof exercise and it is best to read his entire update at the link above.
I also have a few individual miners’ stocks and am often referencing the Metals, Miners, & Agriculture Service’s Wave Setup list.
Bonds
Bonds have made progress in their wave counts over the past couple weeks. Lead Analyst Zac Mannes posts regular bond updates to the Flagship service. His last update was posted on Friday, here: https://www.elliottwavetrader.net/trading-room/post/10419521.
Also on Friday in the Flagship service, Avi updated his TLT chart:
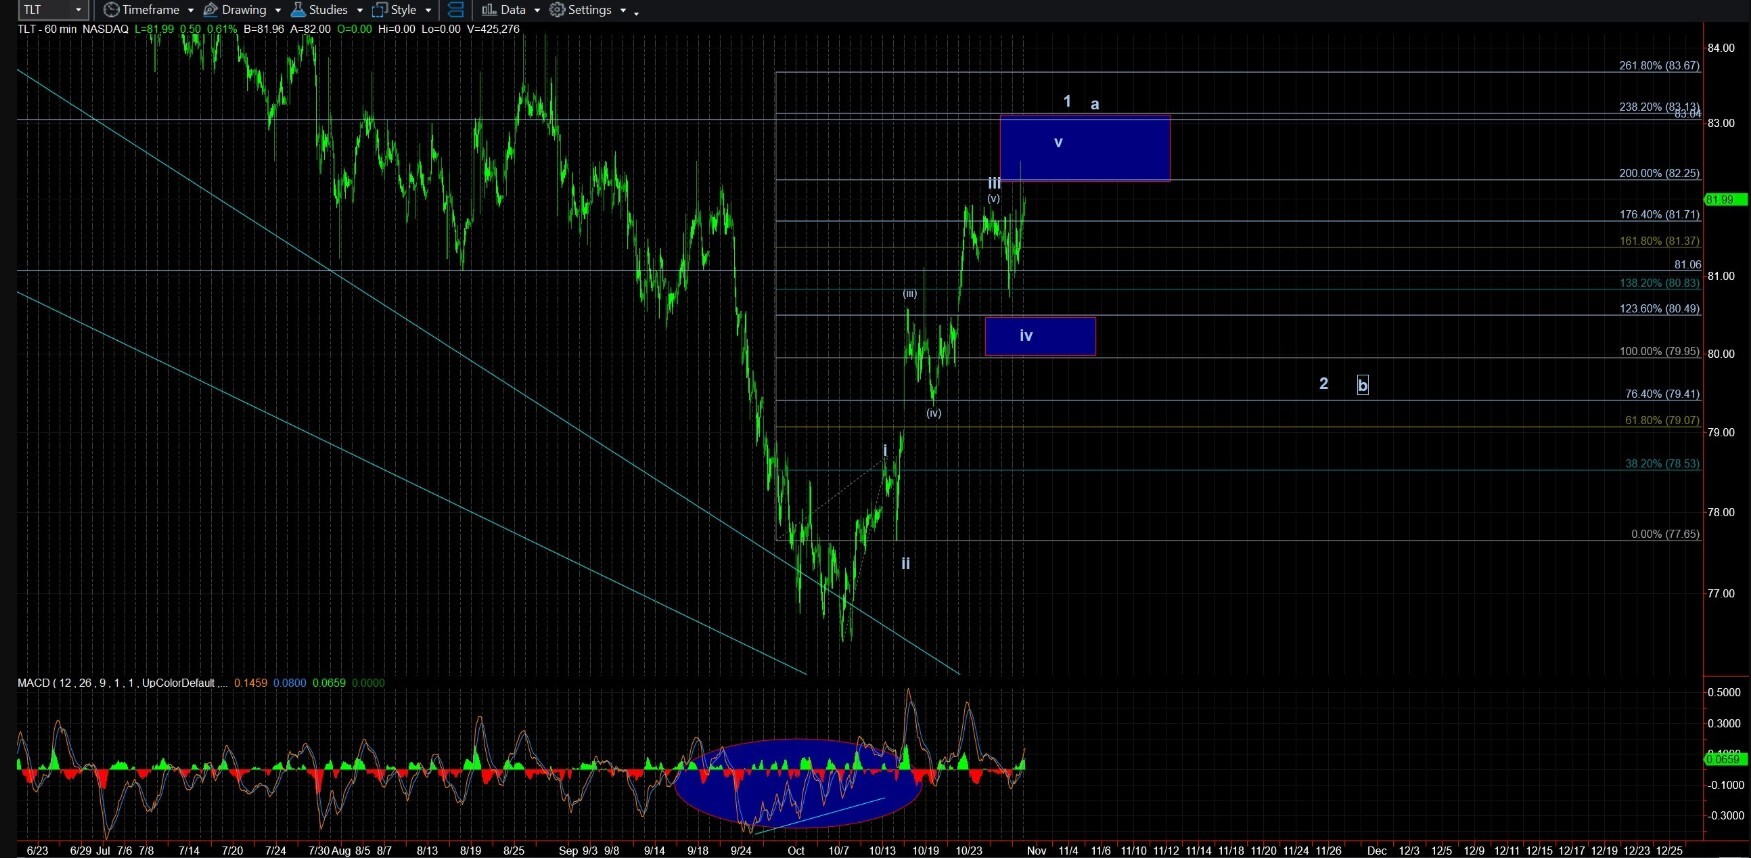
An impulsive wave 1 may be trying to complete. So, what we are looking for next is a corrective pullback for a wave 2. Should we get that, then with the proper setup we could have a long trade on TLT. Clearly, then, this needs more time, but it was worth checking.
ICYMI – Charts from Zac
As usual, on Friday afternoon, Zac posted a set of charts to the Beginners Circle, here: https://www.elliottwavetrader.net/trading-room/post/10421201. Zac also posted his Nasdaq chart on Friday, here: https://www.elliottwavetrader.net/trading-room/post/10420558.
Finally, it appears that Jason may be making some weekend posts to the Beginner’s Section. It is a good weekend for trading homework, but it is early to mid- next week that is likely to hold the answers we seek in equities and metals. Bonds may be a longer boil, although maybe not too long.
For now, equities and metals are both approaching immediate support. What we want to know is if that support holds and, if so, what the structure of the retracement off that support looks like. Have a restful weekend, it will be another busy week next week!
