
In Case You Missed It: 19 Charts That Are Key to The Current Market Condition, Plus More
 By
Lou Alfieri
By
Lou Alfieri
In Case You Missed It…
The major equity indexes are still out of sync with each other. This makes it harder to establish a broad trend. Trading volumes remain slightly below average. SPX lost approximately 117 points this week and for now indexes remain in their sideways ranges, though NDX came close to breaking below that range on Friday and failed.
Leo Valencia, our resident options expert and host of The Gamma Optimizer service, updated the Flagship Service on the Gamma Threshold level on Monday, here: https://www.elliottwavetrader.net/trading-room/post/10301568. The GT level currently sits at approximately 7525 SPX. SPX has been bouncing around the GT level for quite some time. In fact, SPX has not managed to get far from the GT level for most of 2026. Today, we finally flipped short gamma. This does not mean much unless we can sustain it into midweek. If we do remain short gamma, then the farther from the GT level that SPX falls, the more volatility we can expect in the short term, with downside price action favored. (Learn more about the GT level here: https://www.elliottwavetrader.net/gamma-optimizer/Understanding-the-GT-level-202012076573537.html.)
Broad Overview by Zac
Last week, the daily chart of SPX showed price in a sideways pattern for approximately 2 months. The following chart shows ES’s range-bound price action for July. When indexes look like this it makes sense to look for opportunities elsewhere.
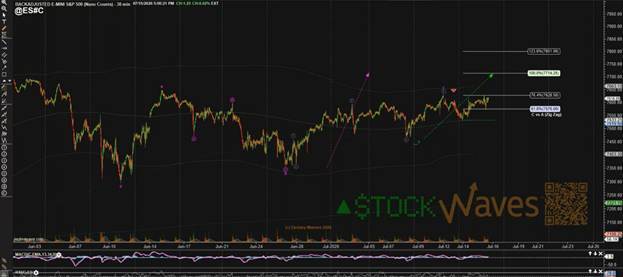
The above chart is from the recording of the Beginners Circle Weekly Webinar — a weekly series hosted live on Wednesdays at 5 p.m. ET by a rotating group of analysts, with recordings available under the "Beginners Webinar" option in the Help menu. This week's session was hosted by Lead Analyst Zac Mannes, who casts a wide net for trading opportunities in this week's session.
In general, the Beginners Circle Weekly Webinars presents the current context of the markets covered in our Flagship Service, along with the larger-degree macro view of the counts. They are a great way to get re-oriented with the short- and long-term wave counts. I use them myself because they are not just helpful to beginners. The recording can be found here: https://www.elliottwavetrader.net/videos/Beginners-Circle-Weekly-Webinar-2026071524943.html.
In this video, Zac reviews 19 charts that are key to the current market condition. Zac covers markets such as the equity indexes, metals, bonds, GBTC, single stocks, and select sectors including semiconductors. If you feel that you need better context in any of these areas, Zac does an excellent job breaking down the counts in detail. Of note are the ratio charts that Zac includes. I, personally, have always appreciated Zac’s ratio charts. They compare the relative sentiment controlling two separate markets and are great for spotting rotations early.
One takeaway is that tech stocks, via the XLK ETF, may be ready for a bounce. This video is well worth your time. Meanwhile, MarkZ sees the same potential. Mark’s biweekly Sector Review was posted last weekend, here: https://www.elliottwavetrader.net/trading-room/post/10300135. As you can see below, XLK is filling out Mark’s diagonal pattern quite nicely:
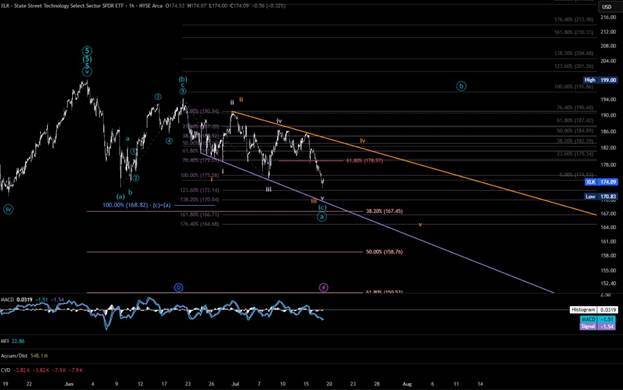
Again, MarkZ’s biweekly posts can provide trading opportunities when index trading becomes challenging. More comprehensive analysis of different sectors can be found in The VIX & Index/Sector Trading room and the Stock Waves service.
Bitcoin
With the sideways price action this week there is not much more to review. However, if you want the latest update on cryptocurrencies, then this Saturday is Ryan Wilday’s monthly Crypto Webinar available to the public. It is set to begin at 11:30 AM Eastern Time and here is an advanced link: https://attendee.gotowebinar.com/register/8958720044832744797. Ryan has recently gained additional insight into Bitcoin’s near- and intermediate- term wave counts and this month’s public video is a great way to get up to speed.
What is the membership most interested in?
A feature of our website that I am now using is the link to the most bookmarked posts. By clicking on your profile in the top right, you will see a link to your bookmarked posts. If you follow those links to your bookmarks, you will come to a page with links to the most bookmarked posts:

From there, you will come to a page listing the most bookmarked posts for that time period. If you ever wonder whether there was an important post that you may have missed, you can simply check the most bookmarked posts and see what everyone else thought was important.
Have a wonderful weekend everybody. As always, if you have any questions please ask.
