Higher Odds to Bullish Breakout Scenario
 By
By
As expected this past week, we did get weakness in the first half of the week, but bulls took control from there to close very near to the highs of the week.
Most of our models are now back on the bullish side. But bulls are hardly out of the woods right now and they need immediate follow through in the coming week. The Emini S&P 500 (ES) level of 2955/50 is support and below this 2930/25 is must hold support for the bulls. If the latter is taken out, odds shift very strongly toward the bearish side potentially indicating an ugly immediate breakdown below 2880 and then 2855. But until then, I am inclined to give the bullish breakout scenario higher odds this weekend. Above 2990/95 would indicate a breakout to all time highs and beyond. We will continue to use the NYHL1M main signal and micro signals to guide our trading this week.
ES Grey Zone areas: The grey zones on the ES 5 min chart below are what I draw in on a discretionary basis - they are supports and resistance areas which the market is most likely to react from. If we test a zone from below, it is likely to be rejected and fall lower to test support zones below. If we test a zone from above, it is likely to take support there and begin a move higher. So these zones can be used for intraday trading and/or as entry points for positioning for swing trades. These zones are drawn in based on what the market has done there previously both on smaller and larger timeframes.
Grey zone support now at 2960-54 and then 2935-2930. Resistance zones at 2986-94 and then higher we have 3021-27.
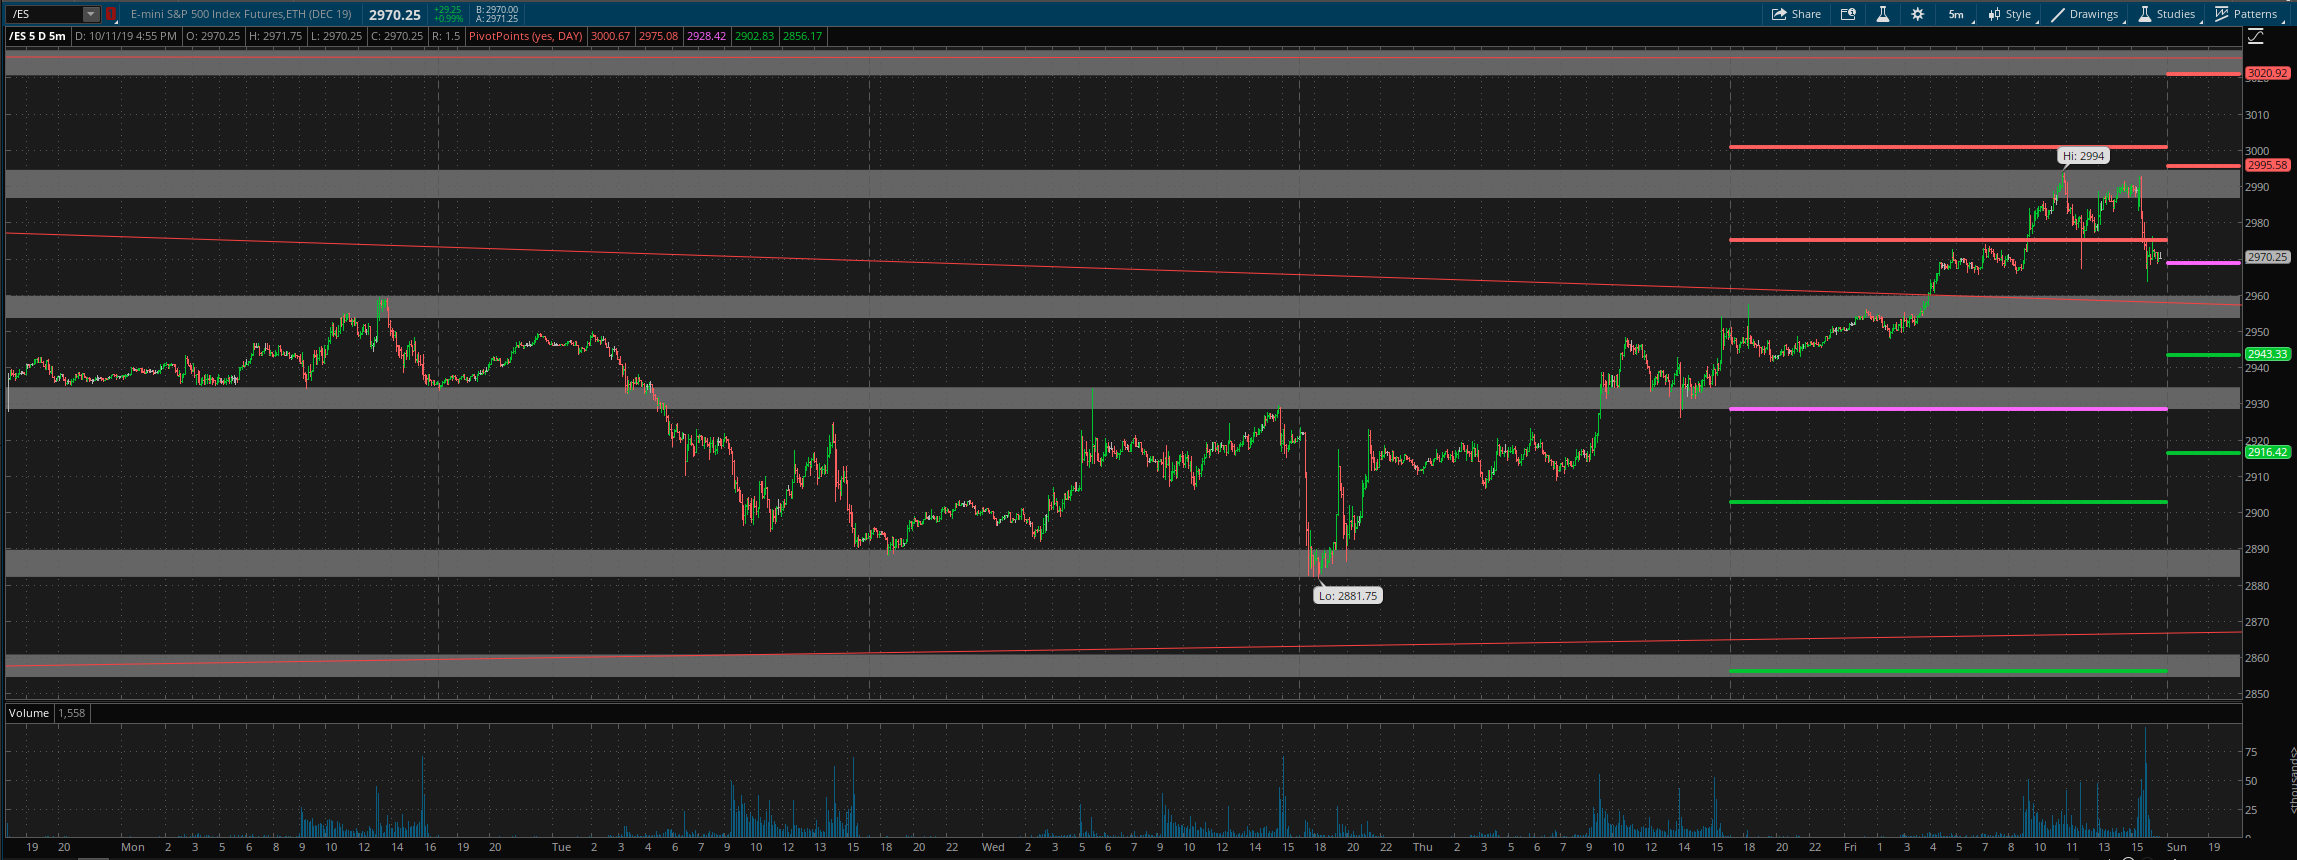
Daily pivot is at 2969. Resistance R1 is at 2995.5 and R2 at 3021. Support S1 is at 2943 and S2 at 2916.5.
All the best to your trading week ahead.
