Has the Market Reset Its Bullish Exuberance?
 By
By
In our update last weekend, we noted that "open interest and internals data continue to look bearish," so we "give the upper hand to the bears right now for the short term."
We added: "Medium term looks neutral and longer term still looks bullish. Possible spots where this correction might end are in the 2800 area and below this in the 2730 area."
In fact, the market found support just below 2800 in the beginning of the week and in typical fashion began a V shaped recovery from there to end the week above 2900.
What next?
On review of our data today, everything has been shifting from bearish to more of a neutral stance. Open interest data is neutral. Internals data is also neutral. So the big question is: Did the market reset the bullish exuberance in the beginning of the week with the 2775/76 test on the Emini S&P 500 (ES), and if so, are we ready to again continue the march to new highs?
I would have said no in the middle of the week, but right now, reviewing all the data, this possibility is quickly becoming the preferred one for me. We have seen this happen too many times to ignore the possibility. The final resistance in my mind where bears can make a stand is at 2965/66. If we get above this, I think we have to look for the market to target above 3100 next. But as always, we will continue to use our indicators to position ourselves along the path of least resistance.
ES Grey Zone areas: The grey zones on the ES 5 min chart below are what I draw in on a discretionary basis. They are supports and resistance areas which the market is most likely to react from. If we test a zone from below, it is likely to be rejected and fall lower to test support zones below. If we test a zone from above, it is likely to take support there and begin a move higher. So these zones can be used for intraday trading and/or as entry points for positioning for swing trades. These zones are drawn in based on what the market has done there previously both on smaller and larger timeframes.
Grey zone support now at 2920-13, then 2900-2891. Resistance zone at 2956-65. Break of the latter support zone or the resistance zone mentioned here should determine the next big move in the market.
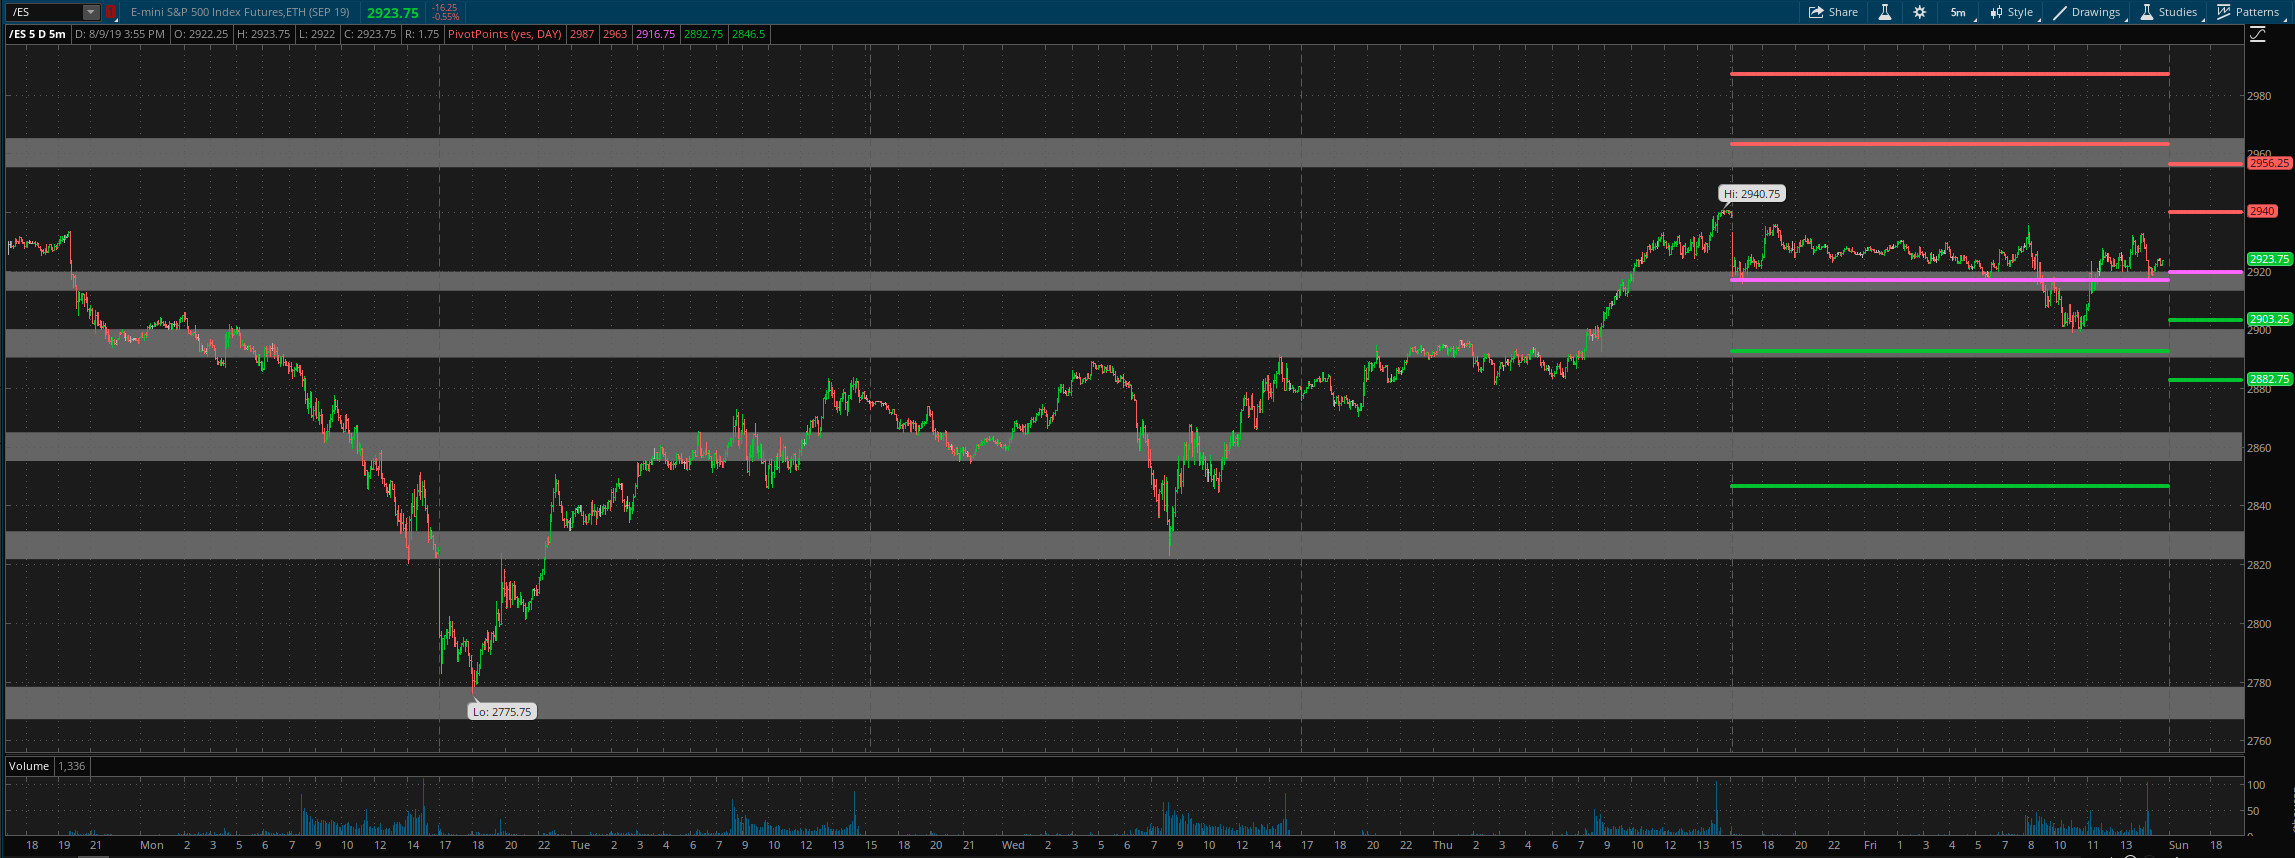
For Monday daily pivot is at 2920. Resistance R1 is at 2940 and R2 at 2956. Support S1 is at 2903 and S2 at 2883.
All the best to your trading week ahead.
