GDX: A Real-Time Practical Approach to Using Fib Pinball.
 By
Jason Appel
By
Jason Appel
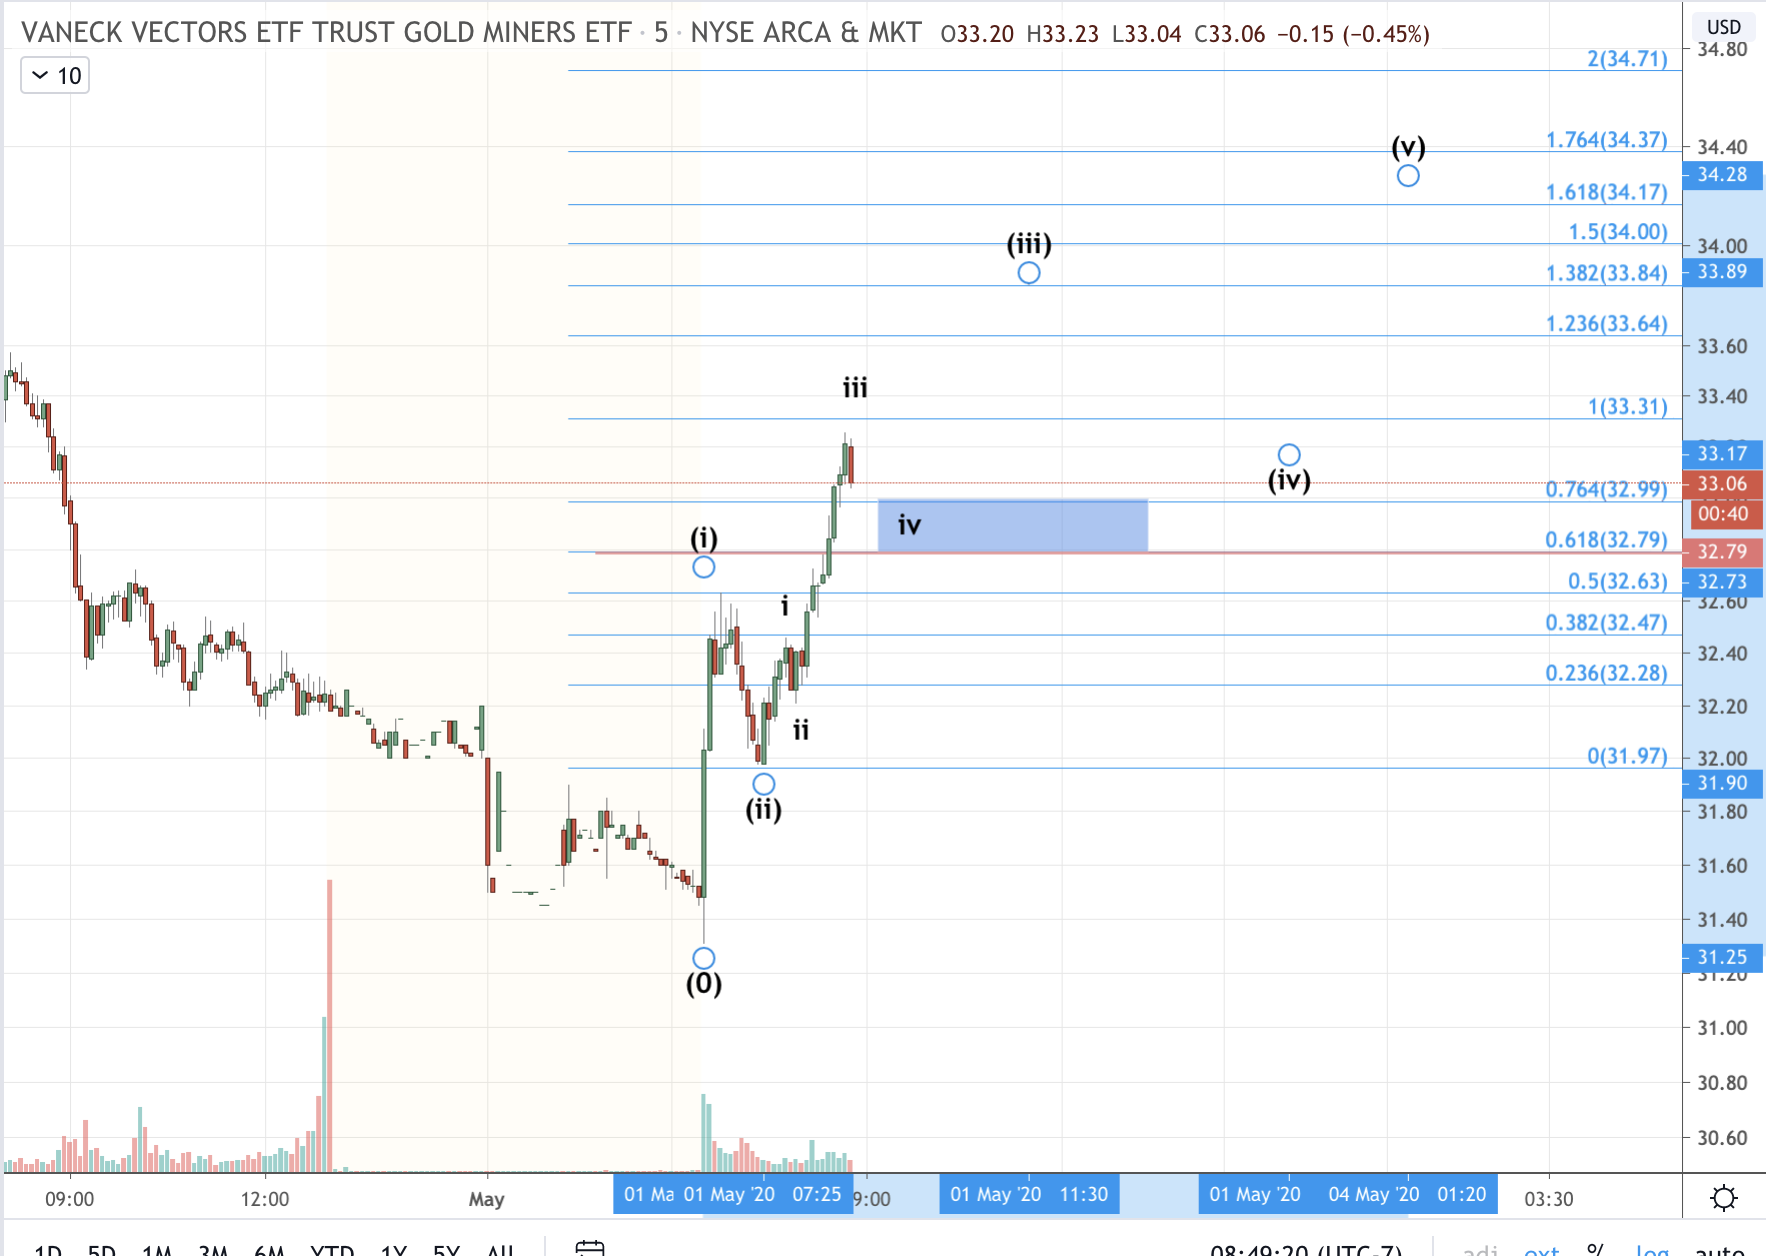
Counting Elliott waves after they happen is a good step in one's journey towards learning. Becoming proficient, though, and making use of it for trading requires real-time forecasting. This is where Fib Pinball comes in handy.
Look at the move up this morning of the low which I've labeled wave (i). Without any pullbacks inside this move, we really don't yet know if it was comprised of a smaller degree 5 waves. Let's posit that it was and thus our working hypothesis is for impulsive continuation upwards meaning that wave (i) is part of a larger impulse that will fill out with (ii)-(iii)-(iv)-(v)
What's labeled as wave (ii) pulled back and retraced roughly half of wave (i) and then the rally resumed taking out the wave (i) high. Our hypothesis is valid and has not been violated. At this point, we're looking for wave (iii) to target at the least the 1.382 extension (blue fibs). On the way there we can count the subwaves of wave (iii) and we note that wave iii of (iii) should at least strike the 1.0 extension. Check! Now that price has exceeded that level, ALL retraces should hold above the .618 extension $32.70~. Below there and our impulsive hypothesis is invalid.
As I'm writing this, price is pulling back and I don't know if that support will hold or not and quite frankly, no one does! It's purely uncertain! But using this approach allows us to have real levels to test and track a working hypothesis and navigate the uncertainty.
If support holds, we should next see north of $33.84 for wave v of (iii). If $32.70 breaks, we only have 3 waves up and we have less clarity on what could happen next and we step aside.
We'll do more of this in the webinars, primarily looking at SPX and ES.