Financial Accounts Update and Liquidity Conditions
 By
Lyn Alden
By
Lyn Alden
The Fed released the quarterly Z.1. Financial Accounts of the US today, which for financial nerds like me is a playground of data. It’s like a big balance sheet update for the entire country, from government to business to the consumer.
Here are three charts that caught my eye at first glance.
1) Money Market Top?
The amount of money held in money markets may have hit a cycle peak:
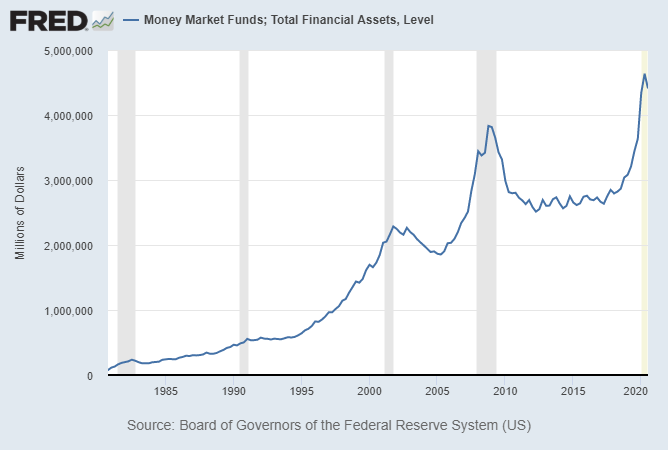
If so, it looks like it did in previous recessions, and this tends to be a good time to own solid value/cyclical stocks with a 3-5 year outlook.
It also opens up funding questions for the US government, since a big chunk of those money markets are T-Bills. The Fed might end up being forced to buy more of the government's T-bill issuance if private investors are less keen on holding high money market allocations.
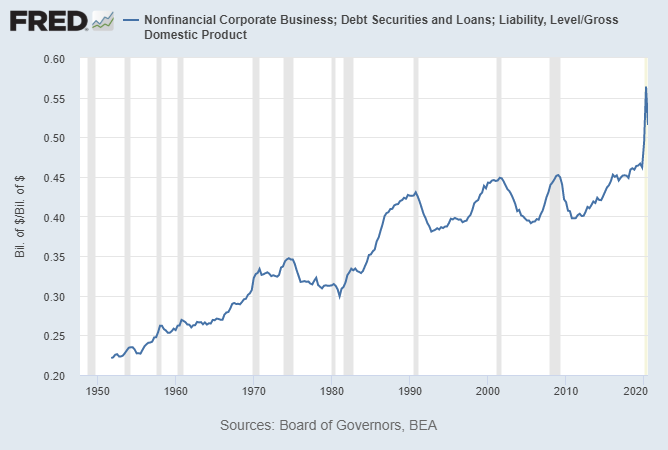
2) Debt Levels
The absolute level of corporate debt went down slightly in Q3 compare to Q2. Back in Q1 and Q2, many companies took out revolving lines of credit to make sure they had plenty of liquidity on-hand. Many of them have paid that pack and are under more normal operating conditions.
Because GDP also rebounded in Q3, corporate debt as a percentage of GDP hit a peak in Q2 and declined sharply in Q3. However, it remains very elevated:
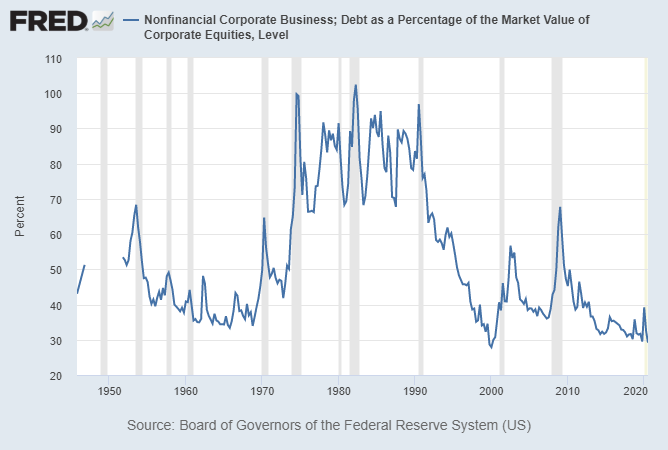
However, corporate debt as a percentage of corporate equity remains near all-time lows. This is because many of the high-valued tech/growth stocks have abnormally high equity valuations:
3) Net Worth
US household net worth hit fresh all-time highs in Q3. This continues to be unlike what happened after 2008/2009, because there has been so much fiscal stimulus and money creation this time around.
Here’s US household net worth, currently at $123.5 trillion:
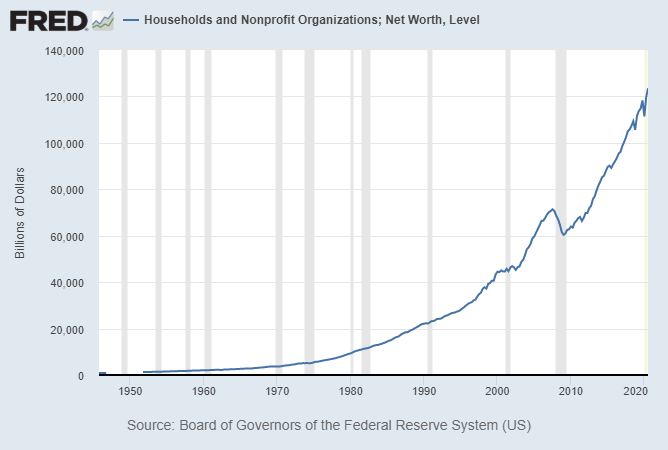
Back in 2008-2014, there was a lot of QE, but relatively limited fiscal stimulus, so the QE mostly just recapitalized banks rather than getting out into the broad money supply.
In 2020, the QE was huge, and nearly $3 trillion in fiscal stimulus spending injected that out into the broad money supply in the form of stimulus checks, PPP loans that turn into grants, extra unemployment benefits, and corporate bailouts:
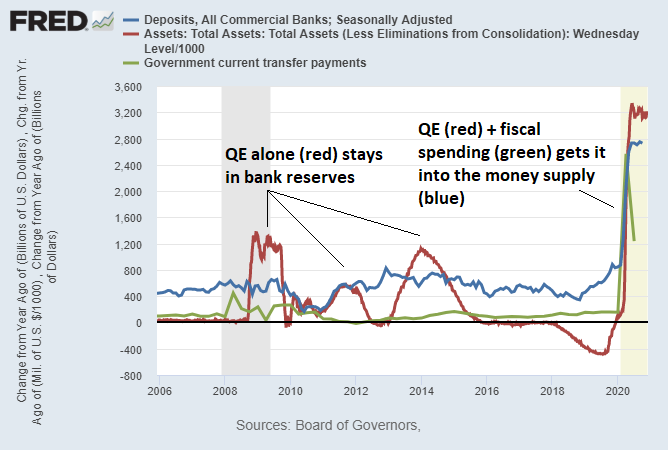
So, the financial crisis had a big deflationary shock, as $11 trillion in net worth was lost and took years to recover, while 2020 so far has had a much larger fiscal response, and fresh highs in net worth. Money printer go brrr.
Lawmakers are currently debating for another $900B+ stimulus deal, because job losses remain very high and millions of folks are facing potential eviction. If that were to not go through, it’s still possible that we could get a deflationary shock in early 2021.
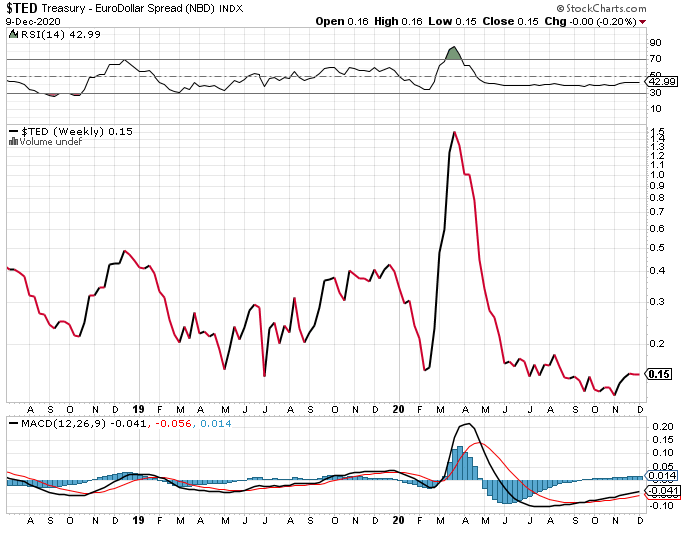
Bonus) Liquidity Conditions
Going away from the Z.1 release, offshore USD liquidity conditions still look good. The TED spread has inched up from its bottom, but remains low:
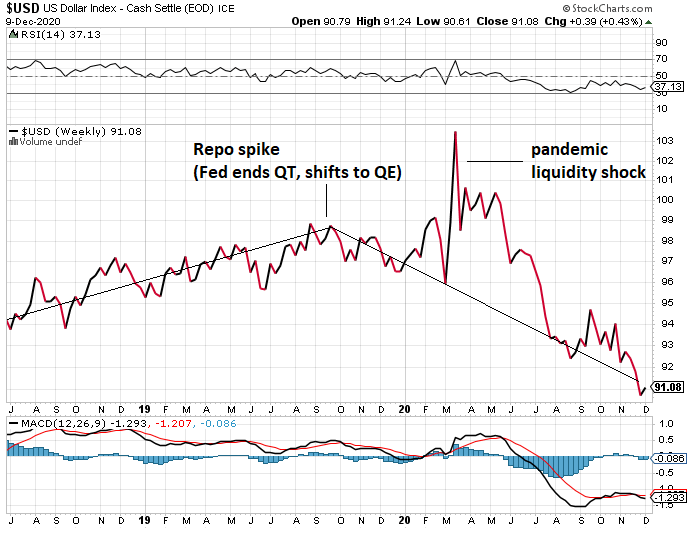
The dollar index remains in a structural downtrend ever since the autumn 2019 repo rate spike forced the Fed to shift from reducing its balance sheet to increasing its balance sheet, although the pandemic temporarily blew it off trend:
The next 3-6 months look rough for a lot of economic indicators, particular jobs and solvency issues, but I continue to think that the market is potentially underappreciating the reflationary potential that could happen as early as the second half of 2021, or if not then, then perhaps more firmly by 2022-2023. A lot of things look a lot different in 2020 than they did in 2008/2009.
