Eyeing New Lows After One More Bounce
 By
By
In our update last weekend, I wrote: Internals continue to look bearish. Options data looks bearish for Friday data alone but neutral over the whole week. The razzmatazz waves are also on the bearish side. Price is bearish on the short and medium term timeframes. Long term is neutral/consolidating right now after the big run higher. Our short term indicators are on sells/neutral and the composite signal is short as a result. We also have a short position on at the moment. Structure on price and the way internals are looking suggest that the 3200/3150 area is the next target area in the markets - BUT this is also looking too obvious at the moment - so I am on the lookout for something more convoluted playing out first like a bigger bounce to test 3400 area again before breaking down toward 3150. Regardless, system signals and odds are supporting the short side right now so we will continue to hold the short trade until this changes."
What actually happened:
Market reached the 3200 area on the Emini S&P 500 (ES) and slightly below before bouncing to end the week near 3300 again.
Summary/What next for this week?
Internals continue to look bearish. Options data looks bullish very short term suggesting that the bounce started on Friday may continue for some more time. Beyond this the options data looks bearish particularly October expiry is showing some warning signs. This is suggesting that we are in a b-wave or countertrend bounce before another leg down beginning later in October. Price action short term is neutral/turning up, Medium term is bearish, Long term is neutral/consolidating after the huge run up. Our composite signal continues on a sell signal but the odds indicator went to the long side during the last week. The composite signal may also join the long side during the coming week. My current view is that we continue the bounce started on Friday toward the 3450 area and from there possibly begin another leg lower to new lows somewhere in the 3000/2900 region. Regardless…as always, we will continue to position ourselves as the composite signal and the odds indicator suggests.
Pivots/Zones:
ES Grey Zone areas - The grey zones on the ES 5 min chart below are what I draw in on a discretionary basis - they are supports and resistance areas which the market is most likely to react from. If we test a zone from below, it is likely to be rejected and fall lower to test support zones below. If we test a zone from above, it is likely to take support there and begin a move higher. So these zones can be used for intraday trading and/or as entry points for positioning for swing trades. These zones are drawn in based on what the market has done there previously both on smaller and larger timeframes.
Grey zone resistance at 3313-27 and then at 3353-66. Support is at 3269-56, 3219-06 and then at 3181-70.
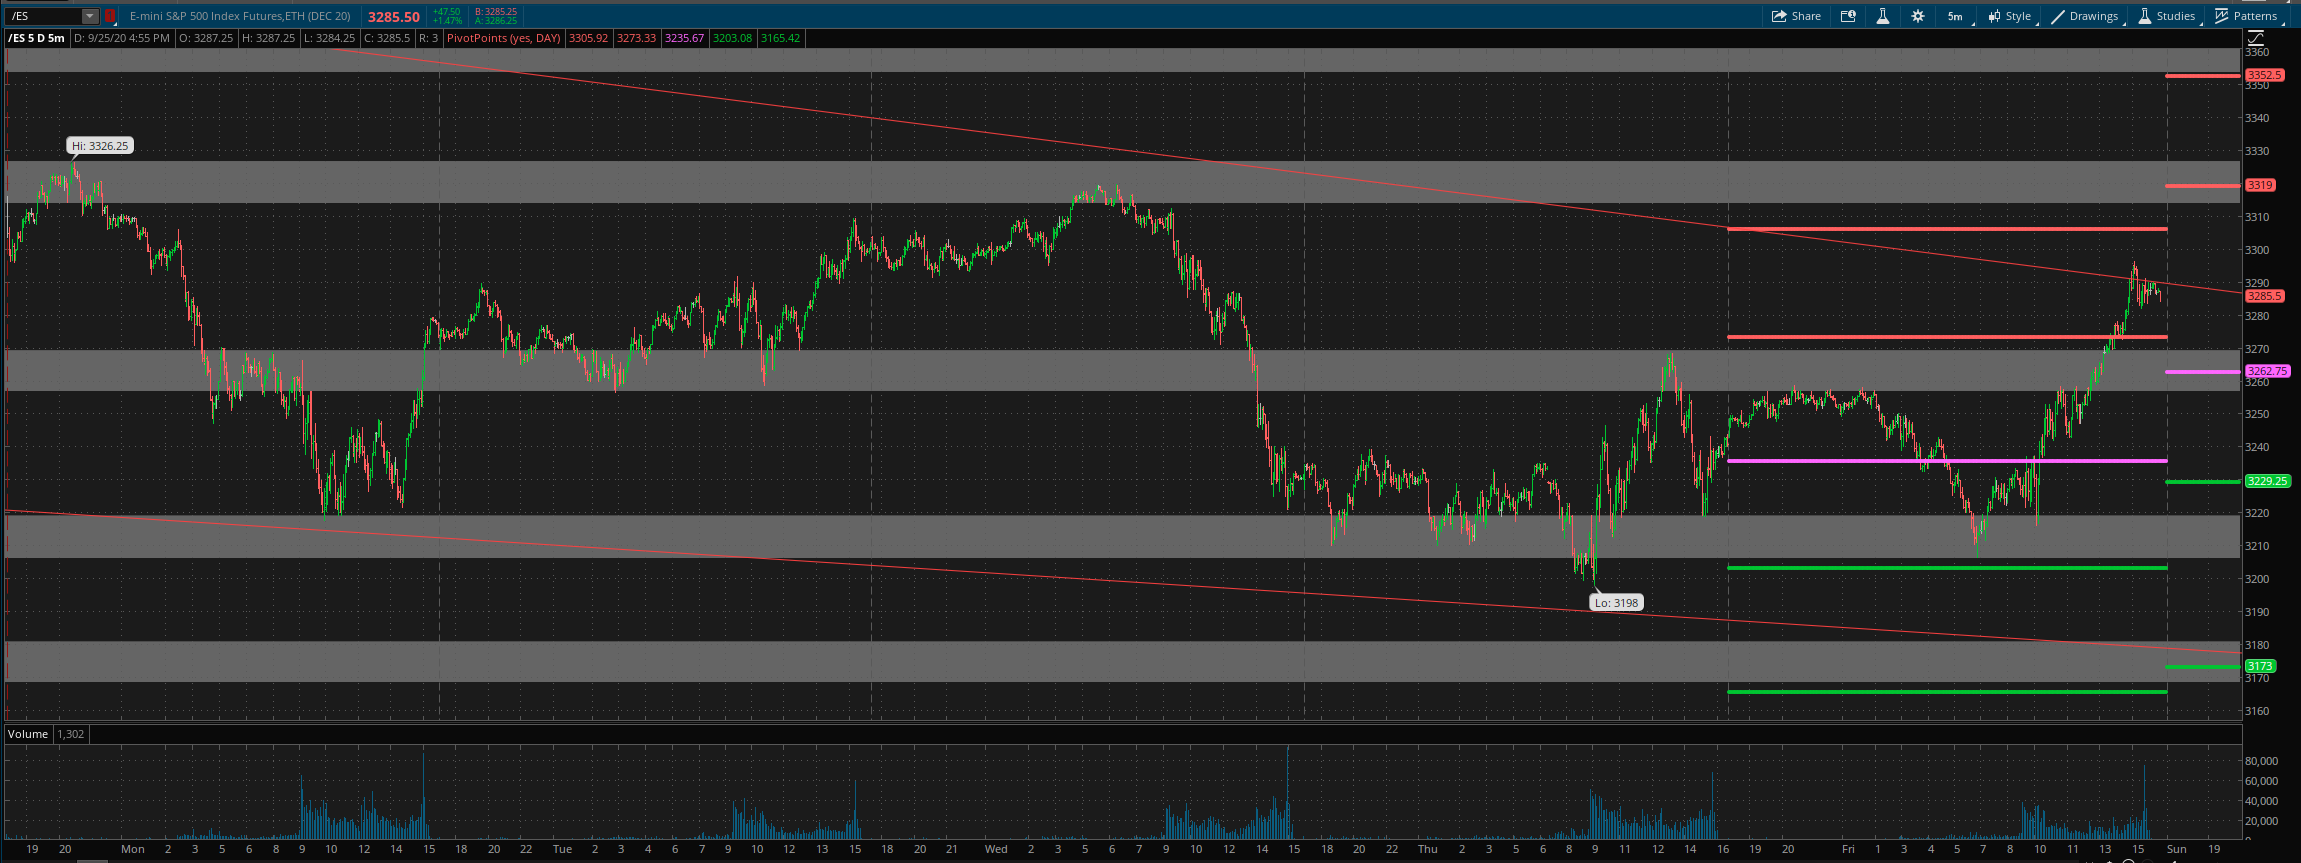
For Monday, daily pivot is at 3263. Resistance R1 is at 3319 and R2 at 3352.5. Support S1 is at 3229 and S2 at 3173.
All the best to your trading week ahead.
