Eyeing Bullish Primary Count in TLT
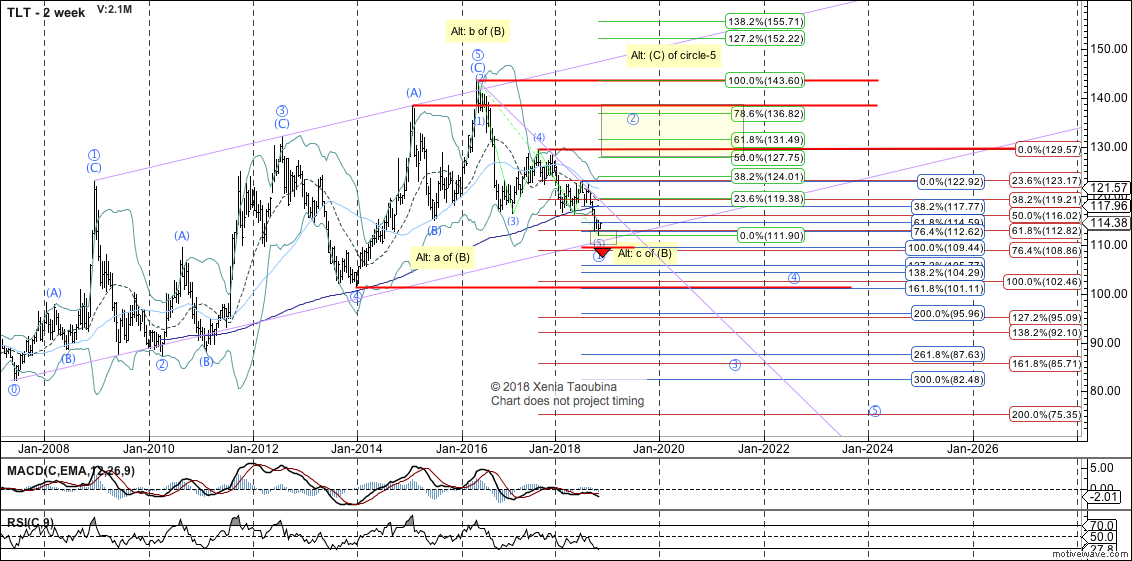
Since the run-up to the 2016 high, I was of the opinion that iShares 20+ Year Treasury Bond ETF (TLT) was potentially making a multi-year, and even a multi-decade top. While the multi-year perspective was confirmed (more than years have passed without new highs), TLT is now at a potentially critical juncture to confirm, or disprove, the multi-decade perspective. IF a direct break below 109 is seen, in this stance, it will make it likely that a multi-decade top is in (structure discussed in the next paragraph). For as long as it's holding this level, however, potential for a multi-month bounce (labeled as primary), and even a new high (labeled as Alt), exists.
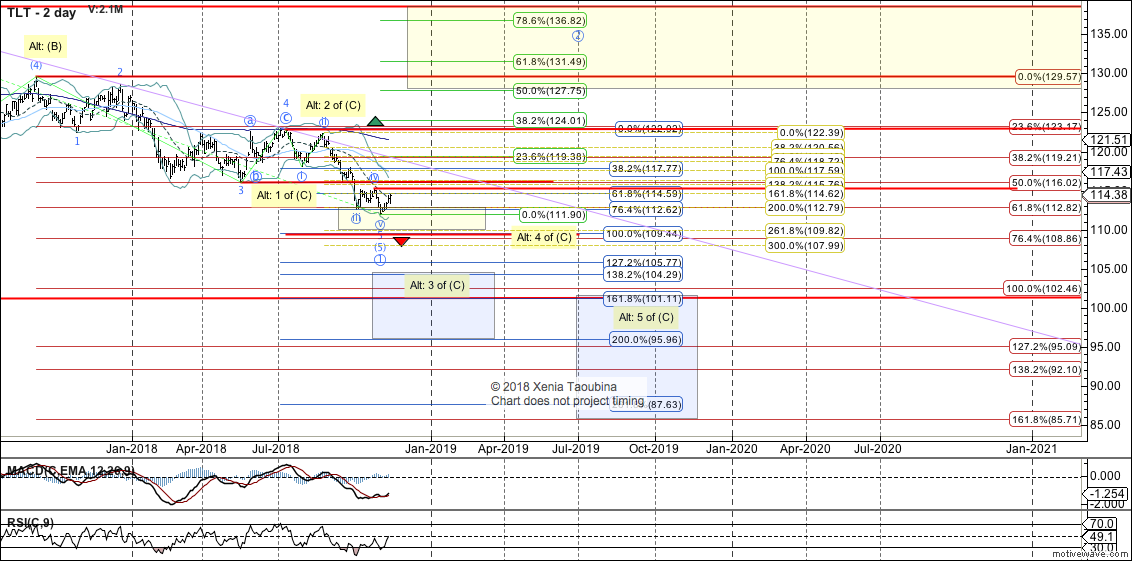
Zooming in to the 2-day chart, TLT is standing in an uncertain stance, either completing an extended wave 5 down off the 2017 high (labeled as primary), or about to accelerate lower, per the "Alt" count. As a minimum indication of the bullish primary count, TLT needs to reclaim 118.03, with confirmation over 122.92. Conversely, a break below 109.44 will be a fairly good indication that bearish Alt count is playing out. Under that count, it is likely that TLT will reach 101 area at a minimum. With smaller degree action, the primary count is favored; however, price action needs to confirm it.
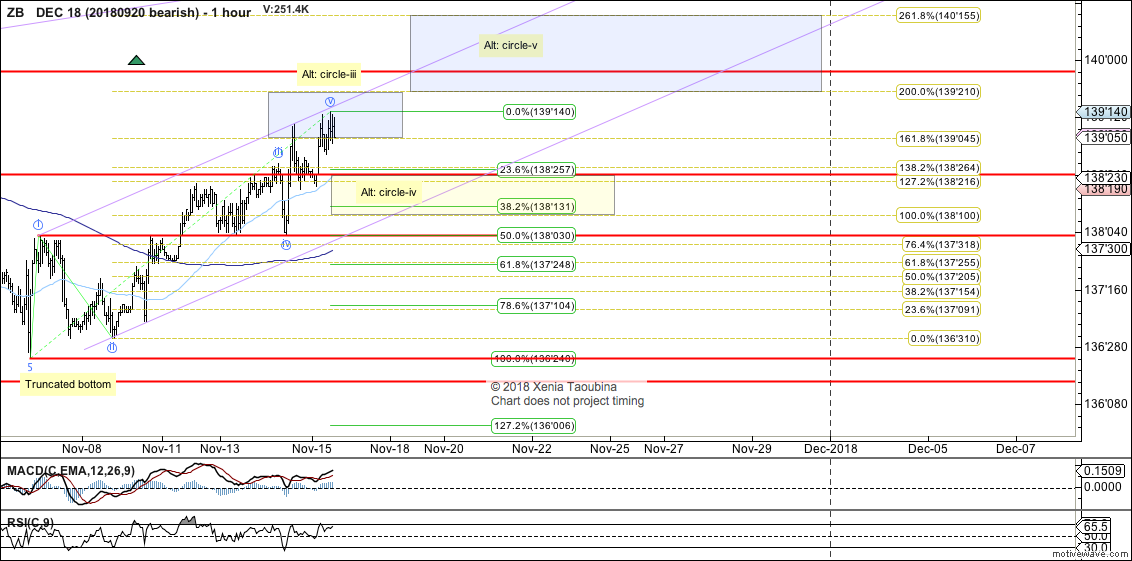
In futures (ZB chart), with a move over 1.618 extension, I am now inclined to view ZB as completing 5-up off November low, and with it, opening up potential to a larger degree bottom being struck at that low. To make it likely that this impulse completed, ZB needs below 138'10, with confirmation below 138'03. Because of the fact that November bottom was not a clear impulsive bottom, however, I would like to see ZB stage a corrective pullback below 138'03, AND then break out over the high that's being made presently to confirm the bullish perspective; until then, potential exists that present high is wave C off October low (scenario not labeled).


