Eyeing A Bounce As Internals At Extremes
 By
By
It was another bearish week last week breaking the 4450 support level on the Emini S&P 500 (ES) before settling the week below 4400.
Looking ahead, price action is bearish short term, bearish medium term and neutral long term. Short- and medium-term internals continue on the sell side, and long-term internals have been inching toward the sell side.
Our Odds Indicator is currently flat but looking for a buy entry soon. Some internal charts are at extremes suggesting a rebound rally. Similarly, some put call ratio charts I look at are also getting into extreme areas suggesting a bounce soon.
It was a very bearish opex week last week. We have seen similar setups in the past where the low gets set on either the Friday of Opex week OR the Monday after Opex week. I think something similar can play out this time as well and from this potential low we can get a bounce into somewhere in the 4500 area. Above 4400 area is the first sign that we may have a potential temporary low with confirmation above 4435.
Grey zone resistance at 4390-97 and then 4431-38. Support is at 4359-50 and the 4320/4300 area.
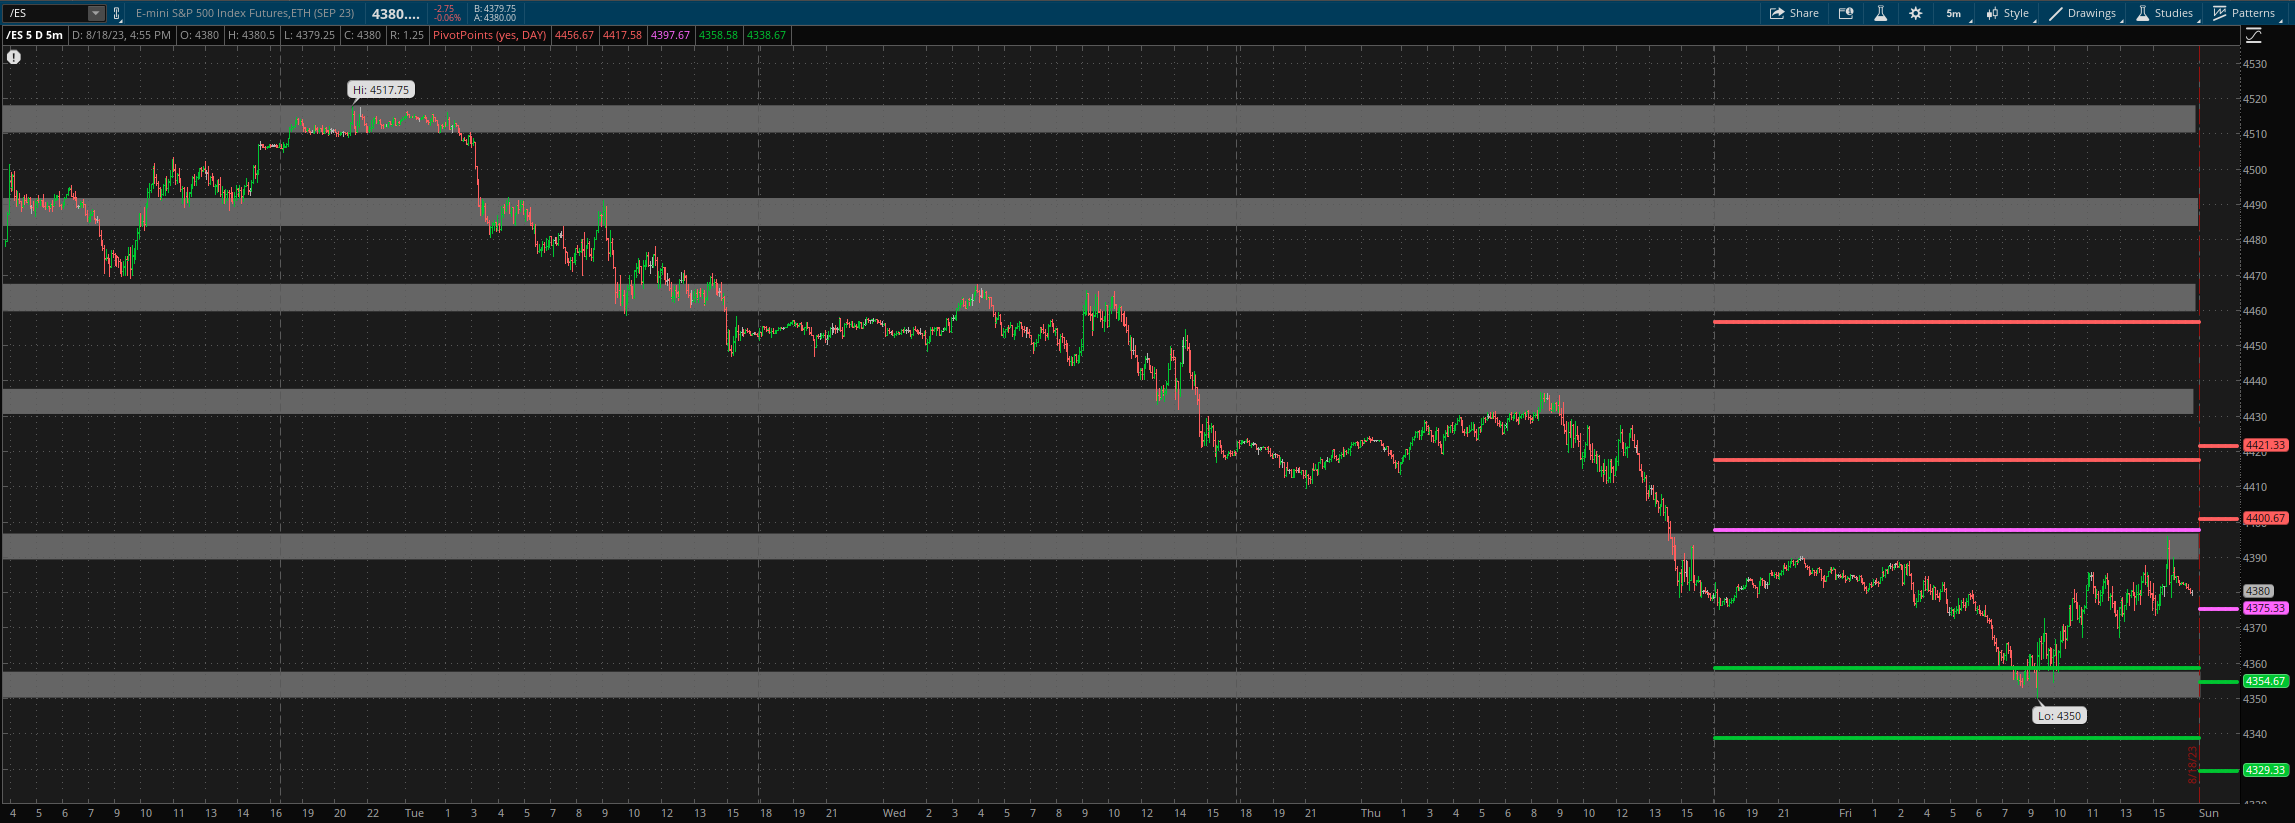
For Monday, daily pivot is at 4375. Resistance R1 is at 4401 and R2 at 4421. Support S1 is at 4354.5 and S2 at 4329.
All the best to your trading week ahead.
