Eyeing 2947-50 Resistance
 By
By
In our update last weekend we noted: "We tried to clear the 2915-20 zone but it rejected from just above and sold off right back into and below the zone. And there was some pretty good volume off the top. This does suggest a decent chance that the top on Wednesday was important. However, as we have also seen many times, bulls can always come back with a bang and take the market much higher than we expect. As of now, I am viewing that 2923.5 top as important but if we clear it, we should get up to the 2945-50 zone we were looking for last week which could be an important top."
What actually happened: Like I said… never underestimate the bulls. We got above the 2923.5 area on the Emini S&P 500… but could not quite make it above 2940 right away… backtested support and then ended the week with a bang near 2940 area.
What next?
All of our Smart Money core indicator setups are on buy right now. But what I call micro is on an exit/sell. Market is clearly rallying on weaker internal strength. Usually these type of rallies fizzle out, and the market tests support to build more internal strength before moving back higher again. But we can also push higher through that 2950 number which forces internals to improve somewhat before we hit close to the 3000 mark. Should be open to either possibility here.
On the upside 2947/50 is resistance. Clearing this will open up 2980-3000 area, maybe a little higher, but if we get there, we should almost certainly get a bigger reaction lower as we have been getting once we hit big round numbers.
On the downside, must-hold support for the bulls is 2890-85 area. As long as this is held, bulls have the upper hand on the intermediate timeframe. I do not see a clear edge this weekend, but I think bulls have the upper hand and a move through 2950 should take us up closer to 3000 area. But no need to speculate or overthink this too much - if we get some strength tomorrow, our micro signal should go back to buy which will put us back into long positions. Responding to what the market is actually doing vs. what we want it to do - this is what every trader should keep focus on when trading.
ES Grey Zone areas: On the upside, we have resistance at 2941-47 and above this I don’t have anything much until 2980 area. On the downside, first support is at 2924-18 and then 2894-89.
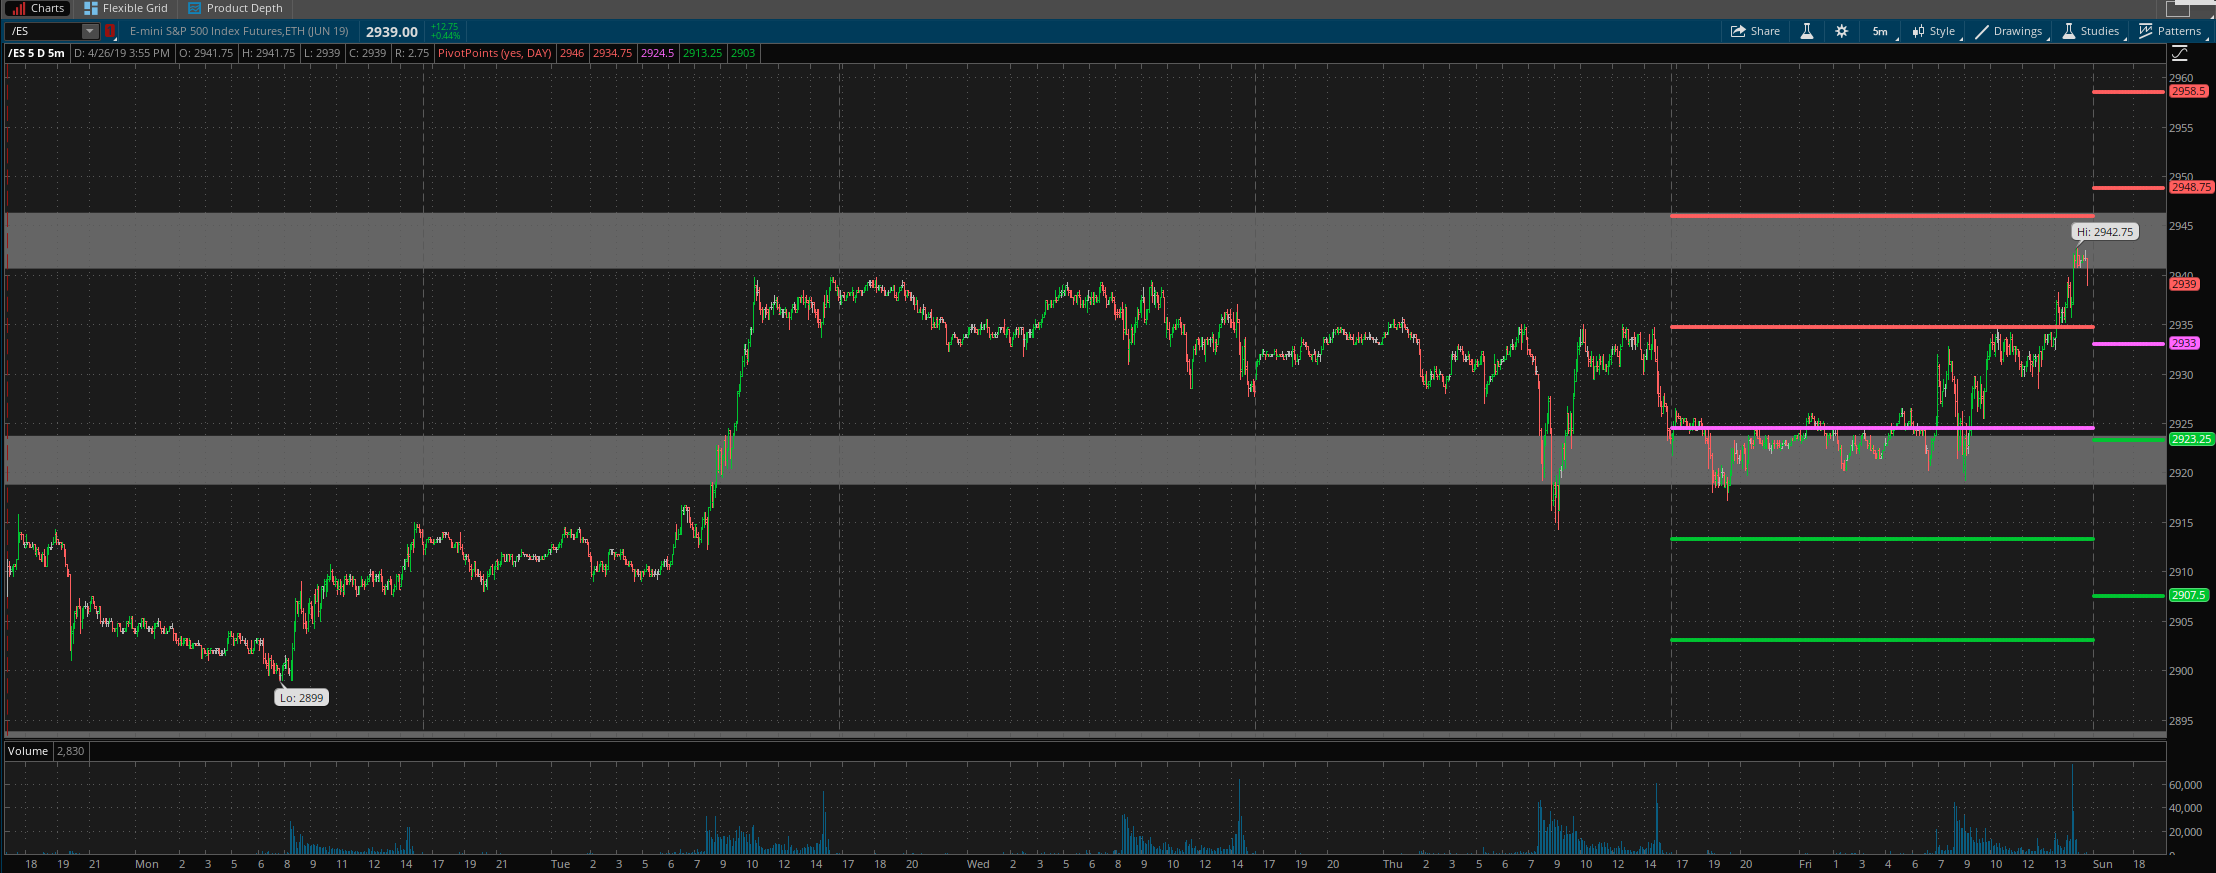
ES daily pivot is at 2933. Resistance R1 is at 2949 and R2 is at 2958.5. Support S1 is at 2923 and S2 is at 2907.5.
I wrote up a Trader Metrics post on Friday near the close. There are stats on the NYHL1M system and Smart Money room trades metrics as an example toward the end of the post. I would encourage anyone who missed it to take a closer look at the post here:
https://www.elliottwavetrader.net/members/atchat/?threadId=5240407
All the best to your trading week ahead.
