Expected Pullback Begins - Market Analysis for Jun 14th, 2020
 By
By
In last weekend's report, I noted:
"The parameters for the long trade are getting very tight so I expect the system to give us an exit on the long trade this coming week. My read on the markets is that last week was bearish capitulation of sorts and we may have hit at least a temporary top or are very close - and are looking at a significant pullback for the markets very soon. Too early to say how low but somewhere in the 2850-2750 range looks very possible to me as an initial low. While a top and pullback is a good possibility - remember that the indicators and system is still on a buy signal and so we have to stay long until it actually turns."
What actually happened:
As expected, we topped out and began the pullback. We got an exit signal on our long trade very early in the week allowing us to exit very close to the actual price top. We also got a short signal on Thursday and we have a short trade on right now. We hold this until we get an exit on the system.
Right now, internals look bearish more or less. Options data looks somewhat bullish. And price action is clearly bearish. This coming week is monthly OPEX and we should see a lot of weird price action across the board. OPEX weeks generally have a bullish tilt - so price can have a rather strong rebound for the week before turning lower. What makes things more complicated though is that this OPEX is a quarterly one as well, and we have had some very bearish quarterly OPEX instances in the past.
So this can play out either way: strong rebound to 3150 area killing all shorts before the actual downside begins once OPEX is out of the way. OR we just directly move lower. Either way, I am expecting more downside, the only thing is if we are going to get a big rebound rally first. On price, I put out a pullback target of 2850-2750 last week -- no change in this -- this looks like the most likely area for an initial low for this pullback.
Pivots/Zones:
ES Grey Zone areas: The grey zones on the ES 5 min chart below are what I draw in on a discretionary basis -- they are support and resistance areas which the market is most likely to react from. If we test a zone from below, it is likely to be rejected and fall lower to test support zones below. If we test a zone from above, it is likely to take support there and begin a move higher. So these zones can be used for intraday trading and/or as entry points for positioning for swing trades. These zones are drawn in based on what the market has done there previously both on smaller and larger timeframes.
Grey zone resistance at 3032-47, 3072-85 and then at 3124-45. Support is at 3005-2989, 2974-58 and then at 2919-04.
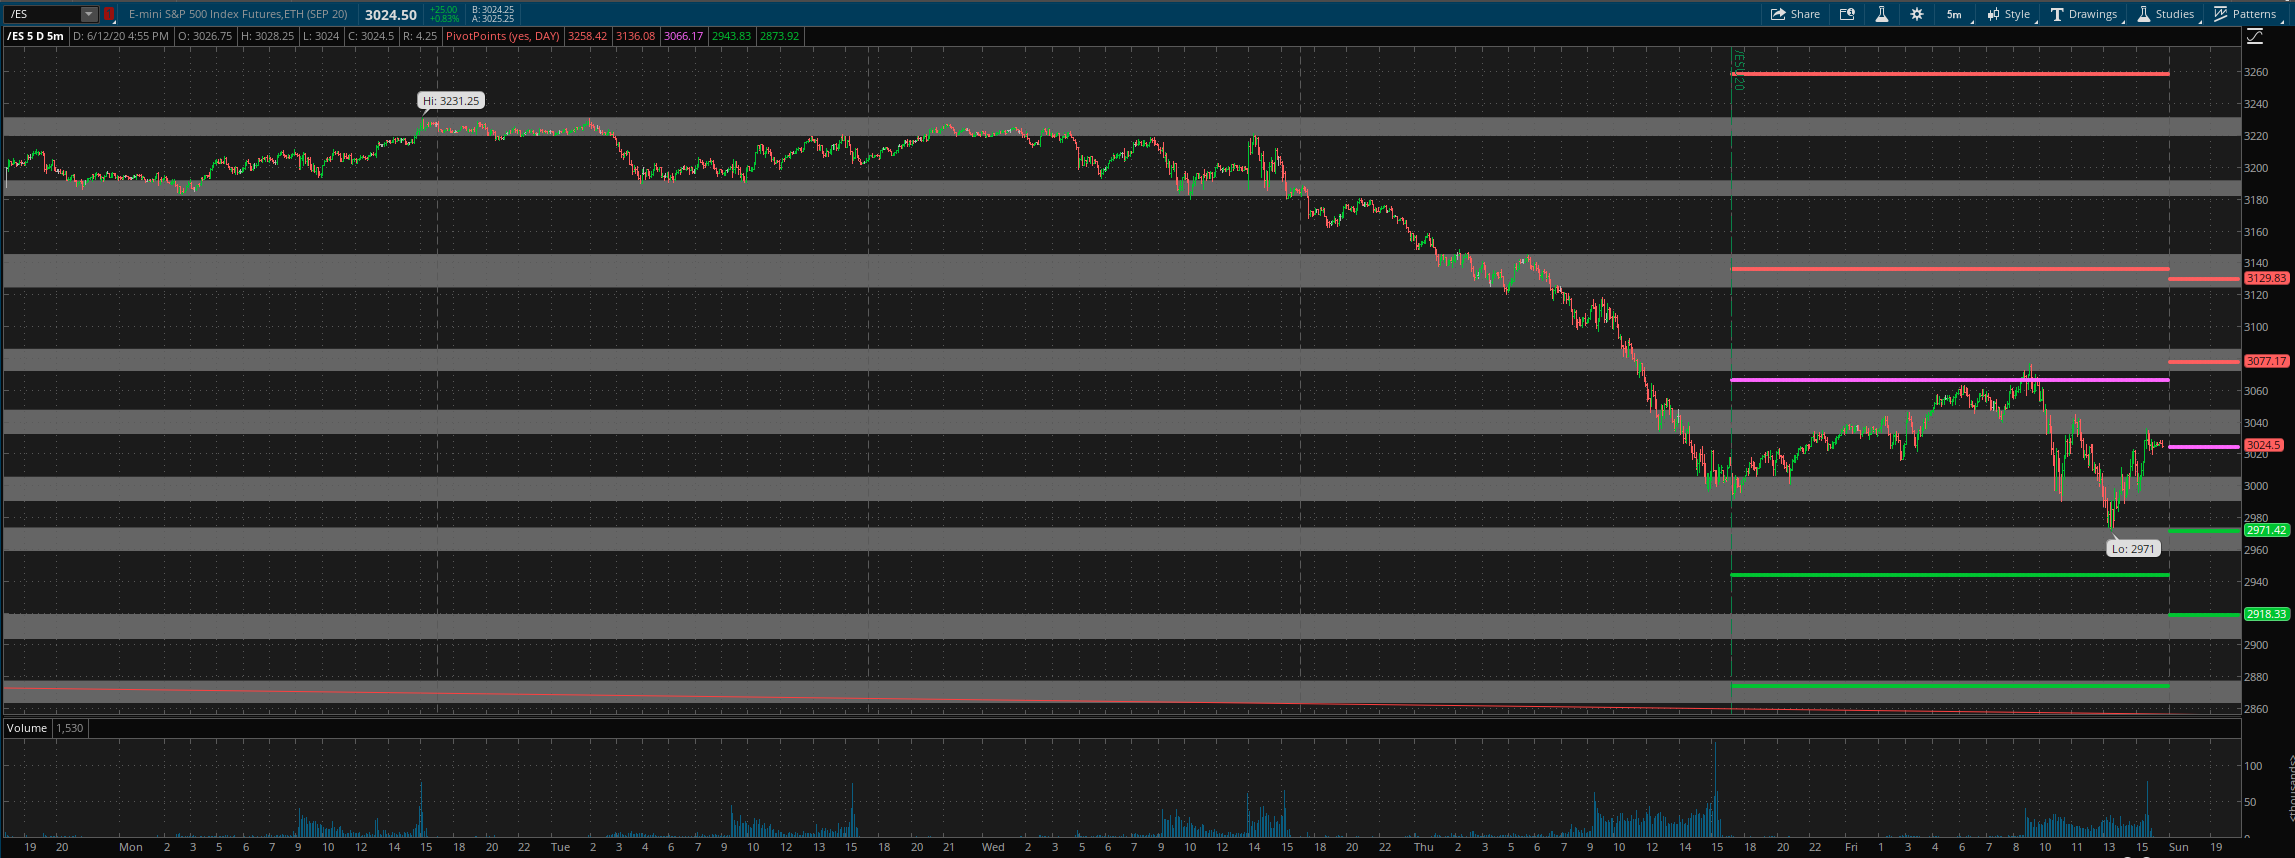
For Monday, daily pivot is at 3024. Resistance R1 is at 3077 and R2 at 3130. Support S1 is at 2971.5 and S2 at 2918.
Summary:
As I wrote above, we exited another very profitable long trade very early last week. 273 ES points were made on the trade. On the room official trades, we made 18.3% and 14% gains on two separate tranches of SSO (2X SPY).
Here is a short video I made that describes my trading system and how we use it to capture trending moves in the market: https://www.elliottwavetrader.net/videos/Princely-Mathew-Using-Market-Internals-In-Trading-202005147847.html
All the best to your trading week ahead.
