European Indices Higher Last Week
 By
By
European indices traded higher last week, looking to possibility put in a near-term bottom, while indices in the Americas were mixed.
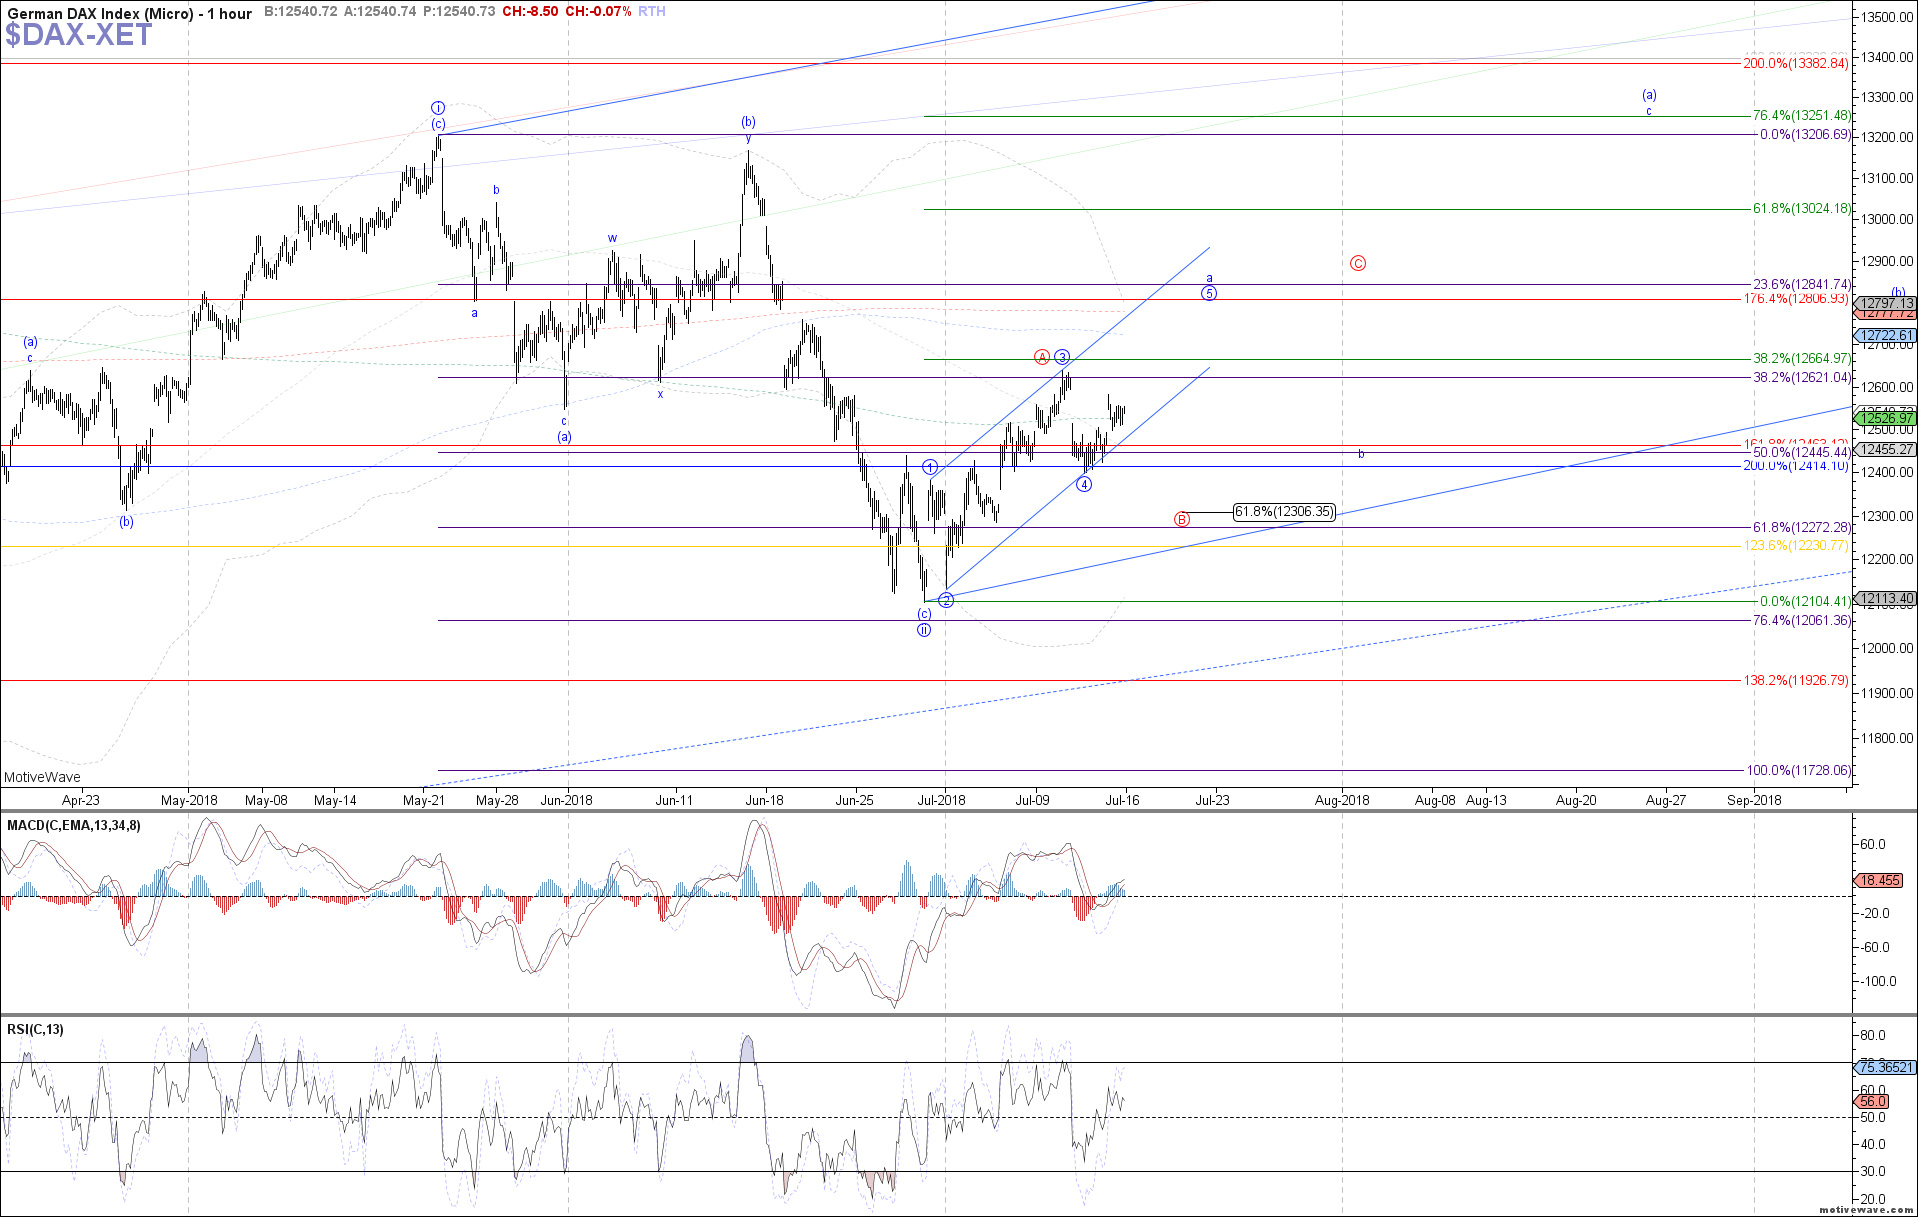
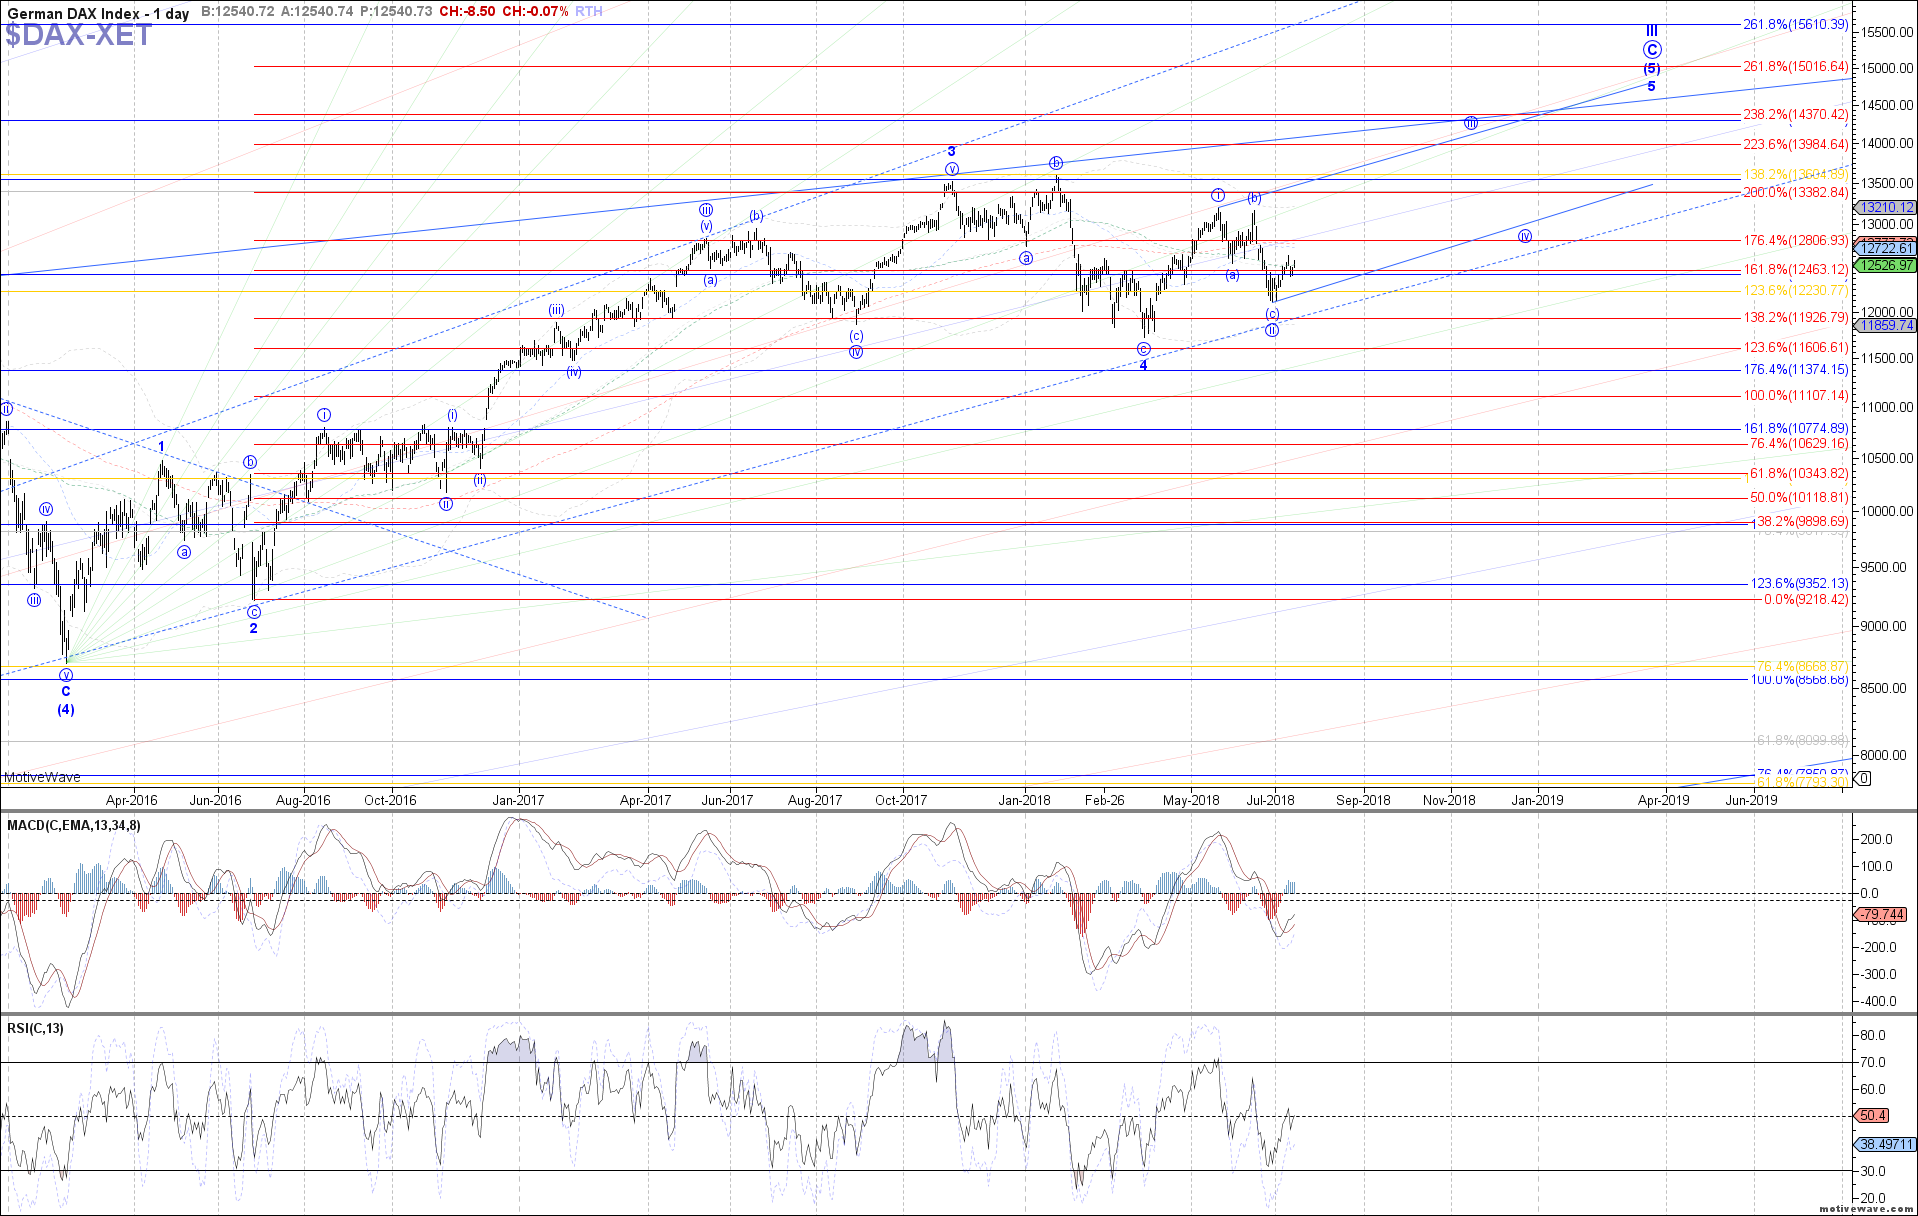
DAX: The DAX Performance Index started off initially higher last week, adding further support to a bottom in place at the June low as wave ii of 5. Now the question is did last week’s high complete wave 3 of a leading diagonal a-wave shown in blue, or wave A of a shown in red. The former would suggest immediate upside follow through as wave 5 of a toward 12720 – 12775 from here, before the next pullback in wave b. Otherwise below last week’s low confirms the red path, with 12305 as support that should hold as wave B of a.
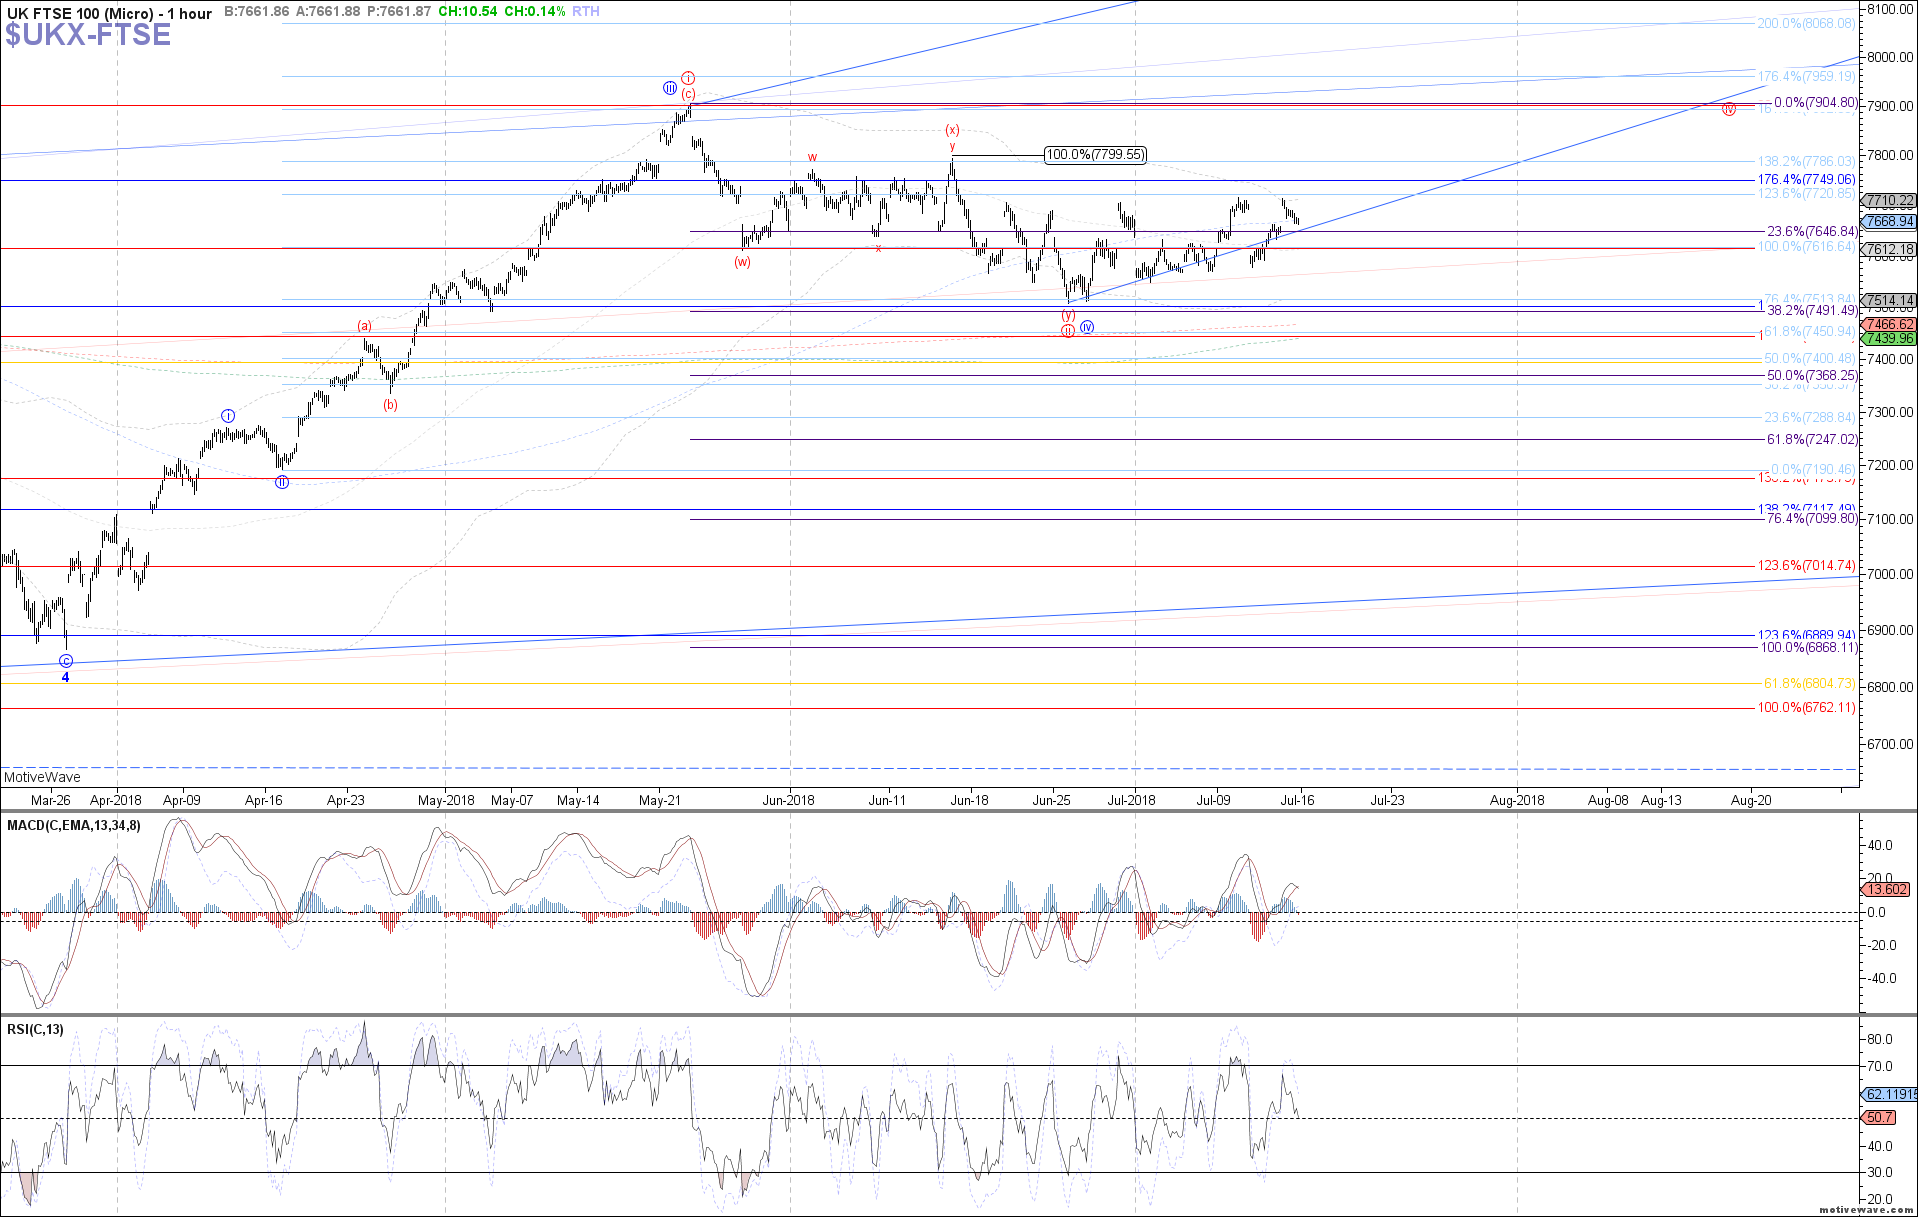
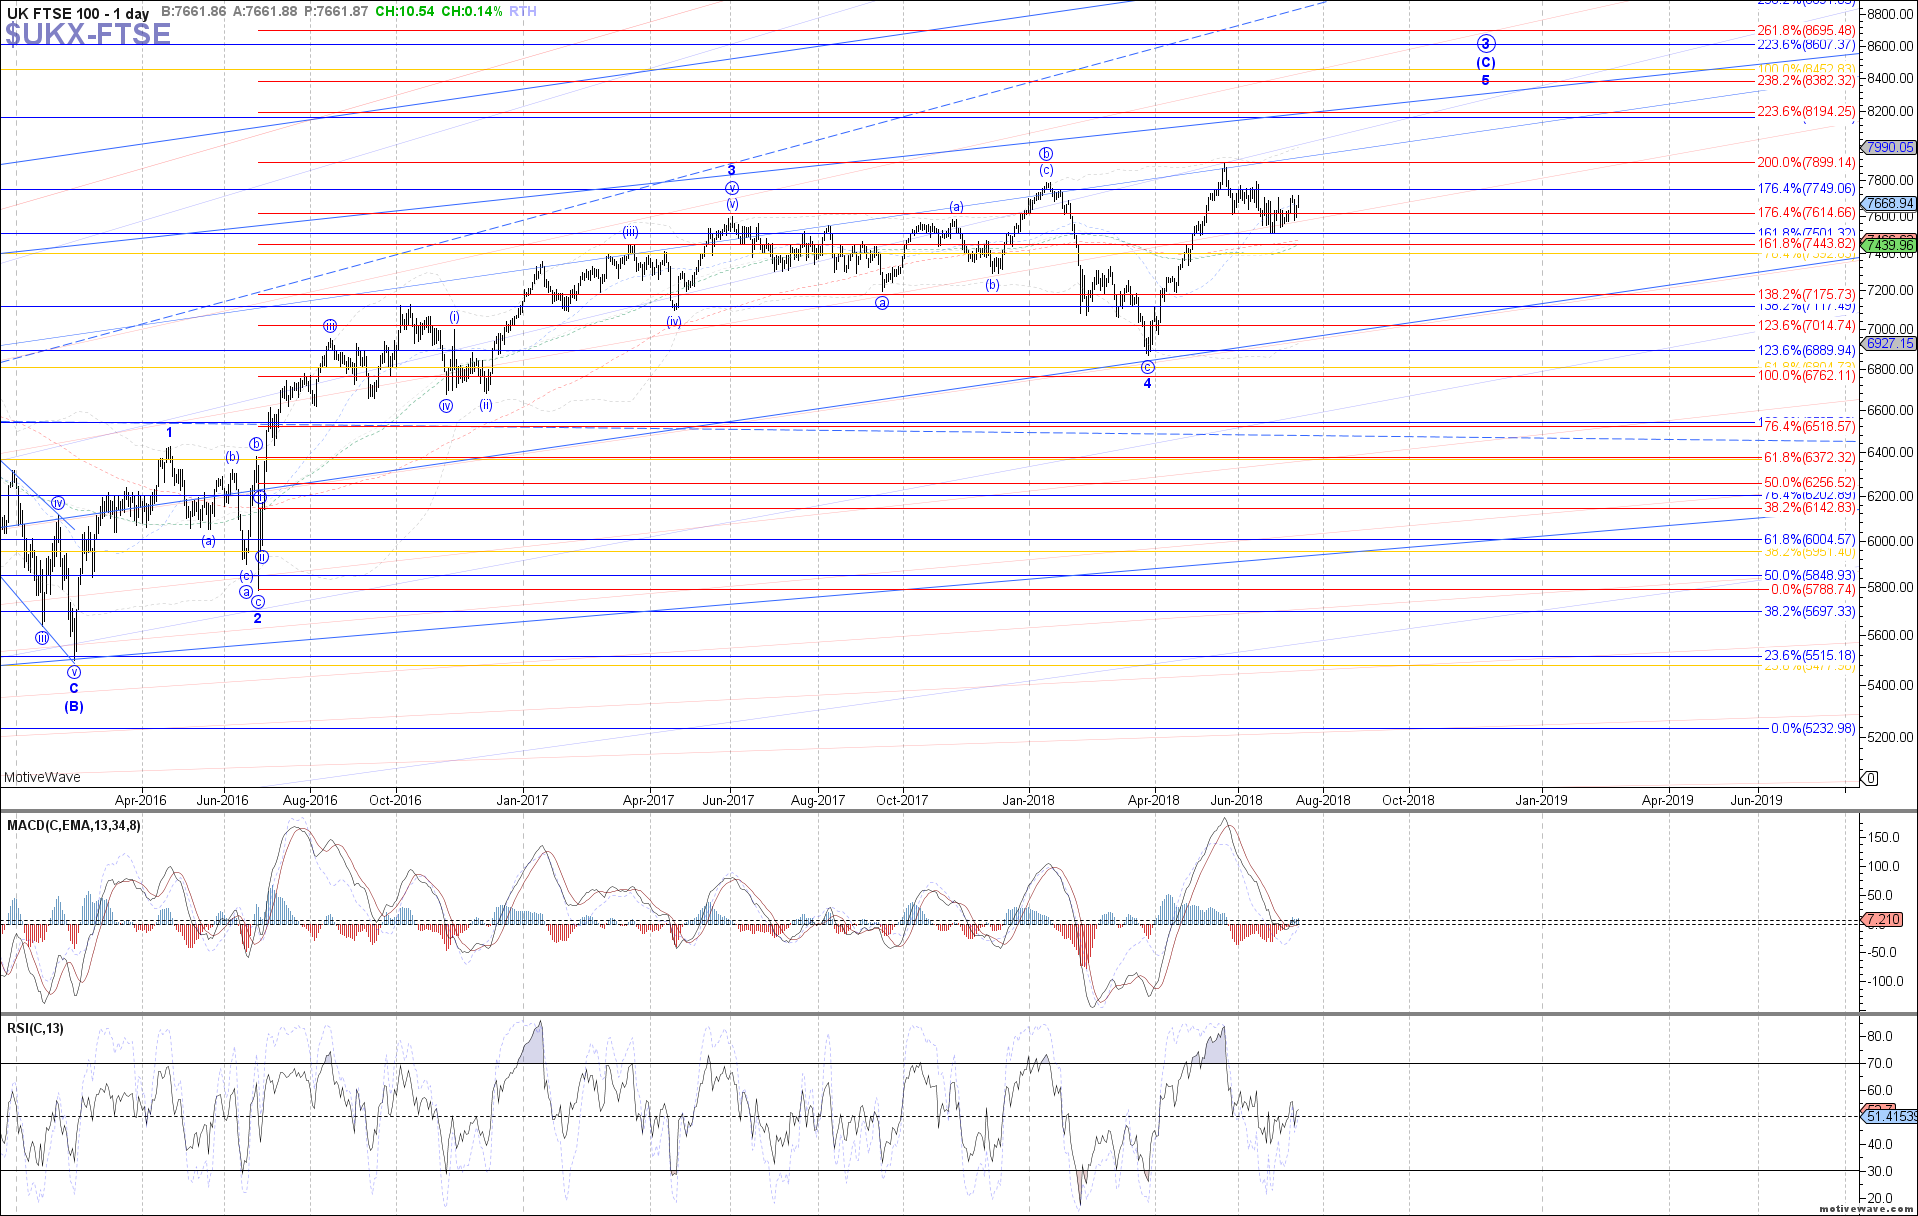
FTSE: The FTSE 100 Index traded higher overall last week, but otherwise has still not made a sustained break above the next signal level at 7710 to further prove that a bottom is in place as red wave ii or blue wave iv, and price is heading toward a new high as red wave iii of 5 or blue wave v of 5. As long as the low made last week hold though, this price action can still be considered constructive, with 7710 still being the next hurdle to clear from here.
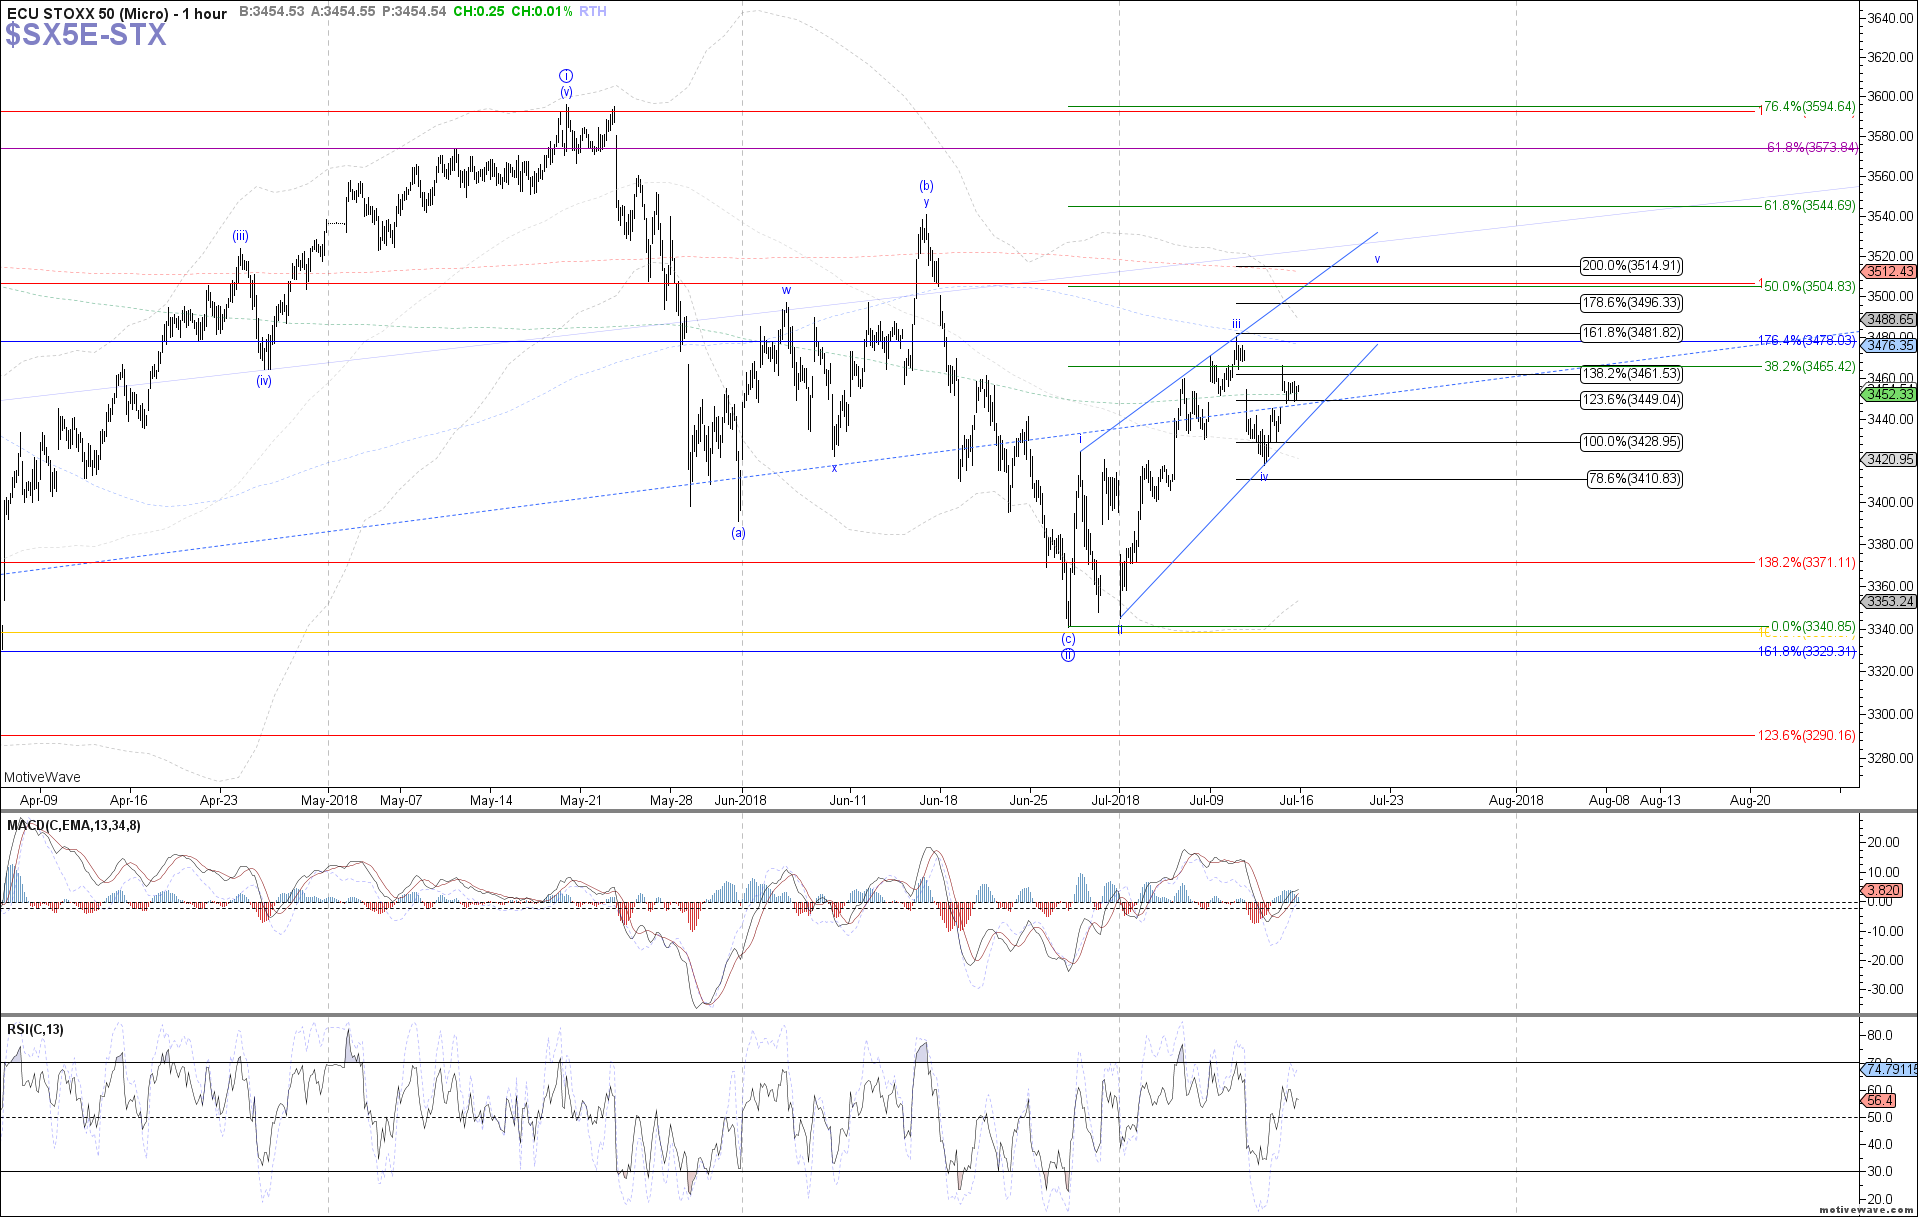
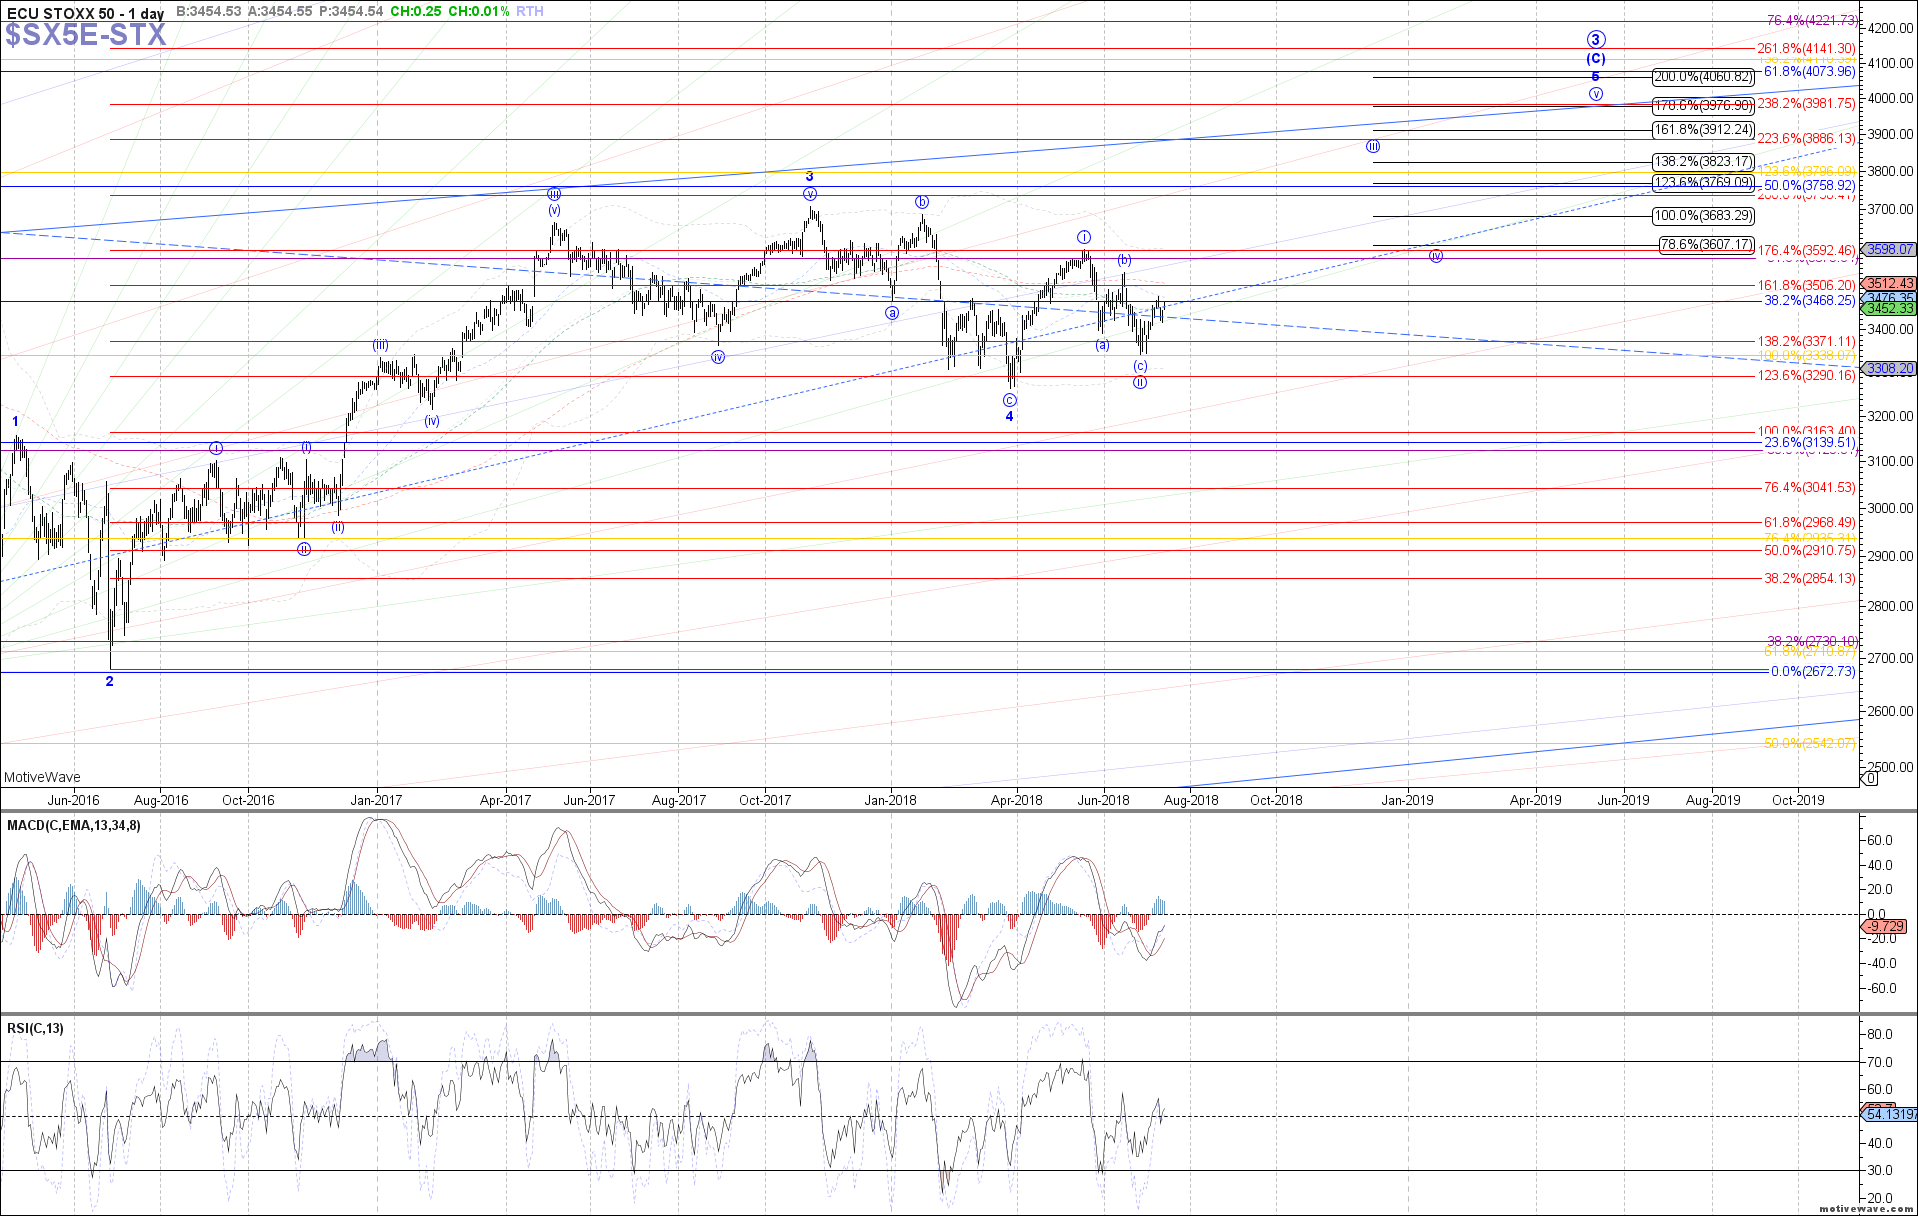
STOXX: The Euro STOXX 50 Index traded higher overall last week as well, ideally working on filling out 5 waves up off the June low as either wave (i) of v if an impulse or an a-wave if the larger structure is going to end up being a diagonal like the DAX suggests. If price is working on 5 waves up off the June low, then last week’s low ideally completed wave iv of a leading diagonal, with price now starting wave v toward 3515 next. The alternative would be that last week’s low was only the A-wave of a larger flat, which would place support for a C-wave at 3405.
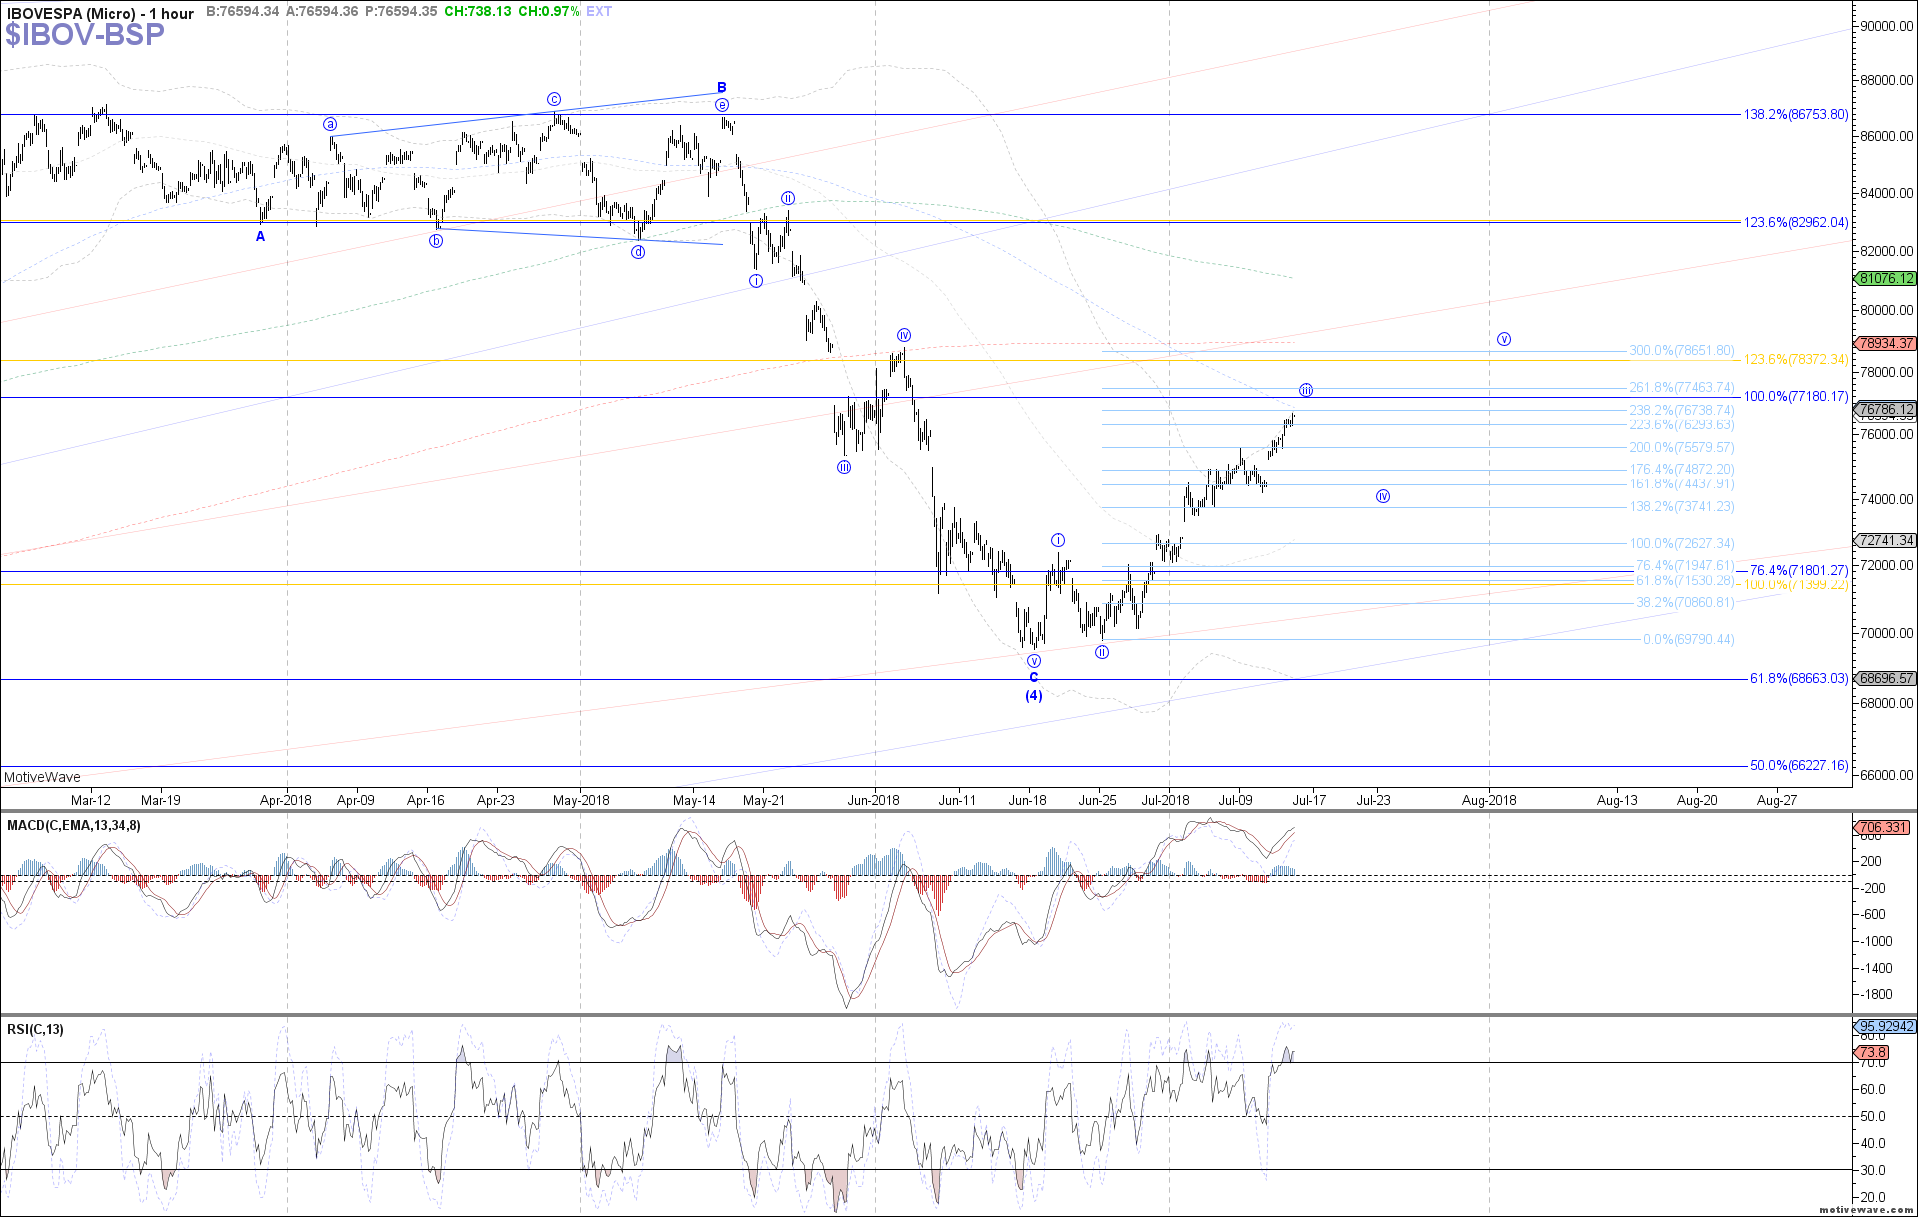
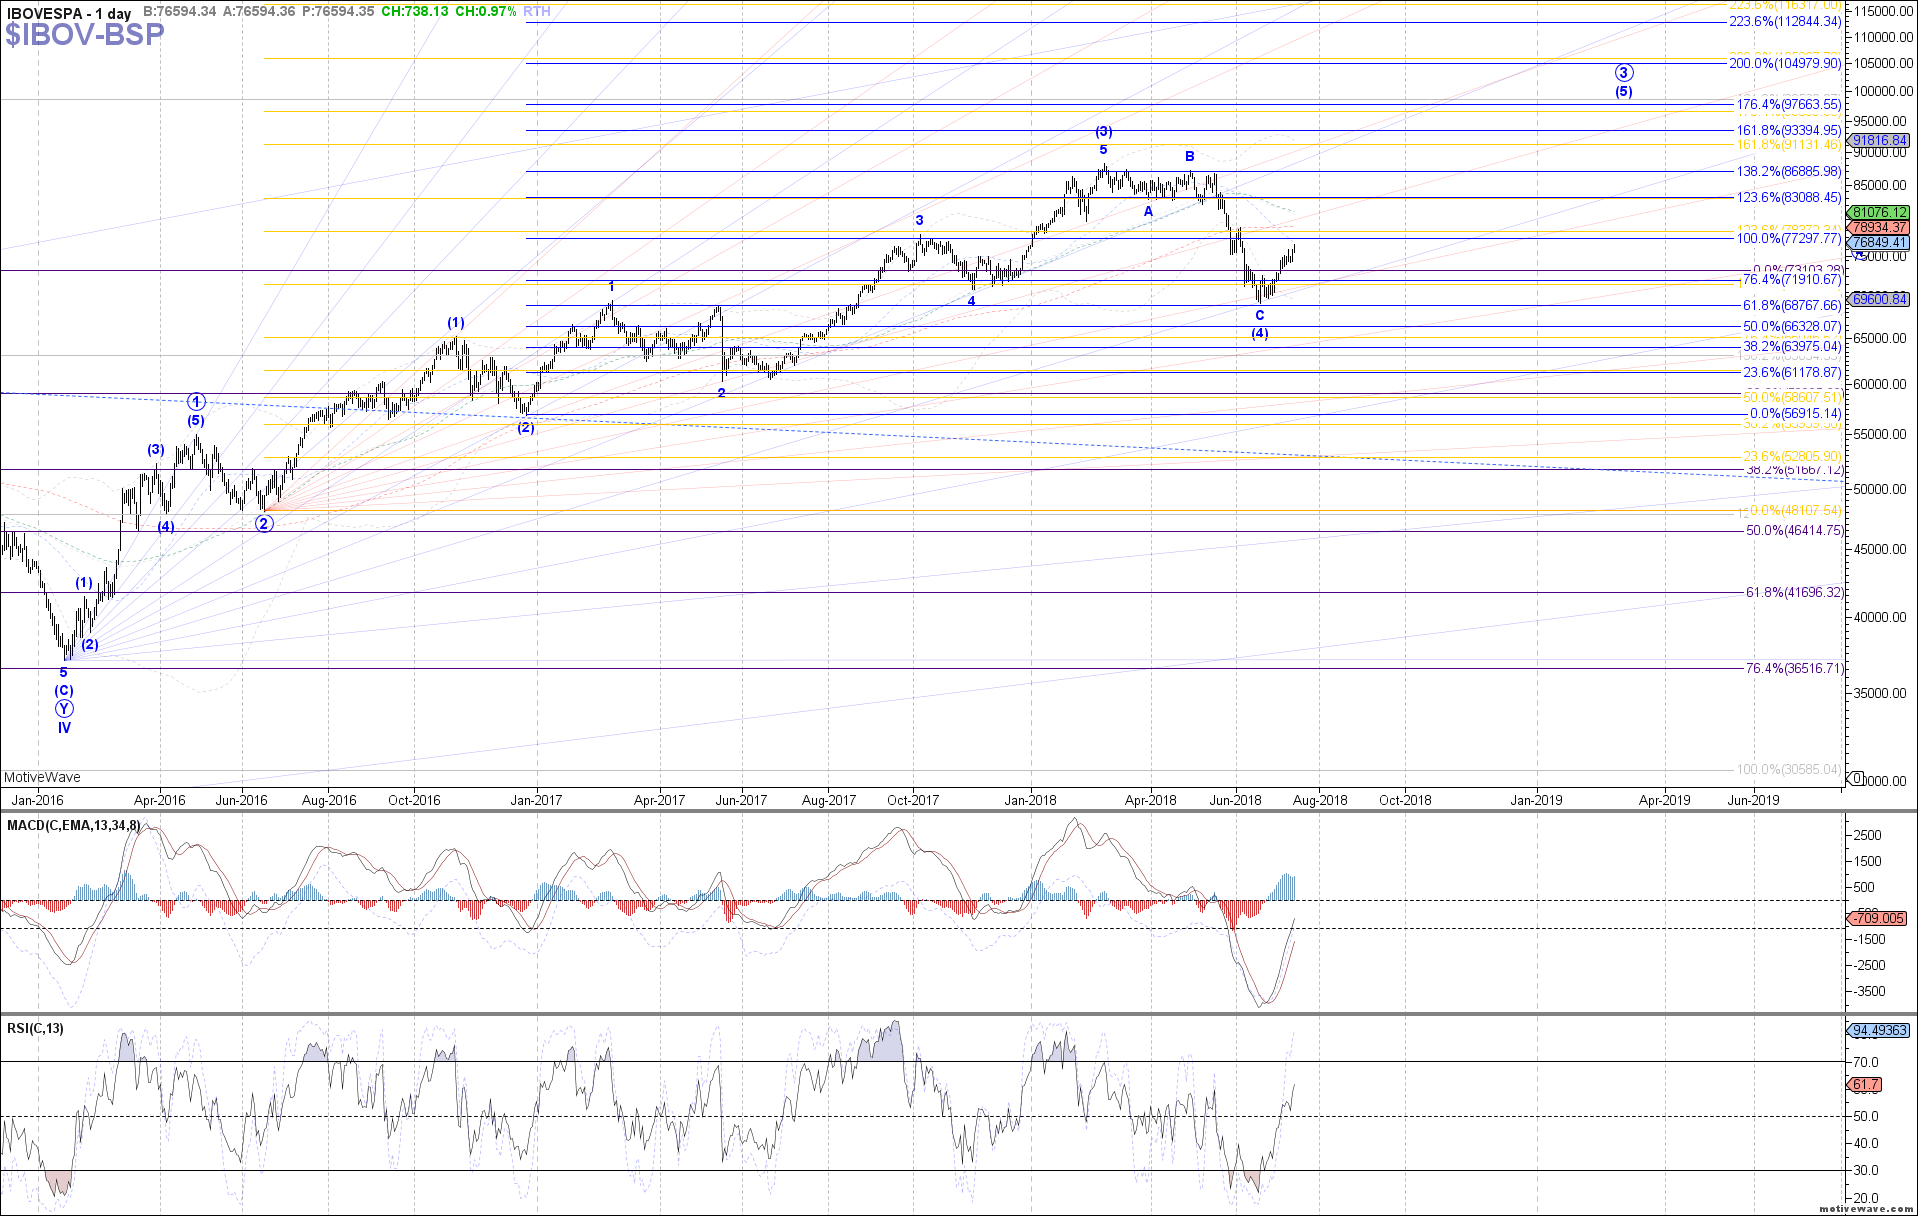
IBOV: The Ibovespa Brasil Sao Paulo Stock Exchange Index continued strongly higher last week, still stretching in what can easily count as wave iii of an impulse off the June low. If still wave iii, then a local top an near-term pullback as wave iv would still be expected soon, but with 74440 now as main fib support below. Otherwise, the alternative is that last week’s low was the wave iv already, in which case price is already close to completing 5 up as wave 1 of (5) and a slightly larger pullback can be see next as wave 2.
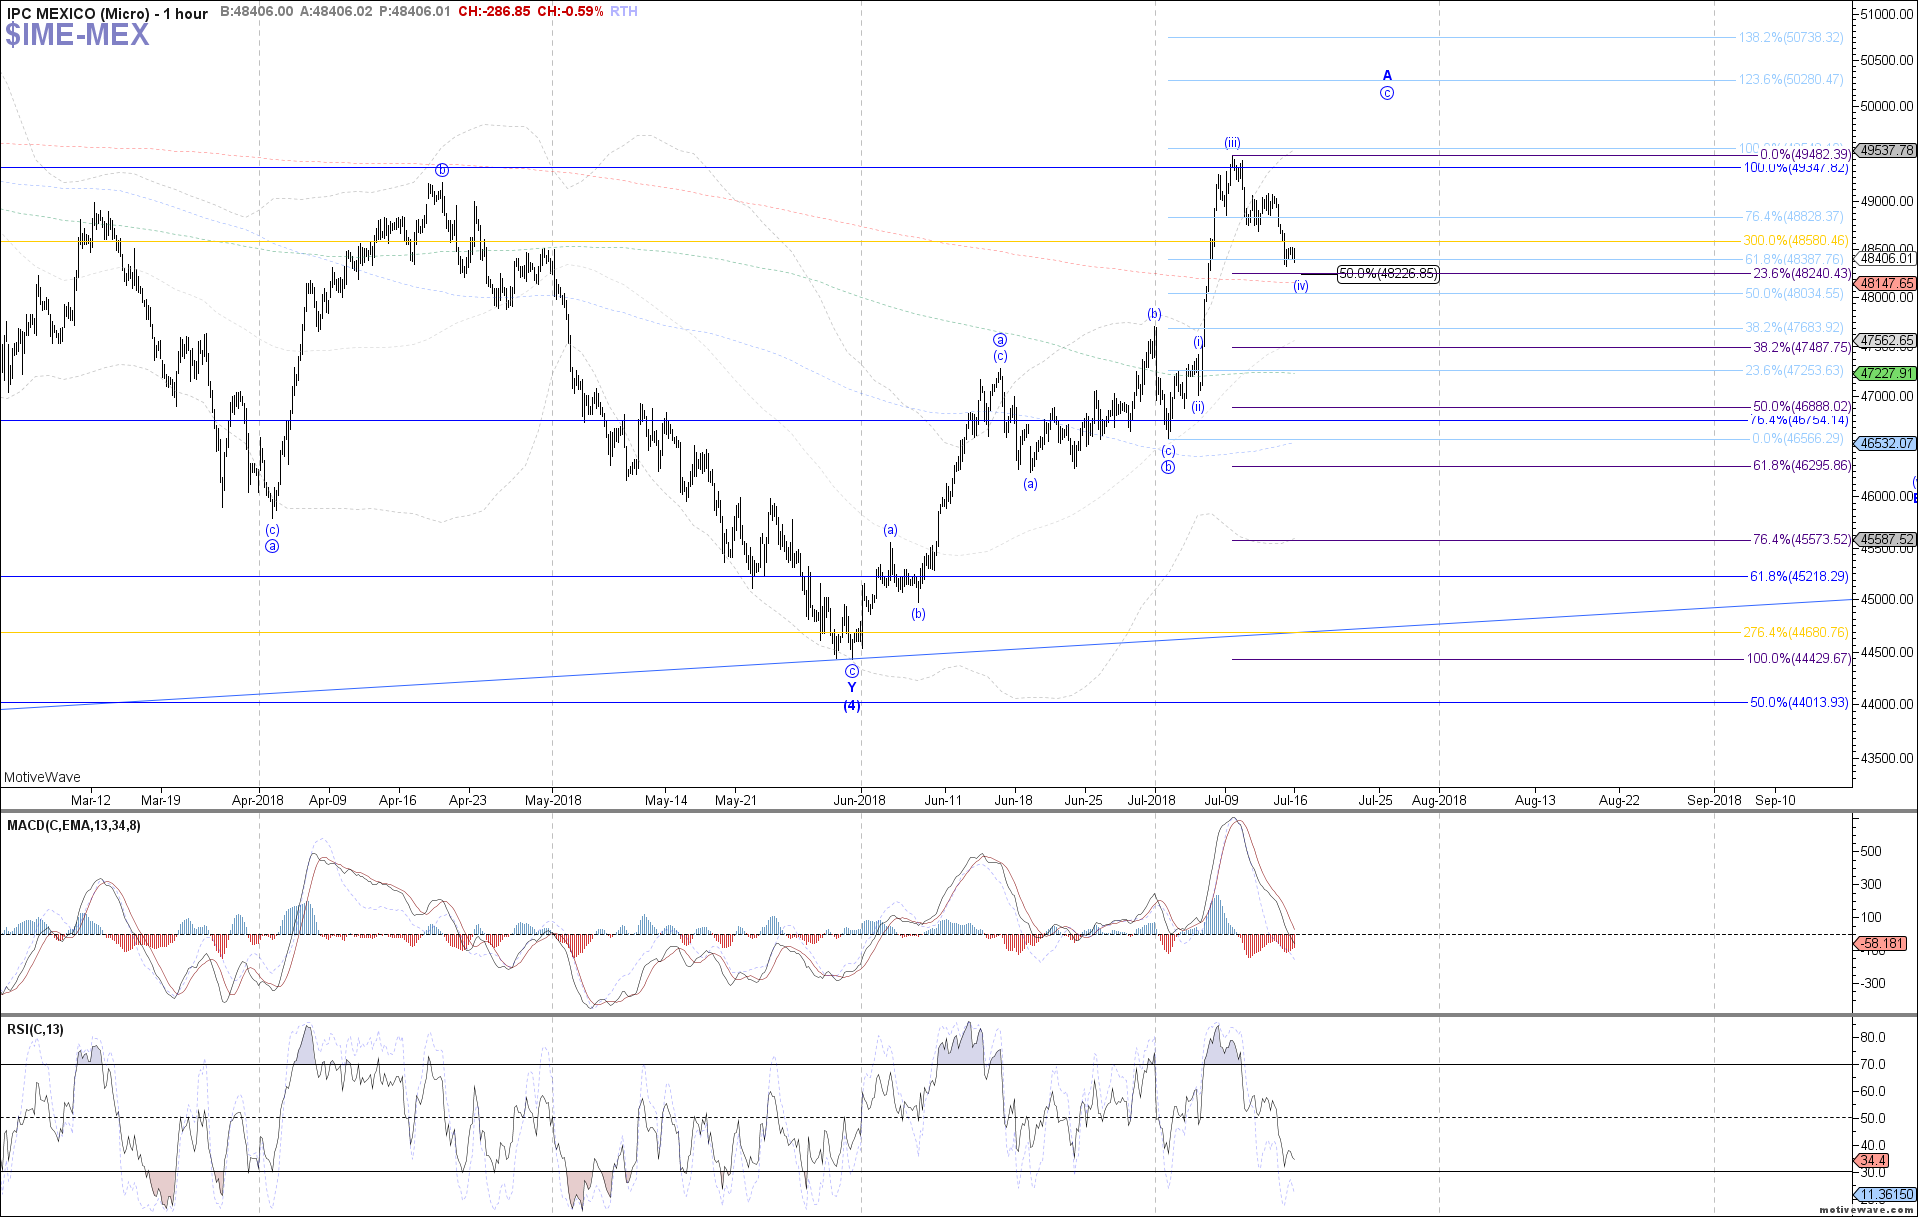
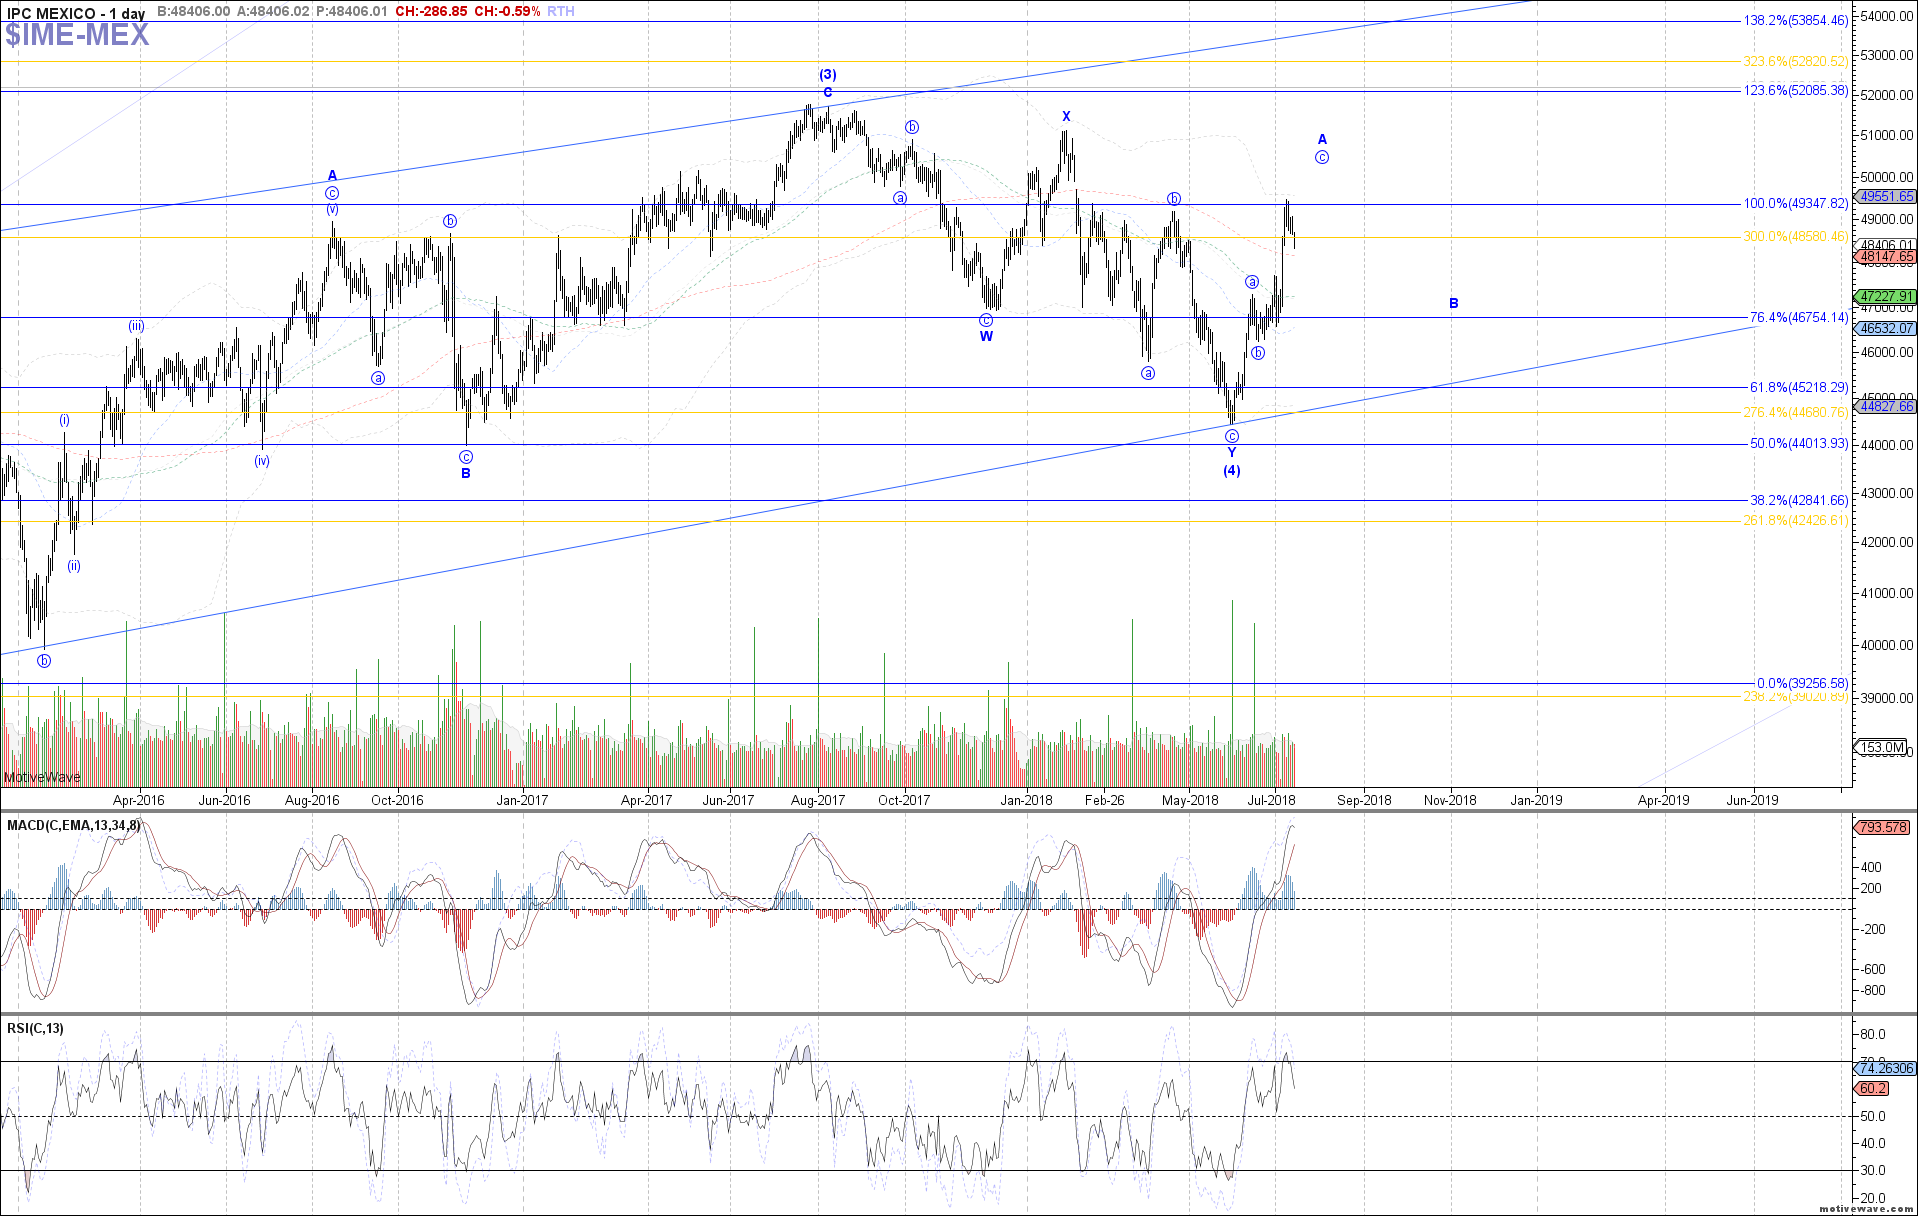
IPC: The IPC, the benchmark stock index of the Mexican Stock Exchange, or BMV, traded lower last week, pulling back as suggested in what can still count as wave (iv) of c. However, price is running out of room if that count is correct, with 48225 as the last level of support that should really hold as wave (iv) in order to see a new local high from here as wave (v) of c next. Otherwise, below there starts to suggest that all of the c-wave completed already, and price is pulling back as a higher degree B-wave already. 47485 – 46295 would be the support to watch then if that is the case.