Deep Dive on the Market Crash
 By
Lyn Alden
By
Lyn Alden
This past week has been one of the most historic weeks in global stock market history, on par in terms of volatility with 2008, 1987, or 1929.
Rather than do a deep dive on an individual stock as usual, this report’s deep dive will be on the whole macro situation along with several stock examples, due to the unprecedented market situation. Nobody has the full picture including me, and in this environment anything can happen, but a lot of the things we’ve been tracking for a couple years now, in my free newsletters and articles, and more recently in this premium research service, are coming home to roost and these are key turning points to see how they turn out.
The main surprise is that it’s all happening faster than expected, accelerated by the coronavirus and more specifically the quarantine response to it. There’s often a curve ball or black swan somewhere, and this time it was a virus.
Many pundits on CNBC and other media outlets seem to think that the economy was doing just fine before this hit, but that was not the case. Corporate profit growth was 0% in 2019, and excluding buybacks and tax cuts has been flat for several years before the involvement of trade wars or viruses. Most year-over-year economic indicators were pointing flat or down. Debt levels are near record highs, and the bottom half of the U.S. population is deeply financially insecure, more than they have been historically. The U.S. government deficit as a percentage of GDP has been rising dramatically since 2016; it’s supposed to shrink during a strong economy.
Europe and Japan are better or worse in some ways, with even higher total debt levels but more financially secure people in the lower income levels. Germany has had a government budget surplus from which it can now draw from. With emerging markets, it varies significantly depending on the specific nation. Some are financially stable, like Taiwan or Thailand, while others like Argentina, Indonesia, and Mexico are more troubled.
This situation will put the global financial system to the test in ways we saw coming, and in ways we won’t. For example, Thailand is in financially good shape with large financial reserves, but is heavily reliant on $60+ billion/year in tourism revenue, which is drying up from this virus more than it would in a normal recession. Many U.S. restaurants are in decent shape financially, but can they handle months with limited customers, in a far deeper restaurant sales decline than a normal recession? We’ll see.
The Systemic Debt Issue
The United States reached a peak total debt (public + private) at 380% of GDP in 2009. That was our all-time record high. More specifically, the U.S. entered that recession with a total debt/GDP ratio of a bit under 350%, and it grew to 380% during the process.
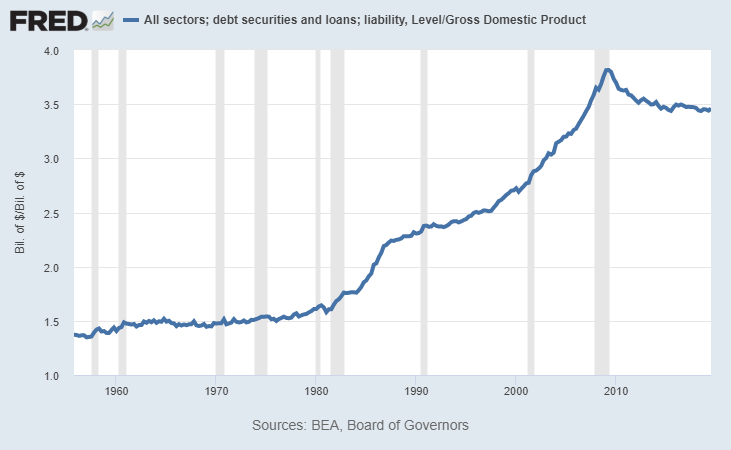
After a period of modest deleveraging, mainly in the housing sector, we’re currently back down to just under 350% debt to GDP. So, we’re entering this likely recession with a similar level of debt as 2007. Specifically, we have way higher government debt, as well as higher consumer credit and corporate debt, but lower mortgage debt compared to that time, as a percentage of GDP.
The third highest debt level ever reached was back in the Great Depression that started in 1929. In the early 1930’s at its peak, we reached 300% debt to GDP. It’s too far back to be on the St. Louis Fed chart above, but there are other data sources that recorded it. In fourth place was the 2001 recession, which was entered with about 275% debt to GDP.
Debt magnifies everything, and is a big variable for what makes some recessions worse than others. The Great Depression of 1929 and the Great Recession of 2008 were so severe in part because debt levels were so historically high.
Those two periods are “special” in terms of how rapidly the monetary base was expanded to deal with them compared to every other recession.
This is a chart of the U.S. monetary base in log form, so every move up is exponential and this makes it easier to see the differences between normal exponential growth and accelerated exponential growth. Those periods from 1930-1950 and 2008-present represent multi-fold increases in the monetary base in a short period of time, while every other recession on the chart looks normal. The zero bound on interest rates was hit in these two major periods, so they just printed money for stimulus instead, roughly speaking.
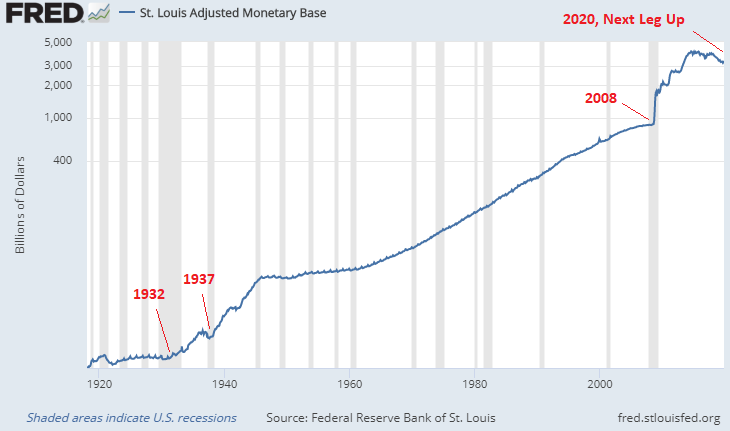
A few years after the initial 1929 crash, the U.S. devalued the dollar and began printing money from 1932 and onward to fund various programs. Then it slowed down, and in 1937 they encountered another recession, which was still within the larger context of the Great Depression period. So they turned on the printing presses again, and kept them on all through WW2.
We’re most likely about to mirror that period in the 2020’s in terms of monetary policy (hopefully without the war part). The Great Recession triggered several rounds of exponential monetary base expansion from 2008 to 2014, and then they stopped until 2019. During this next period, we’re about to have another big increase in the monetary base, similar to what happened in 1937. We already started in September 2019 when the repo spike happened and the Fed started monetizing Treasury bills, and it’s likely about to get amplified.
The Banking Sector
Back in 2008, banks themselves were undercapitalized, so they crashed harder than the broader economy. It’s the opposite this time; U.S. banks are quite well capitalized with plenty of reserves due to all the changes since 2008. However, the broader corporate sector is highly indebted and many industries will be hit by economic shutdowns (airlines, hotels, oil producers, restaurant chains, movie theaters, malls, concert venues, anything tourism related, etc).
Tons of businesses are already drawing on their revolving credit facilities from banks, meaning they are pulling extra cash from banks onto their balance sheets to deal with whatever comes next. Some obvious companies like Boeing and Hyatt are raising cash, but even companies with strong balance sheets and plenty of cash already like Micron (a big RAM/NAND semiconductor producer) are tapping into their facilities to maximize cash levels even further.
This puts a lot of pressure on the banking system. Just like how banks are not designed to hand out cash deposits to all of their customers at once, they are not designed to fulfill all of their client revolving credit facilities at once. The FRA/OIS spread, which is a measure of interbank liquidity, spiked this past week to levels not seen since 2008, meaning there is a serious liquidity problem.
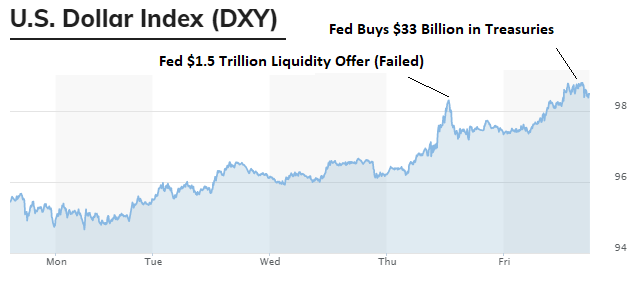
The Fed initially tried to address this liquidity problem, along with the liquidity problem that was happening in the Treasury market (which really is all part of the same issue) by announcing literally trillions of dollars in open repo lending lines going forward, which is the biggest ever such move, but that didn’t work at all. Banks only borrowed a small portion of that, roughly $100 billion, despite their rising liquidity problems. This seems to have to do with regulations; repo liquidity (which is borrowed rather than permanent) is not going to cut it.
The dollar index started to spike and was briefly relieved when the Fed announced that liquidity bazooka, but it was temporary relief for about a day as market participants realized that it didn’t work and that it never entered the system.
After that failed, the Fed outright bought $33 billion in Treasuries in one day on Friday, which served as a permanent liquidity injection, but only a small one compared to what is happening.
Here’s how the dollar index responded this week, pretty much down to the hour:
As I wrote the above content on Saturday and Sunday, the Federal Reserve just announced Sunday evening that they’ll cut interest rates to zero and initiate a massive $700 billion asset purchase program (“QE”). This will include $500 billion in Treasury purchases and $200 billion in mortgage-backed securities purchases. And it’ll be front-loaded; they’ll start with $40 billion all in one day on Monday. This is a pure permanent liquidity injection at a very large scale. In other words, they just dropped a $700 billion liquidity nuke, after their liquidity bazooka misfired last week.
This is shaping up to be the key moment that the dollar bulls and dollar bears have been debating over for years now, and I have an article about the global dollar shortage that provides context on the background for it. The dollar’s value relative to other major currencies sharply dropped during the stock market crash starting 3 weeks ago, but when this liquidity issue started to show up this past week and the Fed’s initial attempt to provide massive liquidity failed, the dollar began spiking back up.
Here’s a zoomed-out view of the dollar index in recent months:
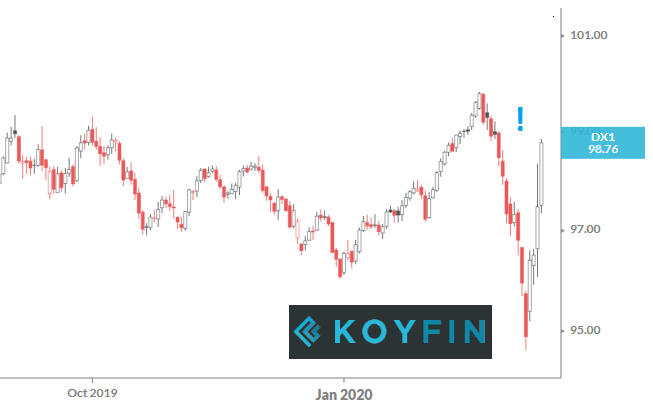
Towards the right of the chart there is a sharp deflationary crunch and an acute liquidity problem. That type of volatility between major currencies is highly unusual.
However, now that the Fed just announced a cut to zero and a massive asset purchase program, it should weigh on the dollar in the week ahead. On one hand there’s an acute liquidity shortage pushing the dollar up, and combating that is the Fed’s massive liquidity injection, and we’ll see which force is more powerful in the near term.
The Precious Metal Divergence
As I said in the previous report, volatility of this extreme level shakes the financial system down to its very foundations and tests securities across the board. In addition to stocks and corporate bonds selling off, safer havens like Treasury bonds and precious metals were hit this week, and several ETFs experienced record high dislocations, meaning that the difference between their market price and their net asset value (the sum value of all the stocks or assets they hold) reached a record large divide.
For example, suppose there is an ETF that holds one share of Apple and one share of Amazon for each share of the ETF. You would expect the ETF’s efficient market price to be equal to the sum of Apple and Amazon’s share prices (which is the net asset value), or at least within a penny or so. Ninety-nine percent of the time, that’s the case. During extreme market events, however, with Apple and Amazon shares rising or falling by double-digit percentage points every day, that divide between market price and net asset value can widen. That’s the type of thing that happened to several ETFs this week, except the ETFs have dozens or hundreds of positions rather than just two as in this example.
It appears that a number of risk parity funds had to unwind their positions. Risk parity funds invest in both stocks and bonds with heavy leverage. When stocks go down, bonds usually go up, which helps cushion the blow and keeps overall volatility low. This week, however, Treasury bond yields increased sharply, meaning that Treasury bond prices dropped sharply. The TLT 20+ year Treasury ETF, for example, dropped by nearly 15% from its sharp peak in just a few days:
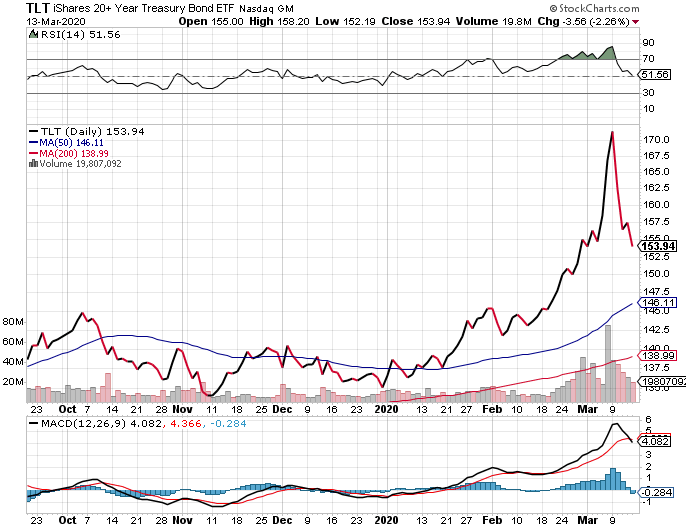
That’s not normal bond behavior. With Treasuries crashing so swiftly alongside stocks, leveraged funds holding stocks and bonds were in trouble and some probably liquidated, which results in indiscriminate selling.
With yields going back up while there’s a deflationary crunch, it can put downward pressure on gold and silver temporarily as well. Late last week, and especially on Friday, gold, silver, platinum, and in particular palladium all sold off sharply. It was one of the record high volatility days for the whole metals complex.
The move in the GDX gold miner’s ETF was particularly fascinating. It sold off so sharply on Thursday that it reached a -4% divergence from its net asset value, which was an all-time record. Then on Friday it broke that record by going to a -7% divergence from net asset value. Basically, there was so much indiscriminate selling pressure on GDX that market makers didn’t have time to arbitrage the discount to net asset value.
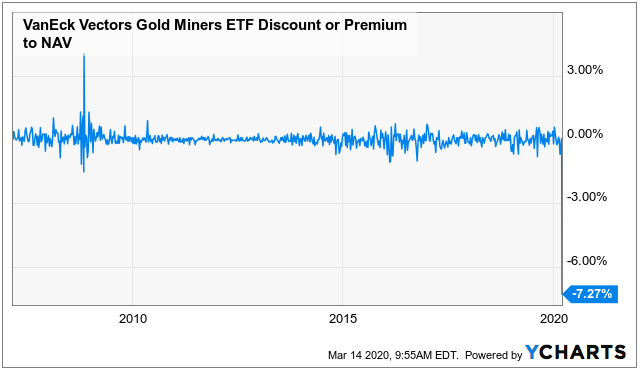
This means that GDX’s market price closed Friday at over 7% below the sum value of the shares of gold miners it holds.
President Trump gave a speech at around 3:30pm on Friday, where he declared a national emergency, which potentially opens the floodgates for federal bailout money to help states and businesses deal with the coronavirus shutdown. Stocks were already up for the day before then, but went sharply vertical upward during the speech to become one of the best S&P 500 days in market history. At the same time, gold miners went sharply down with ever-faster acceleration, before snapping furiously back up right into the final minutes of the trading day, and then were up sharply in after-hours trading.
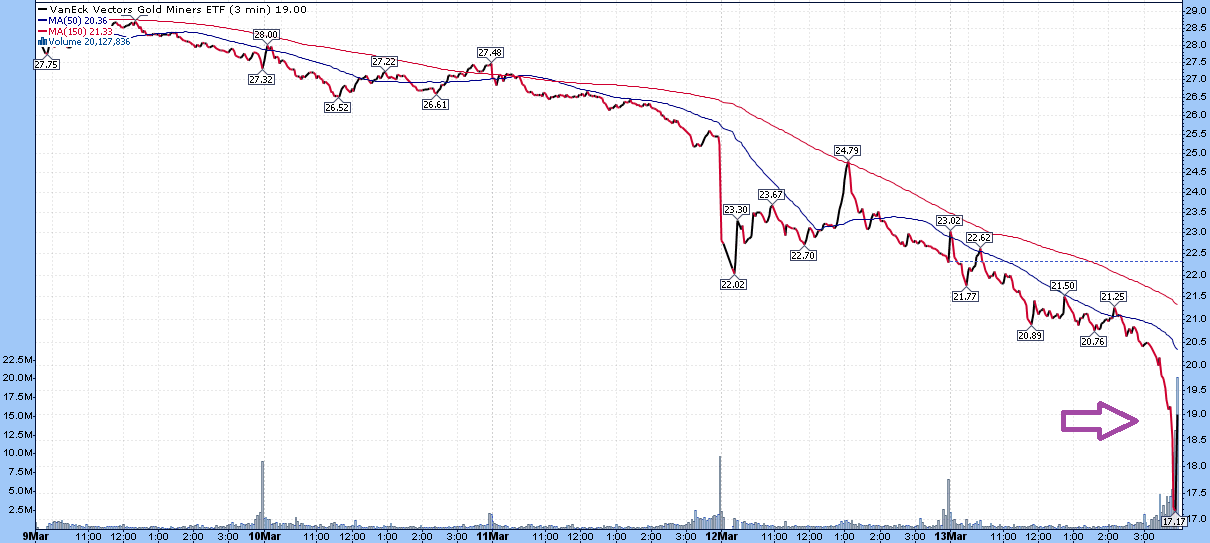
The last time that GDX had such a sharp sell-off was in 2008, shortly before it exploded higher. I don’t know what will happen going forward, but this has all the hallmarks of an indiscriminate selling liquidity crunch. Some big fund may have been long gold miners and short the S&P 500, and sharply unwound the position when the S&P 500 started to rally during the speech.
Whatever exactly happened, something big liquidated or squeezed or broke. I bought some GDX right at the bottom there and updated it in real time in the Google Drive, but it all happened so fast, within minutes.
What makes the sell-off in precious metals and miners even more interesting, was that at the same time it was happening, precious metal physical dealers were experiencing record physical metal buying. Large dealers like APMEX, JM Bullion, and many others put notices on their websites saying that due to extreme order volume, there would be long shipping delays, higher minimum orders, and so forth.
We wanted to provide our customers with important updates about our company, including a new temporary $299 minimum order, as well as the overall state of the industry. Over the last few weeks, we have seen record order volume, with yesterday being our largest sales day of all time. We are on pace for another record day today. As a business, we are doing everything we can to keep up, but with a 3-5x increase in order volume, we are unable to answer our phones and ship orders as quickly as usual. You can expect temporary shipping delays of 5-10+ business days while we scale up our operations to satisfy this unprecedented level of demand. -JM Bullion
The U.S. Mint sent out a note to its authorized dealers saying that they were out of stock on American silver eagle coins due to excessive sales volume:
This is to inform you that we have temporarily sold out of American Eagle silver eagle bullions. Our rate of sale in just the first part of March exceeds 300% of what was sold last month. West Point is working diligently to produce additional inventory and once additional inventory is produced, we will again begin allocations. -U.S. Mint
This divergence between the physical market and the paper market can only last for a finite time, and will resolve in one direction or the other. If it stays like this, it means there’s a shortage, and physical metals will start getting a wider premium over the paper price until the paper price responds. Precious metals prices in the paper (futures) market are under selling pressure during this time of deflationary shocks, liquidity shortages, and margin calls, but I think precious metals will be a good holding for the patient investor during the fiscal and monetary response to this deflationary/illiquidity event. The miners remain a more volatile holding, as this week clearly showed.
It’ll be interesting to see how gold and golds stocks open on Monday, given the huge Fed announcement Sunday evening about a cut to zero and massive QE. That’s historically been rocket fuel for gold prices. The futures market is pointing towards a positive open on Monday, but we’ll see.
Every asset class was tested in rarely-seen ways during the past two weeks. Stock markets around the world experienced some of the largest one-day drops ever. Corporate junk bonds and investment grade corporate and municipal bonds fell. U.S. Treasury bonds soared to record levels and then snapped back. Precious metals reacted similarly to Treasuries; rising initially and then sharply declining. Oil had its biggest one-day decline since the Gulf War, as Saudi Arabia and Russia launched an open price war by increasing supply during a period of weak oil demand.
Several Stock Examples
The market has let off a lot of steam. Bear markets are processes, with sharp drops, partial recoveries, secondary drops, secondary recoveries, and so forth. As of this writing, futures are pointing to a likely negative opening on Monday, but we’ll see.
Comparing the value of the U.S. stock market (Wilshire) to U.S. GDP and broad money supply, here’s the updated chart:
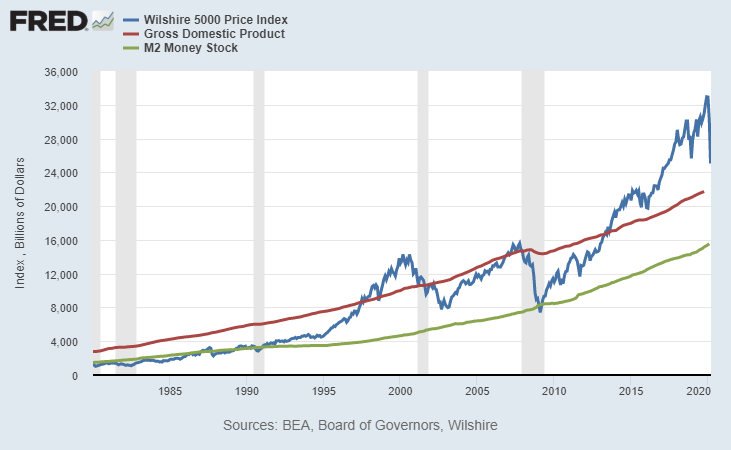
So on one hand we’re way less expensive than before. On the other hand, due in part to low interest rates and low corporate tax rates, the overall valuation of the stock market remains relatively high in proportion to the country’s GDP. The cyclically-adjusted price-to-earnings (CAPE) ration is at around 25x, which is also still on the more expensive side of the historical average.
China is starting to show some green shoots after a multi-month partial lockdown. South Korea and Singapore contained the virus well. Iran seems to have totally failed to contain it. These were the early countries.
It’s spreading rapidly in Europe and the United States; some of the later countries. Italy and France have now shut down most of their businesses and economic activities countrywide other than pharmacies, grocery stores, and banks. Most of Europe will probably shut down soon.
The virus is not tested for very much in emerging markets. Many of them have warmer climates, which helps slow the spread of the virus because it lasts far less long on surfaces in warm conditions. They also have a lower proportion of elderly people, who are most at risk. But they also have weaker healthcare systems.
Bill McBride from Calculated Risk has a chart showing how restaurant sales are declining rapidly in U.S. cities as things shut down here as well.
At this point, there’s plenty of areas to look for value, even though there’s still a good chance we haven’t seen “the bottom” yet. And investors have two main choices.
On one hand, investors can look for things that should be relatively immune to a coronavirus shutdown. These include healthcare stocks, several types of software stocks, consumer staples stocks, and things like that. This is the obvious choice, but then again, the stocks have fallen much less hard in these industries, so there is less value.
On the other hand, investors can look for bargain sectors that have been utterly ripped apart. Airlines, hotels, restaurants, casinos, commodity producers, and industries like that. Many of them are down 30-50% or more rather than just 10-30%. These ones have more risk, and are more pressured this year, but the ones that survive have potentially more explosive return potential on the way back up.
At this point, I wouldn’t put too much money into any one sector, and we need to see more details for how this will play out. Several stocks in the higher risk category are on my watch list for potential addition. I think restaurants with strong balance sheets and the highest-quality oil producers could be very interesting on the other side of this. Stocks that are too risky, like cruiseliners or anything with too much exposure to U.S. shale oil production, I’ve pruned away for now.
There is a nonzero chance that some countries including the United States could temporarily shut down stock markets for a week or two, like they did after the 9/11 terrorist attack. With so many people working from home, including finance professionals, and with such high volatility, don’t count 100% on markets remaining open. I’m not saying it will happen, but it certainly could happen. That means whatever you own, make sure you are comfortable to own it through a stock market shutdown. During such a shutdown, if it happens, there could be very large changes to fiscal or monetary policy that suddenly reprices certain assets when the markets open, while news will continue to pour out, good or bad, about the coronavirus and its affects on businesses.
With that in mind, let’s look at a few example companies to see how different industries are doing in descending order.
Adobe
Software vendor Adobe’s stock is like, “Coronavirus? What coronavirus?”
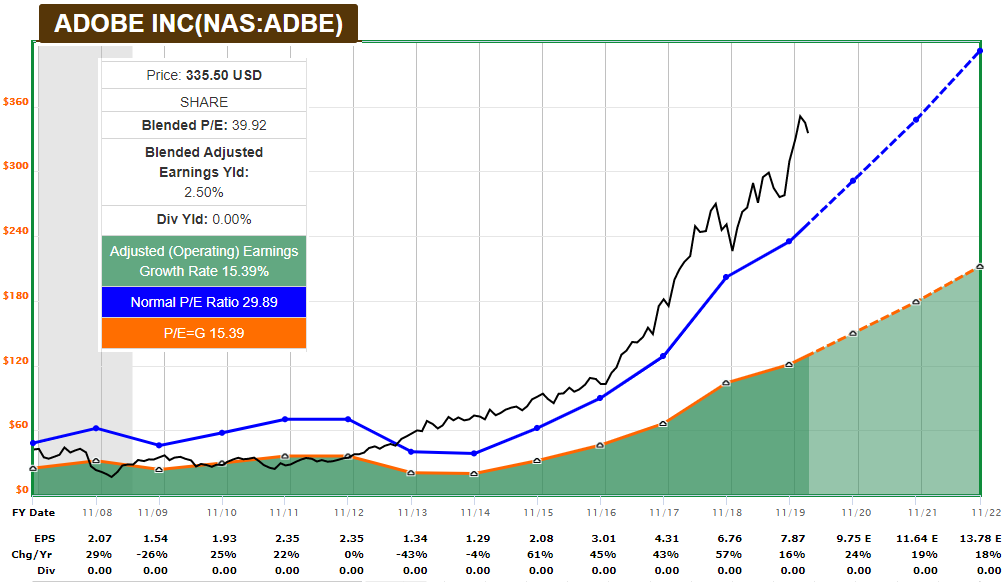
Chart Source: F.A.S.T. Graphs
The blended adjusted P/E ratio is about 40, which still puts the PEG ratio at around 2x. It’s a great company, and we have a slice of it in the growth section of the M1 Newsletter portfolio. But it remains expensive; not a lot has changed here. I’m not thrilled to buy heavily into it at this level.
Johnson and Johnson
Similar to Adobe, Johnson and Johnson barely acknowledges the existence of the coronavirus, and just uses it to let off some steam and get a little bit more reasonable for valuation.
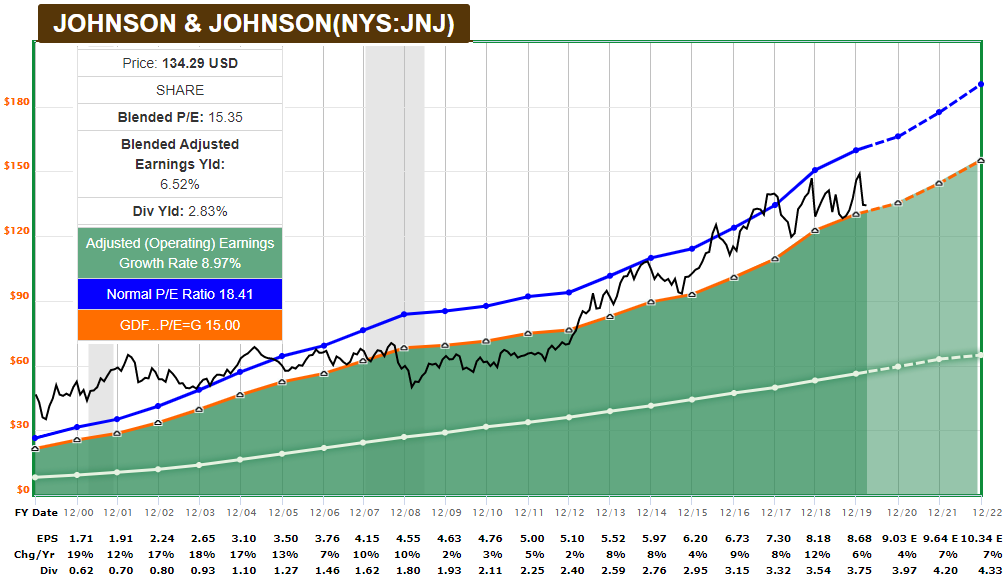
Chart Source: F.A.S.T. Graphs
JNJ has a great balance sheet and noncyclical products, and is neither particularly undervalued or overvalued.
Unilever
Unlike Adobe and Johnson and Johnson, Unilever’s stock cares that the coronavirus exists, but doesn’t care as much as the broader market because it knows people will still buy ice cream and deodorant to use while they sit at home.
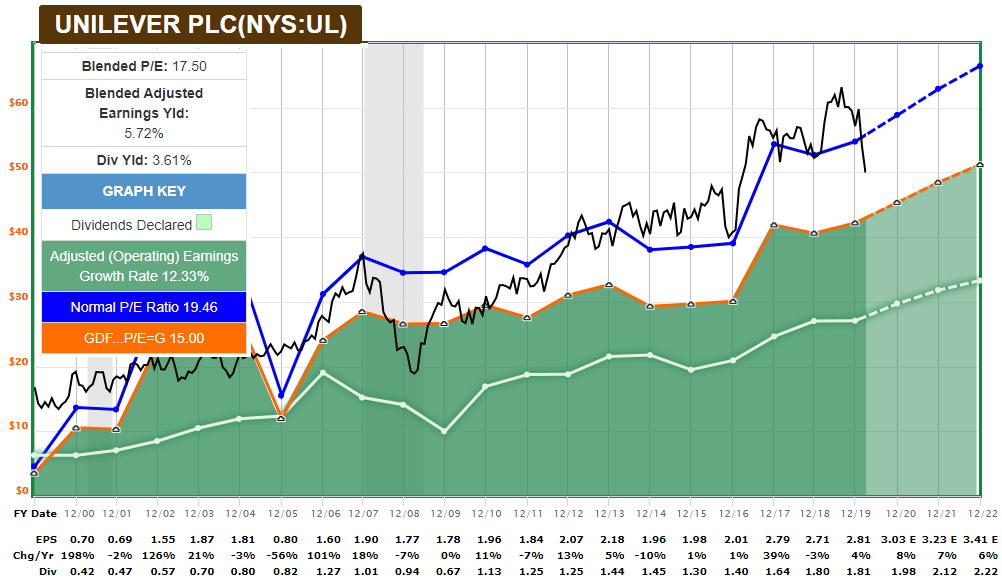
Chart Source: F.A.S.T. Graphs
Unilever has a solid balance sheet, globally diverse geographical exposure (almost 60% of sales from emerging markets), and is down 15% from about $60 to $50 very quickly. The dividend-adjusted PEG ratio is a bit below 2x. Not bad.
Tractor Supply
Tractor Supply’s stock is similar to Unilever, in that it acknowledges that the coronavirus exists. It also has a nice balance sheet, and knows people still need livestock products and stuff for their ranch. In fact if you’re stuck at home, it’s a good time to do some things around your property that you’ve been putting off for a while.
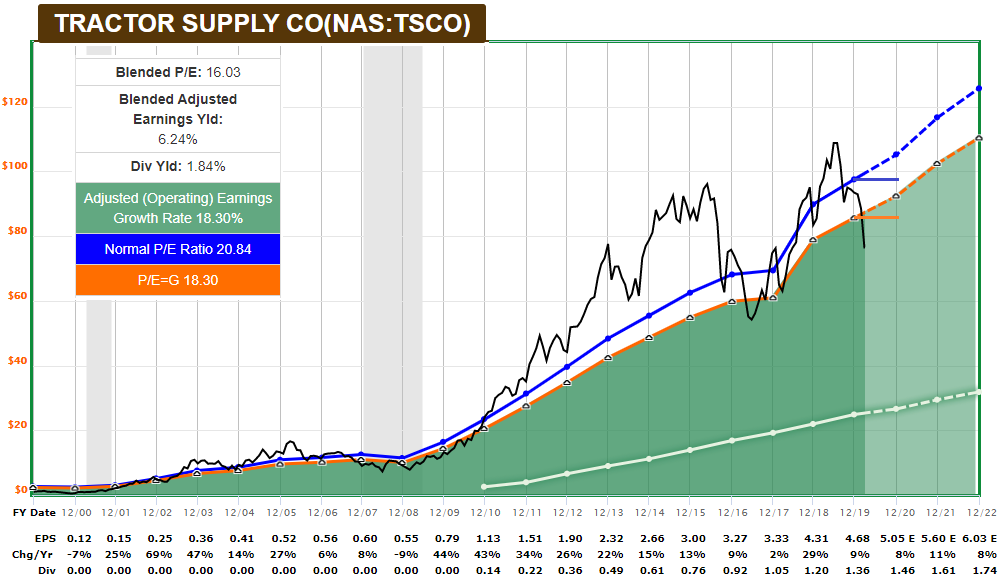
Chart Source: F.A.S.T. Graphs
It broke below $80/share like I said it might during a severe bear market. But overall, it’s in nice shape. I drew some extra blue and orange lines on the chart above to give an idea of how the company’s fundamentals typically responds during recessions, because analysts still haven’t updated their forward projections. It should see some reduced sales, and maybe have to cut prices a bit, in a normal recession. During quarantine periods it could be forced to shut entirely, if the U.S. goes down the route of Italy and some other countries.
American Express
American Express’ stock is more concerned. It knows that it’s fine on its own with plenty of reserves and good risk management practices compared to other credit card companies, but that a recession is probably here and people will spend less and default more.
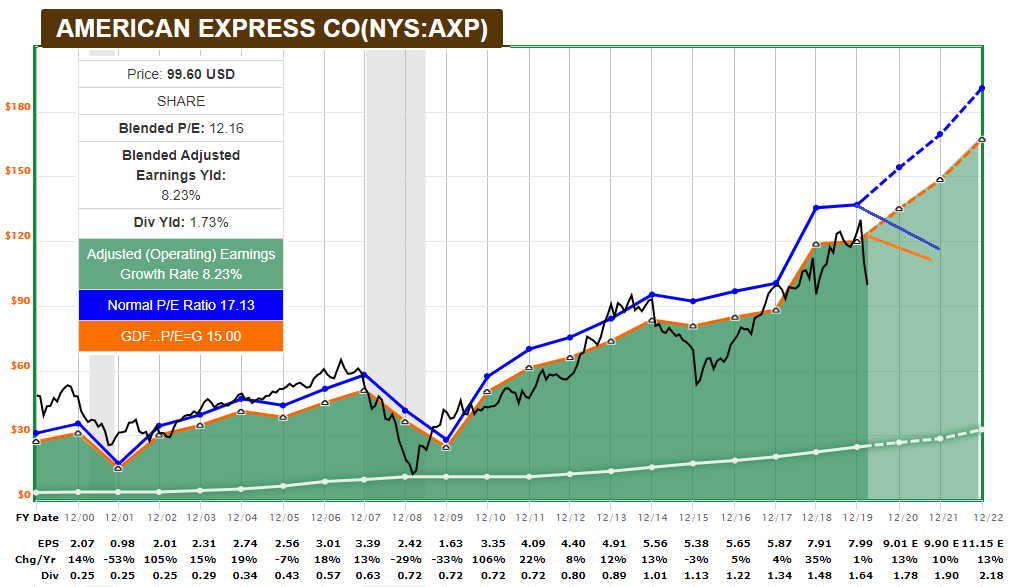
Chart Source: F.A.S.T. Graphs
AXP has several business customers as well, and many of them will be negatively impacted. The chart above is long-term and doesn’t show daily movements, but the stock went as low as $83 on Thursday and shot up almost 20% on Friday, back to $99, which is still down from its $130+ high.
Now, the company is likely going to take a financial hit, at least in line with other recessions. I updated the chart above to give a general sense of direction. The question is how big and for how long.
Darden Restaurants
Darden stock, which operates a diverse set of restaurant chains including Longhorn Steakhouse and Olive Garden, is truly frightened. It wonders how long its restaurants need to be shut down for. Although it is up a bit from Thursday’s level, the stock lost about 50% of its value very quickly.
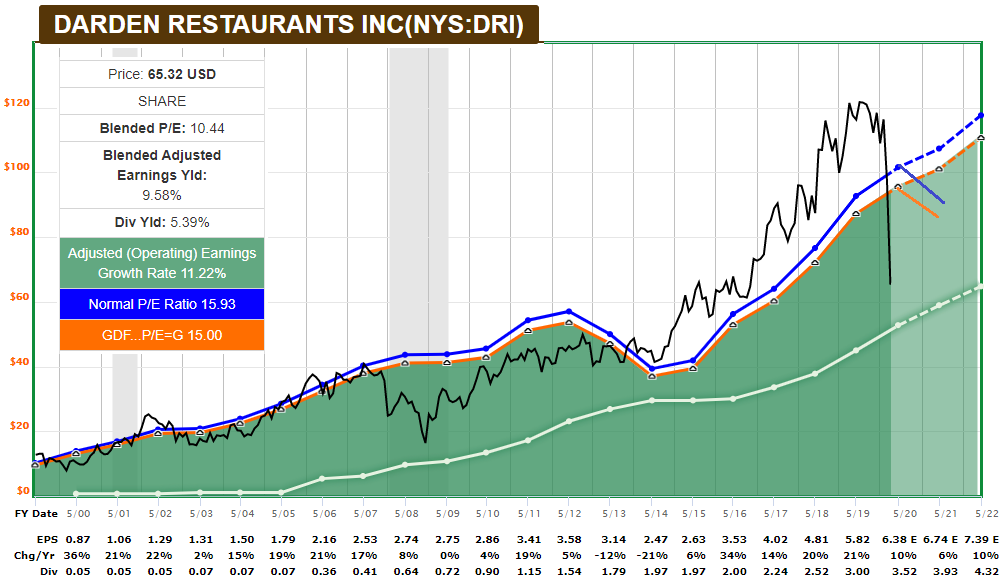
Chart Source: F.A.S.T. Graphs
The dividend yield is over 5% at this low valuation, but the dividend is not necessarily safe if the company needs to retain cash.
Usually, Darden and other restaurant chains are moderately recession resistant. They see a slowdown, but nothing major or existential. This one’s a bit different, especially if you look at that chart I linked to earlier showing a collapse in restaurant traffic in several major cities. I edited the chart with new orange/blue lines to show that the previous estimates are no longer valid, but really we won’t have much of a clue for how big the impact will be until we have more clarity on how long this nationwide semi-quarantine will last for. Will it be one really terrible quarter, and then a relatively modest year? If so, that’s not so bad. Or will it drag on for quarters?
This one is a contrarian candidate for adding to my portfolios. I already have one restaurant stock, Cheesecake Factory, but in these conditions as a value investor, I’m seriously looking at adding another, but not quite yet.
The key thing, though, is that the company in question needs to be able to get through the slowdown, which I believe Cheesecake Factory and Darden both can as long as they have access to bank liquidity, which they do. I’ve analyzed Cheesecake Factory before, so let’s focus on Darden for a moment.
Darden has a nice balance sheet. With about $800 million in net debt, their debt/income ratio is only a little bit above 1. Their $4+ billion in capital leases could be an issue, even though it wouldn’t be an issue in a normal recession. Federal measures to provide temporary relief for businesses and workers in the hospitality/tourism/restaurant/airline sectors may further help soften the blow, but things like that are unclear at the moment.
A problem is that Darden entered this quarter with $340 million in accounts payable and just $157 million in cash on hand. However, they have an unused $750 million revolving credit facility that they can draw from, for problems just like this. So, they should have plenty of liquidity for a couple terrible quarters.
Their quarterly expense breakdown looks like this, from their 10-Q filing:
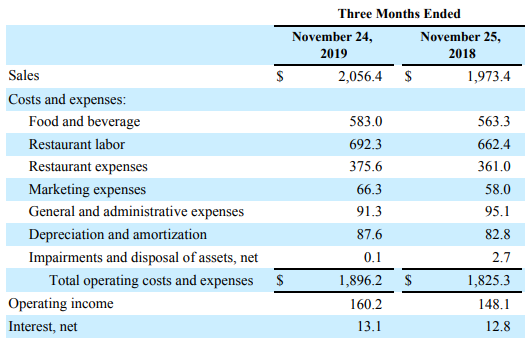
In a shutdown, they’ll sharply cut expenses for food and beverages and likely cut down on marketing. Although the company recently launched paid sick leave (1 hour of sick leave for every 30 hours worked), they’ll also inevitably cut a lot of their labor costs. Restaurant expenses may decrease a bit but some are fixed. Interest payments are fixed, but small each quarter. Depreciation and amortization are non-cash items. So there is a lot of flexibility here, even though they’ll take a big hit if this goes on for more than a quarter.
Conservative investors should probably wait for some signs of slowdown in the coronavirus spread here in the United States and talk of re-opening things before investing in something like Darden. By then, the bottom for the stock may very well be in, but there will be less downside risk. Aggressive investors may find it interesting to start forming a small position within the context of a well-diversified portfolio, if you start with the assumption that by the end of this, most restaurants won’t be bankrupt. For now, I’m watching and analyzing.
