Deep Dive: Macro Update and Value Stock Review
 By
Lyn Alden
By
Lyn Alden
The macro section of this report provides an update on the US business cycle, US monetary policy, and international markets.
The digital assets section is brief this time, with a focus on recent news around the Lightning network.
The equity section looks at recent stock market performance, and then re-emphasizes energy pipelines and other conservative investments that I’ve been pounding the table on for a while now.
Macro View
The past couple weeks have been decent for US economic performance, but rough for most risk assets due to tightening monetary policy as the Fed tries to cool inflation via demand reduction.
US Business Cycle
After two negative quarters of real growth, it is increasingly looking like this current third quarter that we are in now, will be positive. There has been somewhat of a dry spell of good news in macroeconomics, so this is a welcome sight:
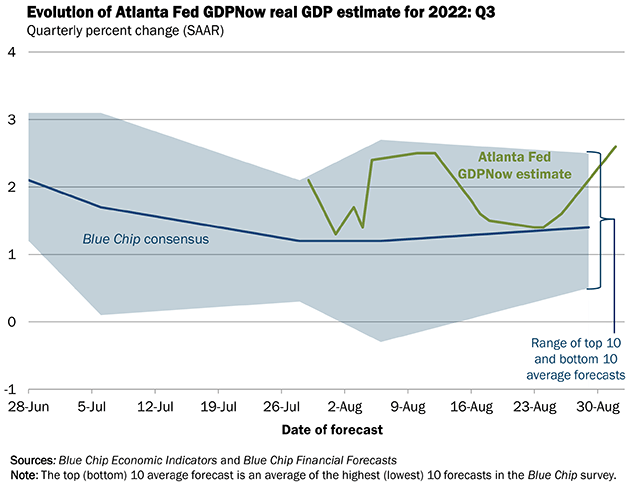
Chart Source: Atlanta Fed
However, the leading data for Q4 doesn’t look great. The purchasing manager’s index stabilized for the past month, but continues to have a downtrend:
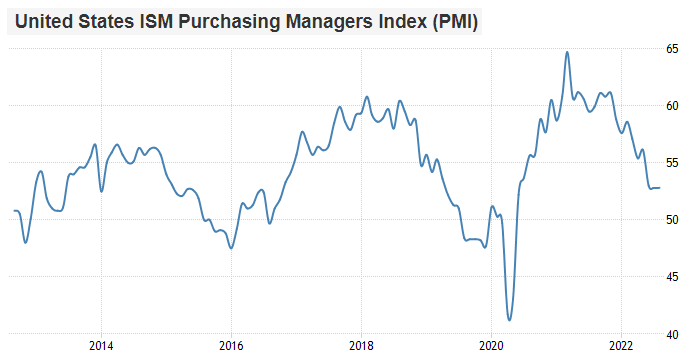
Chart Source: Trading Economics
It’s pretty rare for the PMI to turn back up without an easing of monetary conditions. A pause in rate hikes, or a rate cut, or a round of QE, or some currency intervention to weaken the dollar index, tends to occur around those low points to kick up the next mini-cycle. Currently, the Fed continues to tighten monetary policy into the slowdown, with an expected 50-75 basis point rate hike this month and ongoing balance sheet reduction or “QT”. That makes it pretty hard to envision a persistent turnaround in PMI any time soon.
On the fiscal side, student loan forgiveness does represent some stimulus, however. It’s not very fast-acting but instead is a type of drawn-out stimulus. It is offset by the fact that student loan moratoriums already meant that many people were not paying their student loan bills. So, this loan forgiveness mostly means that as moratoriums end, payments will be lower than they otherwise would have been.
The reduction in gasoline prices since June has been helpful for people. Gasoline consumption in spring/summer 2022 has been below the same months’ consumption levels for 2021, indicating some degree of demand destruction as prices reached untenable levels for financially-strained households.
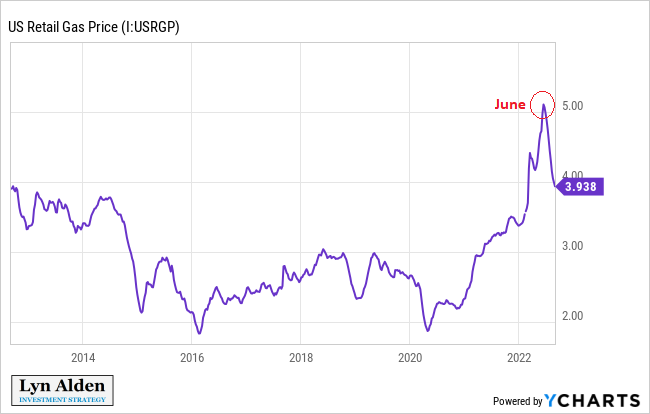
Chart Source: YCharts
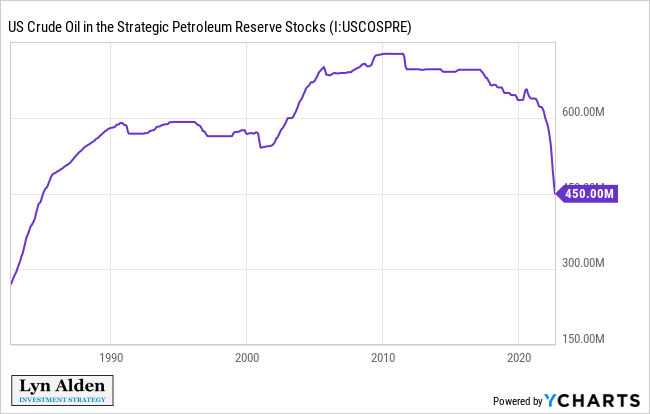
The US government continues to rapidly draw down its Strategic Petroleum Reserve in order to take the edge off crude oil prices. Meanwhile, refiners have been running near full capacity to churn out as much gasoline as possible. It’s a fragile mix at the moment especially given what’s going on over in Europe, but it is taking the edge off prices for now, and that puts more money in peoples’ pockets for other spending.
Similar to the purchasing manager’s index, the ECRI Weekly Leading Index stabilized recently, but continues to be in a downtrend:
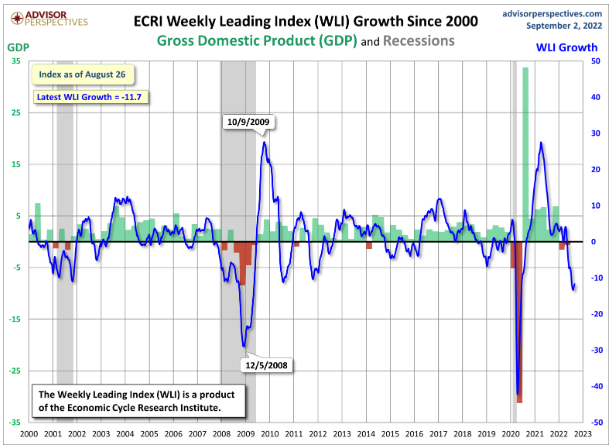
Chart Source: Advisor Perspectives
Lakshman Achuthan, co-founder of ECRI and an expert on business cycles, had a good interview on Macro Voices this past week where he re-iterated a bearish base case, determined from the ongoing leading data in front of him. He doesn’t see any sort of persistent upturn coming in the leading indicators that he tracks.
The labor market is stable for the moment. Initial jobless claims were rising from March to July, but in August they have been flat-to-down which is good.
Friday’s nonfarm payroll report was mixed, with an uptick in jobs and the labor participation rate. However, the unemployment rate inched up from 3.5% to 3.7%.
Overall, I view this economic environment as likely being in the eye of a hurricane, albeit hopefully less dramatic than the visual that the analogy would suggest. We had two negative quarters of growth, are currently having an uptick in growth as conditions eased a bit (the “eye”), but forward-looking data suggests further weakness in Q4, especially with no change in tactics from the Fed.
Monetary Policy Update
Federal Reserve Chairman Jerome Powell gave a very short and direct speech at the annual Jackson Hole Economic Symposium on August 26th.
In the speech, he reiterated his goal of getting inflation back down to 2%, and made multiple references to former Fed Chairman Paul Volcker and the era of tight monetary policy that was needed to keep inflation under control after multiple failed attempts in the 1970s. The market perceived it as a re-assertion of a hawkish approach.
The 2-year Treasury yield rallied in the week following the speech, reaching a 15-year high of 3.5%. It corrected back down a bit on Friday upon release of the mixed nonfarm payroll report. The 2-year Treasury yield is often a good proxy for what the Fed will do with their short-term interest rates in the following quarters.
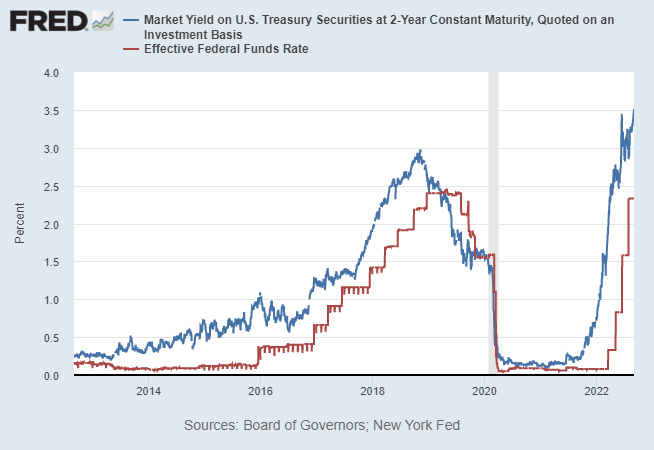
Chart Source: St. Louis Fed
The various yield curves have been steepening slightly, which makes sense considering the positive economic stabilization that we’ve seen in August.
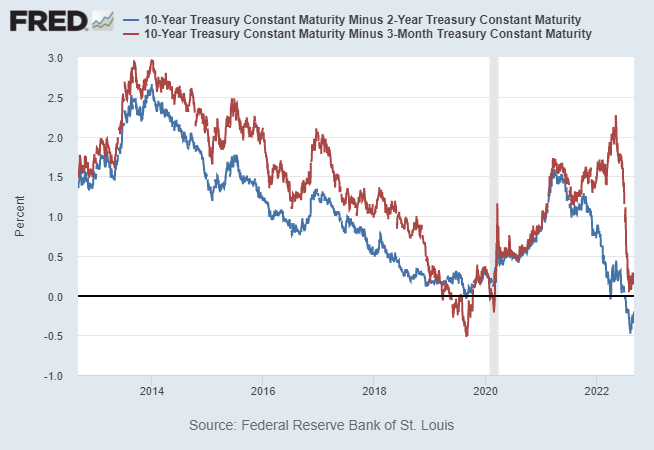
Chart Source: St. Louis Fed
While Powell is to be believed in the intermediate-term, that hawkish approach gets pretty hard to maintain when we look out farther. As I pointed out in my recent August public newsletter, it’s pretty hard to have structurally positive real yields when total debt to GDP is 370%, with trillion-dollar annual fiscal deficits for the foreseeable future (which were conditions that Volcker never had to deal with as Fed Chairman in the late 1970s).
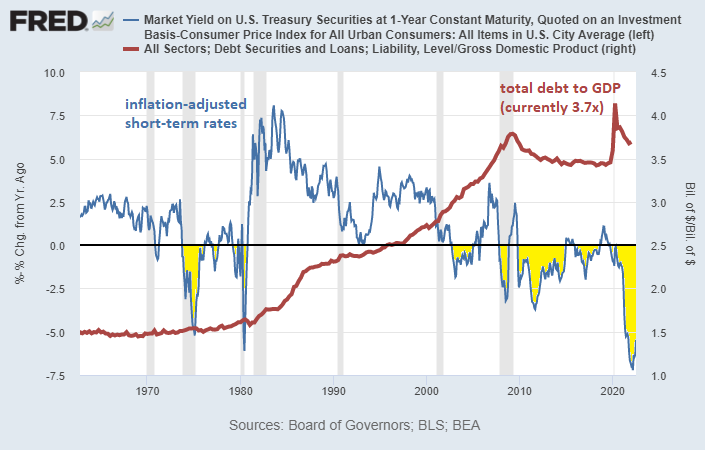
Chart Source: St. Louis Fed
Usually when the dollar is rising sharply, the foreign sector doesn’t buy much Treasuries. They end up being in defense mode, and even consider selling assets to defend their currencies, rather than printing money to buy more Treasuries. Indeed, based on data from the Treasury Department, the foreign sector holds slightly fewer Treasuries than a year ago.
US commercial banks were strong buyers of Treasuries up until February 2022. Since then, they stopped buying.
The Treasury Department had very strong tax receipts in the first half of 2022 thanks to the economic recovery and strong stock market performance of 2021. However, tax receipts are quite correlated to the stock market, and that suggests weaker tax receipts in the quarters ahead:
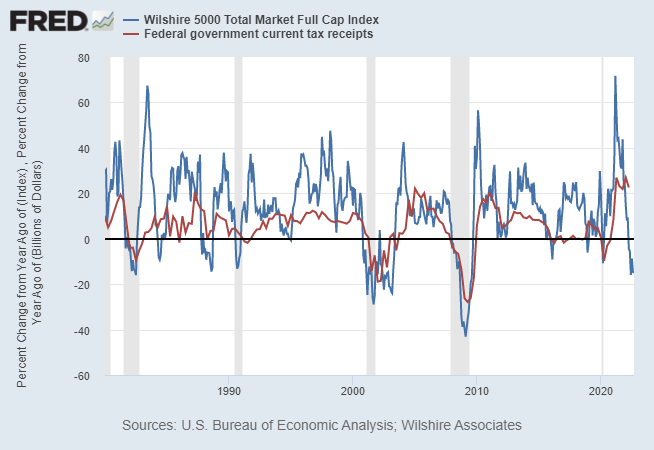
Chart Source: St. Louis Fed
Due to those strong tax receipts, the Treasury hardly had to issue any net Treasuries during spring and early summer of this year. However now they are back towards issuing more Treasuries, and had to moderately revise upward their net Treasury issuance expectations going forward. The cost of living adjustment for Social Security outlays will likely be in the high single digits for 2023 when it is announced this autumn.
So, the Fed is letting Treasuries mature off of its balance sheet with quantitative tightening, the foreign sector isn’t buying Treasuries because the dollar is so strong, banks are on a buyer’s strike for the moment as well, and tax receipts are likely to weaken which increases Treasury issuance to cover a wider deficit, all else being equal. That’s a pretty toxic mix, and the question becomes, “who is going to buy the net Treasury issuance going forward?”
That’s the challenge; it’s one thing for the Fed to provide a long-term hawkish outlook of “tighter for longer”, but that stance can only be maintained as long as the Treasury market is liquid and functioning properly, with adequate buyers. This is something I’m watching, since I have concerns that they will run into more acute Treasury market liquidity problems sometime in 2023 if they stick with the hiking and QT plan, unless more buyers emerge or the dollar cools off its recent rise.
The Treasury Department could issue more bills and fewer notes and bonds to soak up the reverse repo money. The Fed could adjust SLR requirements for commercial banks to let them buy more Treasuries (although that would be a type of monetary easing). There are some levers like this that they can pull if they start running into liquidity issues in the Treasury market.
Overall, I continue to view the US as being in a disinflationary period, but within a likely longer-lasting inflationary structure. My base case is that some of the inflation from energy shortages and frictions in globalization will be a recurring problem in the years ahead, until the world heavily invests in another big commodity and infrastructure cycle to address those shortages and changes. We’ve had inflation, but we’ve not really had a supply-side response to that inflation yet, and that takes time.
International Report: NIIP
A country’s net international investment position or “NIIP” is a measure of how many foreign financial assets that entities in the country own vs how much of their country’s financial assets that other countries’ entities own. This includes both the public sector and the private sector.
If a country runs persistent trade surpluses, it has to do something with that money. For example, if China runs big trade surpluses against the United States, they’ll collect trillions of dollars over time, and can use those dollars to buy US financial assets. This could be in the form of the country’s central bank or sovereign wealth fund buying financial assets (Treasuries, corporate bonds, equities, etc) or for example it could be individual Chinese companies and Chinese people buying US real estate or US equities in some other way.
Or, China could take those dollars and buy other non-US foreign assets, or make loans to them (e.g. infrastructure loans that get converted to ownership of the asset if the loan is defaulted on).
This table shows several major countries net international investment positions as a percentage of their GDP:
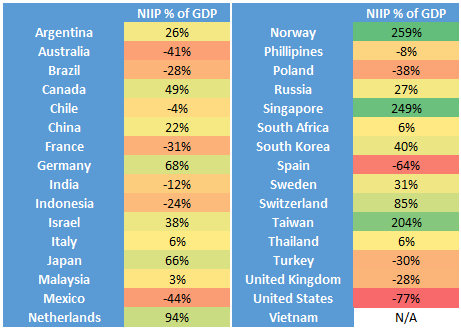
Data Source: IMF, World Bank
In absolute terms, China (when including Hong Kong) and Japan are the biggest creditor nations in the world, while the US is the biggest debtor nation in the world.
In percentage of GDP terms, Norway, Singapore, and Taiwan are the biggest creditor nations, while the US is still at the bottom of this country list. There are some developing countries that have lower NIIPs as a % of GDP than the US that are not on my list, but for the most part the only developed countries that have very low NIIPs like the US are Greece, Ireland, and Spain.
The US used to be the world’s biggest absolute creditor nation. It was eventually replaced by Japan as the biggest, and by the 1980s the US switched over to a debtor nation. Since then, it has been a striking decline into the biggest debtor nation in the world based on this metric.
This is a chart from Ray Dalio that I’ve crudely updated in 2021 and now in 2022 just for the historical visual:
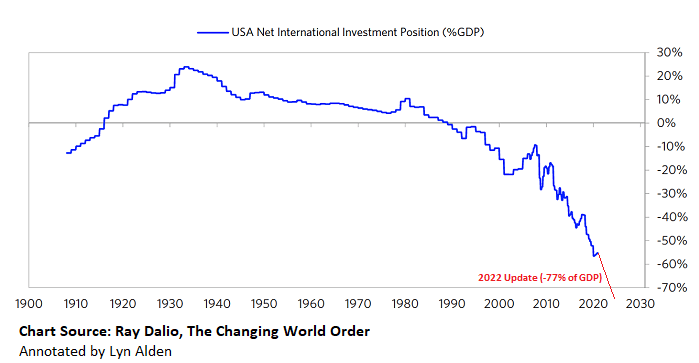
Approximately speaking, entities in the US own $34 trillion in foreign assets while foreign entities own $52 trillion in US assets.
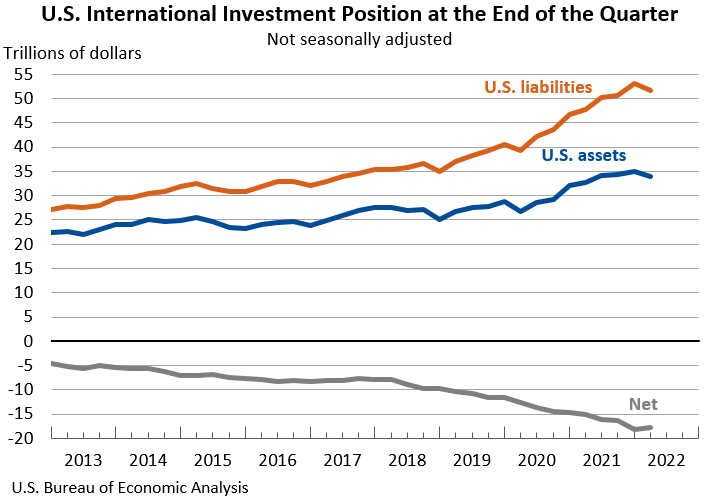
Chart Source: US BEA
The reason for this decline is a combination of two main things. The first is that starting in the 1970s, the US began running structural trade deficits with the rest of the world, as it shifted the nature of the global financial system by putting the US Treasury at the heart of it. Everybody needs dollars, market forces end up such that the US supplies those dollars to the world via trade deficits mainly. The second is that the US stock market has generally outperformed most other stock markets, partly due to better earnings but also due to higher valuations on those earnings, and capital allocators across the world are stuffed pretty heavily into US equities and other US financial assets.
This issue is a big reason why the Federal Reserve offers swap lines whenever there is a liquidity crisis, such as in 2008 and 2020. If international trade dries up, and the dollar spikes relative to other currencies, then countries around the world can run into problems servicing their dollar-denominated debts (which, unintuitively, are usually owed to other non-US entities). As a result, they can start rapidly selling some of their US financial assets to get dollars, which crashes US financial markets and causes liquidity to disappear.
The reason I monitor NIIPs, and especially-so for the US, is because it can highlight some of the structural imbalances out there. There are low probability events that can rapidly turn around a country’s currency and NIIP, particularly if something changes in how the global monetary system is structured.
The country that surprises me whenever I update my NIIP dataset is Argentina. Usually countries with frequent currency crises have negative NIIPs, and usually positive NIIP countries have pretty stable currencies. Argentina has been one of the big outliers among major countries in that sense.
European Natural Gas Update
Europe’s natural gas prices and electricity prices went vertical in recent weeks, but have since reversed. Demand destruction has been occurring (high-energy factories shutting down, people trying to conserve lightning and hot water), and the EU announced potential intervention plans. However, as of this writing, Russia recently stopped gas flows over Nord Stream 1, which could cause this to spike back up yet again.
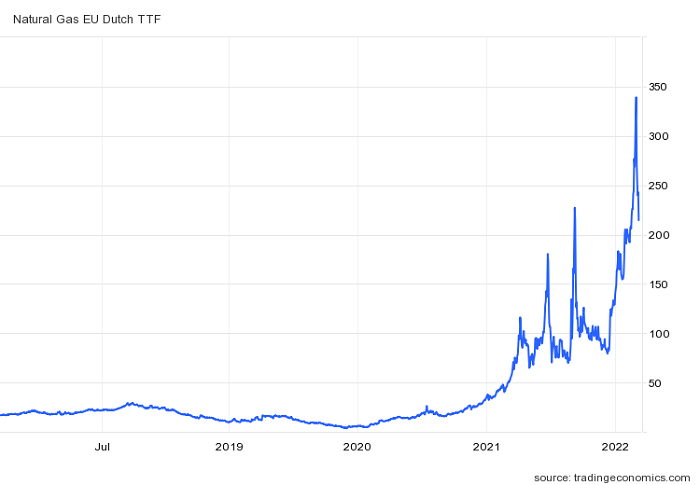
Europe remains in a very dangerous situation economically until they fix their energy situation, which means bringing on more types of supply for heating and electricity generation.
A subset of European and UK politicians have been shifting their views on domestic fracking and/or on nuclear power generation in response to this acute energy situation.
China Lockdowns Update
China continues with their zero-COVID policy, which differs from most of the rest of the world.
Chengdu, the country’s sixth-largest city of 21 million people, had 150 reported infections on Thursday and 155 on Friday, and so they locked the city down.
Although China’s credit impulse has turned up over the past few months, it has been hard for Chinese asset prices to gain any traction, since it remains unclear what their endgame is here. This has certainly extended far longer than I expected back in 2021.
Digital Assets Note
Bitcoin continues to lack a strong bid, as most risk assets rolled over and struggled during this macro environment and Powell’s hawkish re-assertion. It hasn’t broken to new lows, but it has chopped around weakly, slightly below average on-chain cost basis.
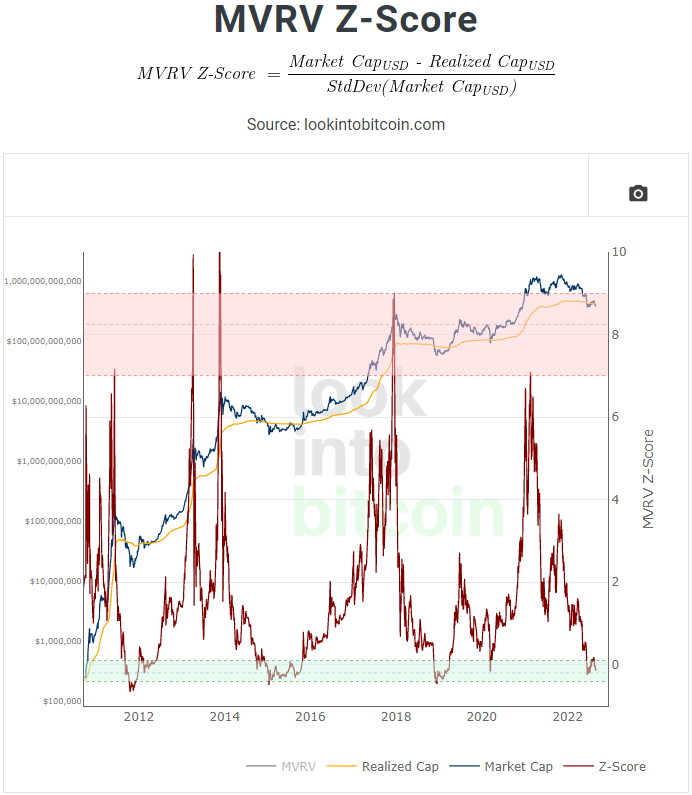
Chart Source: Look Into Bitcoin
Lightning Accelerator
Ross Stevens of NYDIG (a multi-billion dollar bitcoin-focused company) announced a Lightning network accelerator called Wolf. Pre-seed, seed, and Series A startup teams that are focused on building businesses and tech on Lightning can apply. If accepted, they receive transportation and lodging from anywhere in the world to One Vanderbuilt Ave in NYC, to attend an 8-week cohort with mentors to focus their development efforts, and then will have seed capital available to them.
The Lightning network continues to be one of the areas that I’m bullish on, as it grows from its small base during a bear market. There are a lot of new technical developments coming out, ranging from Taro to Fedimint to Greenlight that aim to improve aspects of the network.
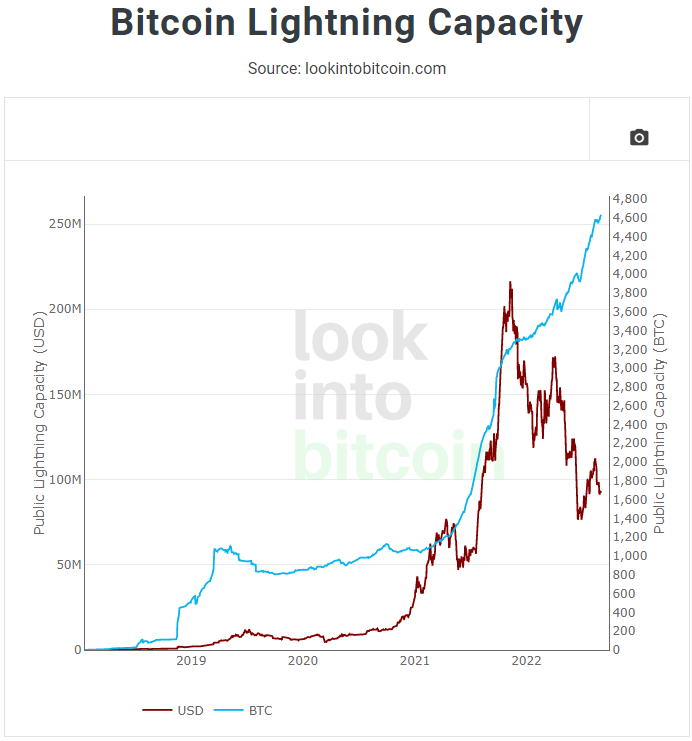
Chart Source: Look Into Bitcoin
Ethereum Merge
I’ve discussed the Ethereum Merge in prior reports, and plan to focus on that again in my next report.
The short version is that Ethereum developers plan to switch their network from proof-of-work to proof-of-stake in mid-September. This will lower Ethereum coin issuance which all else equal should be supportive of price, but it also risks further centralizing and potentially censoring the network, due to how centralized the validating stakes currently are, and how centralized they tend to be on most proof-of-stake networks in general.
Portfolio Updates
The portfolios are available in my Google Drive.
Newsletter Portfolio
-No current changes.
Fortress Income
-No current changes.
ETF-Only Portfolio
-No current changes.
No Limits Portfolio
-No current changes.
Top 12 List
-No current changes.
Other Holdings
-No current changes.
Equities: Focusing on Defense and Yield
The S&P 500 continues to have a pretty concerning structure. After a decent rally in the summer, it ran into resistance around the 200-day (40-week here) moving average and rolled back over sharply.
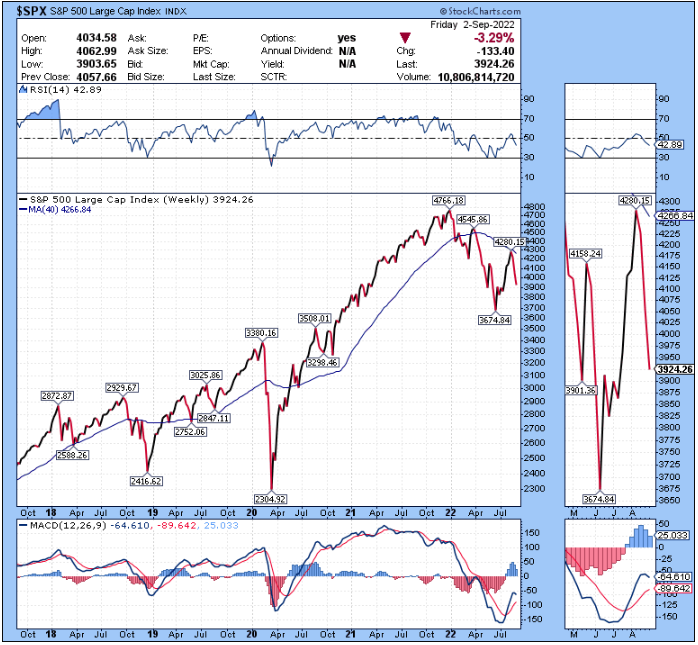
When strong economic reports come out, bond yields and the dollar usually go up in anticipation of a more hawkish Fed, which puts more valuation pressure on equities. In contrast, when weak economic reports come out, bond yields and the dollar usually drop and give equities a chance to rally. But if economic data get too weak, that of course will impact equity earnings.
That makes it hard for equities to get a massive bid either way; it would likely require disinflationary growth to see a more sustained bid in equities again. And it will be hard to get disinflationary growth until energy is abundant and can easily get to where it needs to be.
In my reports for a while now, I keep coming back to energy pipelines, including Enterprise Products Partners (EPD) and the Alerian MLP ETF (AMLP). They had big outperformance from the beginning of the year into June, and since then have continued to hold up pretty well despite a bit of a drop in the middle there.
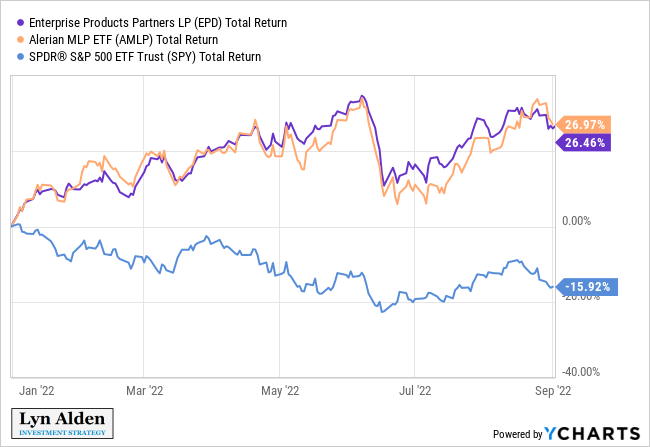
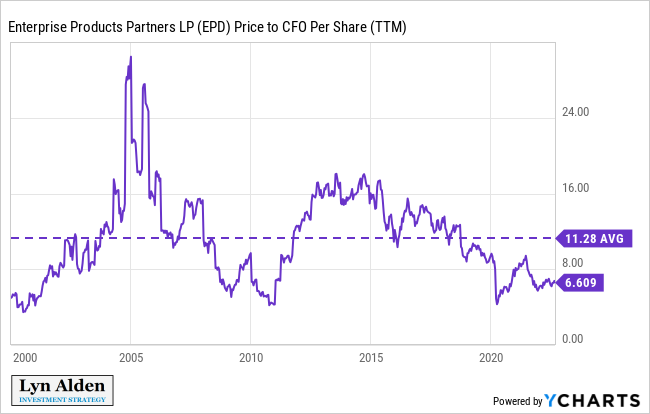
The reason that I continue to like US pipelines here is that their underlying cash flows in many cases are not very sensitive to fluctuations in energy prices, and the probability that their volumes will be impaired seems low. They were already washed out in 2014 and again in 2020 in term of valuation (and for many of them, leverage), and remain historically cheap despite their outperformance in 2022. The current 2020-2022 period looks a lot like the 2009-2011 period:
Enterprise Products Partners has 25 years of consecutive annual distribution increases, and currently yields over 7%.
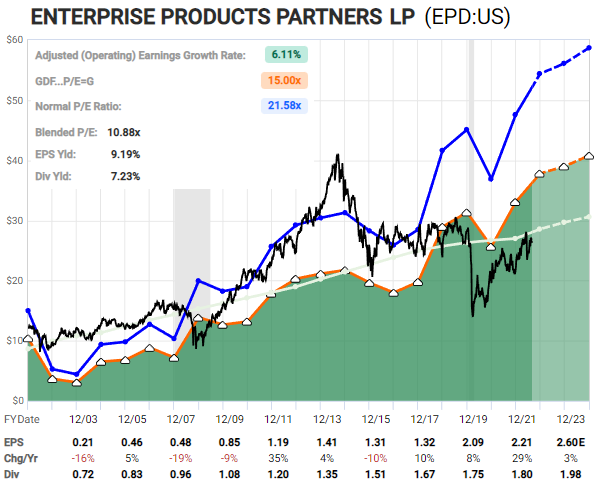
Chart Source: F.A.S.T. Graphs
Despite Treasury yields currently being around decade-highs, EPD’s distribution yield currently has an above-average spread over Treasury yields, meaning that investors are well-compensated for the equity risk they are taking on:
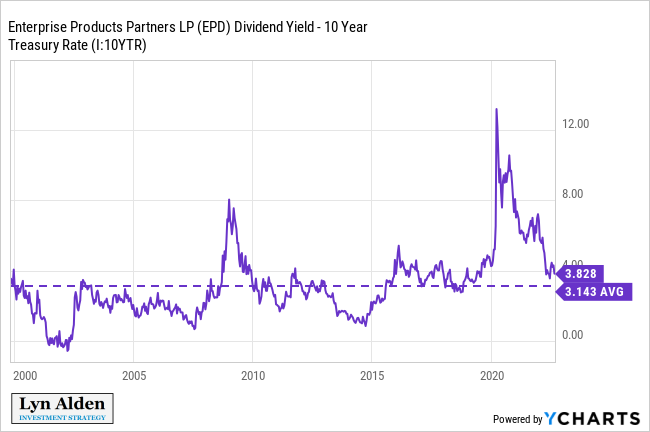
With a 10-year Treasury, investors get a roughly 3% yield with no annual growth on that yield. With EPD, investors get a roughly 7% yield that grows a bit each year, but with operational risk and other risks.
Although pipelines have outperformed most other assets in 2022, based on the valuations and other reasons above, I don’t think the trend is overdone. They’re outperforming from an oversold, under-owned, undervalued starting point, after a long period of underperformance.
More broadly, I continue to be more constructive on value-oriented equities than growth-oriented equities. This chart shows the value/growth ratio, where the line going up means value is outperforming.
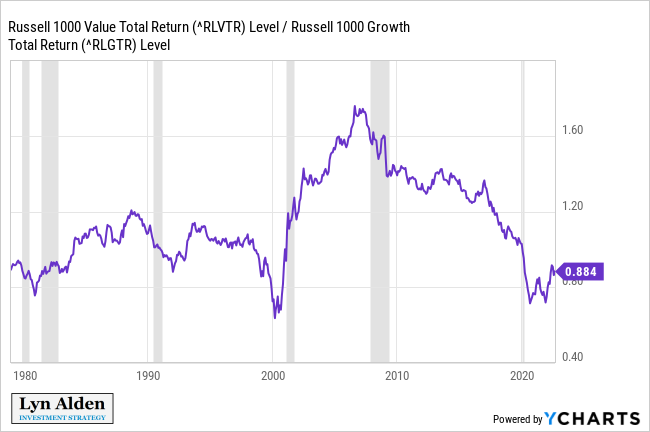
This ratio has had an upward tilt since the capitulation in spring 2020, but it’s still below 2019 levels. I don’t necessarily expect a strong surge upwards, but I continue to emphasize cheap, high-quality, and decent-yielding companies.
Cigna is another company that I’ve been highlighting for a while. Its share price has been smoothly grinding higher all year despite the broad sell-off because it’s not very rate sensitive or economically sensitive. This is a health insurer and pharmacy benefits manager. They initiated a dividend in 2021 and grew it in 2022.
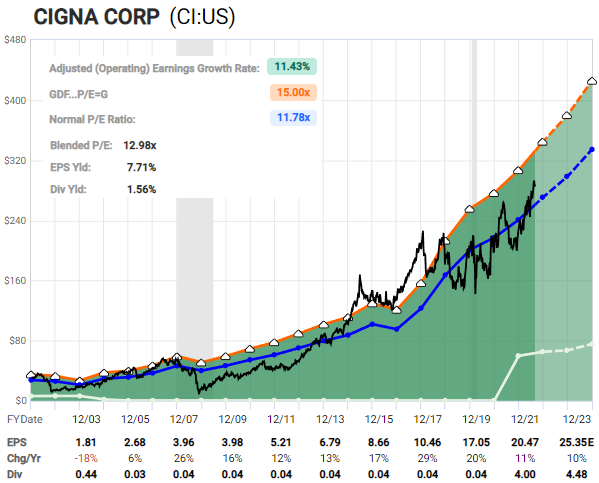
Chart Source: F.A.S.T. Graphs
Until we see leading indicators pointing towards economic acceleration rather than deceleration, I continue to want outsized exposure to healthcare stocks and pipelines, along with cash and gold. Of course, any one company can run into surprising problems, including otherwise-defensive companies, so I emphasize diversification within a given sector.
Final Thoughts: Gold and Brazil
Gold has been a surprisingly unimpressive given the macro situation. The hawkish Fed and strong dollar have clearly been big headwinds, but given the heightened political uncertainty, it has been quite weak. It has done better in euro terms, but not remarkably so.
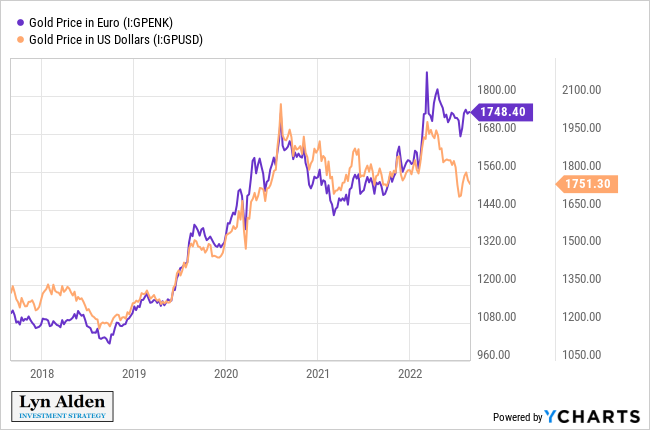
If a year or two ago, someone had told me that in 2022 the US would have 9% headline inflation and 3% Treasury yields, with an active invasion of Ukraine by Russia and subsequent sanctions and geopolitical uncertainty, along with repeated lockdowns of major Chinese cities, I would have not have guessed that gold would be down 3% in dollar terms for the calendar year.
Similarly, if someone had told me that in 2022, the Euro Area would run into massive war-and-drought energy shortages, with power and natural gas price levels that are 5x to 10x as high as what they are normally, I would not have guessed that gold would be up just 10% in euro terms.
The remaining catalyst is to see what happens with gold when the Fed eventually reaches the height of its monetary tightness. Gold can trade on multiple catalysts but the strong dollar and hawkish Fed seem to have overwhelmed most other factors recently.
On the other hand, Brazilian equities have been among the better performers this year. As the chart below shows, US equities, foreign developed equities, and emerging market equities have all performed very similarly this year. However, Brazil has been rather strong:
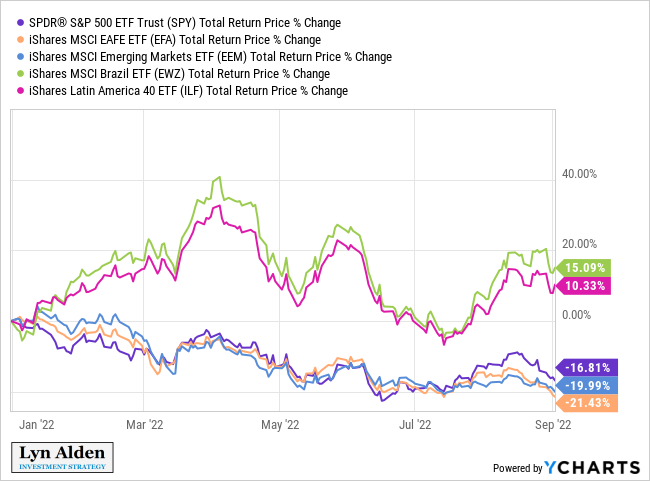
While I remain defensive overall in this challenging environment, I do like pockets of risk, such as Brazilian equities. I highlighted Brazil back in my January 23rd report, and it has done pretty well. I expect that position to be very volatile, but I view it to still be attractive for the longer-term unless something materially changes.
