Deep Dive: Macro Update and Portfolio Pruning
 By
Lyn Alden
By
Lyn Alden
The macro section of this report takes a look at the US business cycle and Japan's currency situation.
The digital asset section provides updates on Bitcoin and Ethereum ecosystems.
The equity section provides a run-through of portfolio pruning that I am doing, with some buys and sells.
Macro View
Currencies and sovereign bond yields continue to be the driving factor in global markets recently.
The amount of paper wealth that was destroyed in the global bond market up through September in particular is pretty staggering:
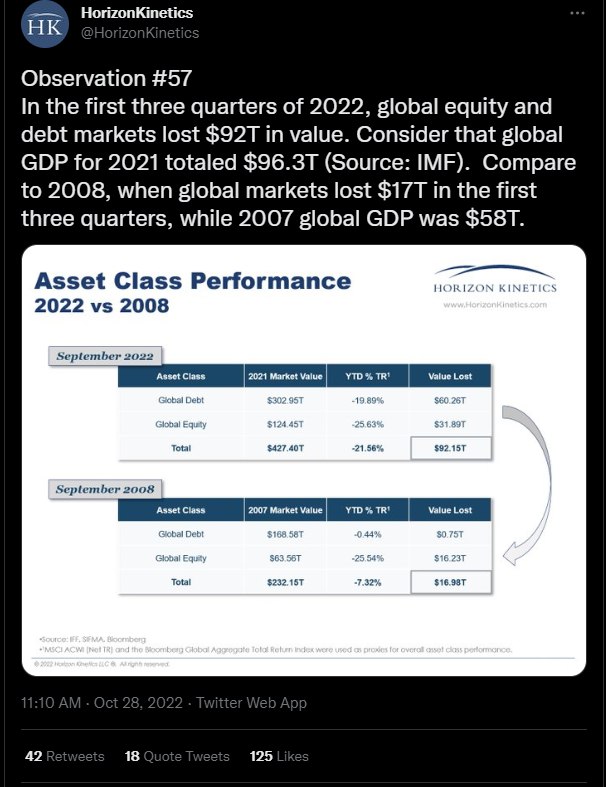
Source: Horizon Kinetics
US Business Cycle Analysis
Here is my updated heatmap of various economic indicators for the US economy over the past five years, measured in year-over-year percent change terms. Rather than describing the economy in narratives or qualitative terms, or cherry pick data to fit a particularly bullish or bearish view, it quantifies a broad section of data.
The economic cycle peaked in year-over-year rate-of-change terms in Q2 2021, and since then has been decelerating but still generally positive.
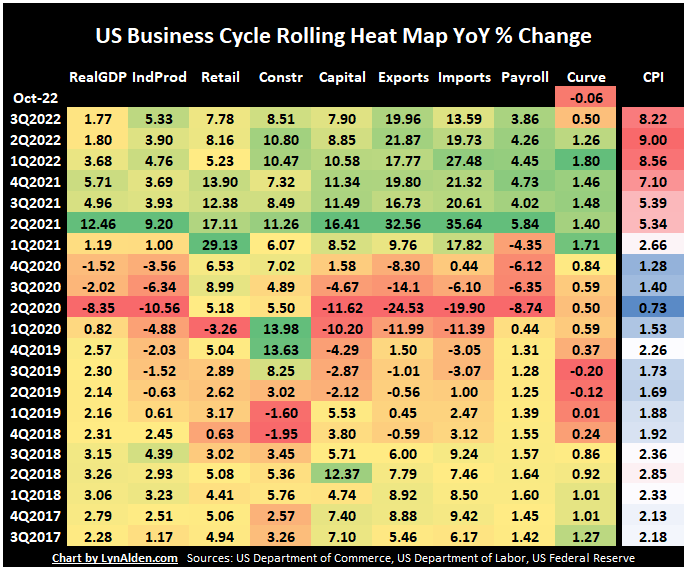
The chart starts from the bottom and goes up over five years, and each column represents one of the economic indicators.
For most of the chart, I use a green/yellow/red color spectrum. Green indicates solid growth, yellow indicates medium, and orange/red indicate slow growth or contraction, relative to the rest of the 5-year period for that indicator. In other words, green is good and red is bad.
For inflation CPI, there is a separate blue/white/red color scale, because high or low inflation in a vacuum is not necessarily “good” or “bad” in the same way as the rest of the heat map. Red indicates higher price inflation, white indicates medium, and blue is lower price inflation, relative to the 5-year period. Economic slowdowns tend to be dis-inflationary while economic booms tend to be pro-inflationary, but there are also some business cycles that slow down with high inflation, and thus become “stagflationary”. So, inflation gets its own color scheme.
Heat Map Indicators Referenced:
- Real Gross Domestic Product
- Industrial Production
- Advance Retail Sales, Excluding Food Services
- Total Construction Spending
- Capital Goods Orders, Nondefense, Excluding Aircraft
- Exports of Goods and Services
- Imports of Goods and Services
- All Employees, Total Nonfarm
- 10 Year Minus 3 Month Yield Curve
- Consumer Prices, All Urban Consumers, All Items in City Average
Note that many of these are nominal figures. Retail sales, construction spending, capital goods orders, exports, imports, are all measured in nominal dollars, and thus have a significant inflation component. Retail sales growth at 7.78% year-over-year, construction spending at 8.51%, and capital goods orders at 7.90% all seem like fine numbers, until we factor in 8.22% CPI, which puts those three indicators approximately flat in inflation-adjusted terms.
In my view, the difference between nominal and real (inflation-adjusted) figures is confusing a lot of analysts since it makes things harder to analyze. For stock prices, things like nominal earnings and revenues are what matter. But for measuring the rate-of-change of an economy, the real figures are more useful. Most data, such as PMI data and the yield curve suggests that the sluggish real numbers are giving a better insight into how the economy is performing.
Yield Curve
I've been paying close attention to yield curves during this monetary tightening cycle.
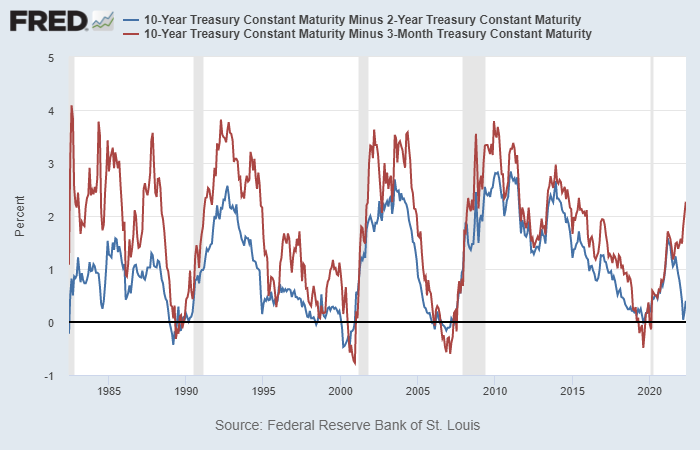
Back in May, the 10yr-2yr briefly inverted and then un-inverted, and I wrote in my May newsletter "Inflation or Recession" that the 10yr-3mo would likely be catching down to it:
The 10yr-2yr Treasury yield curve briefly inverted, and the 10yr-3mo yield curve is likely to catch down to it if the Fed keeps raising short-end interest rates:
Well starting in July, the 10yr-2yr re-inverted and remained persistently inverted since then, and this past week the 10yr-3mo curve has inverted:
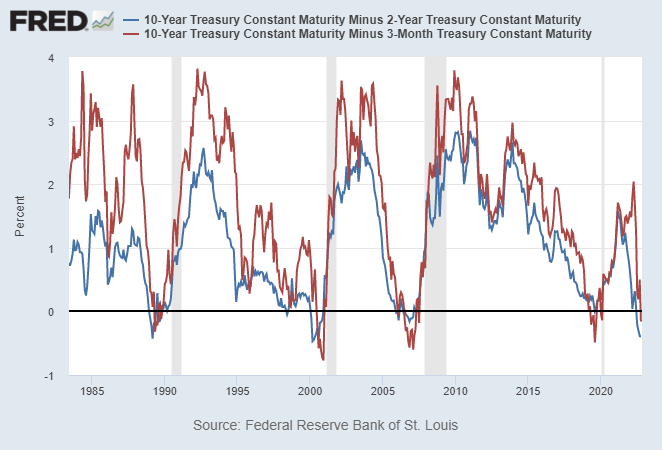
The 10yr-3mo yield curve is the yield curve that the original studies were done on decades ago, which linked yield curve inversion to eventual recession. The timing until a recession varies, but the past 8 recessions in the US have all been preceded by a 10yr-3mo yield curve inversion, and that particular curve has not given any false-positive signals during that time either (unlike some of the other yield curves that did give some false-positives).
This time could be different of course, but basically the Treasury market is signaling a high probability of a recession over the next year or so. Usually the yield curve un-inverts before a recession, but that is because the Fed swiftly cuts short-term interest rates and un-inverts the curve, which they might be slow to do this time due to high inflation.
International Currency Updates
When a country has too much sovereign debt relative to GDP, but denominated in their own currency, they end up needing their central bank to pin yields low to avoid a fiscal spiral. A fiscal spiral is when interest payments take up a larger and larger share of the budget, resulting in the acceleration of debt issuance to pay for interest on prior debt. This pinning of yields low against market forces is known as yield curve control, and is a form of financial repression.
The mechanism to do this is that the central bank has to be willing to buy any bond that tries to go over the yield peg (which is another way of saying that they'll buy any bond that goes below the price peg, thus keeping an artificially high price). The cost for that is that they lose control of their currency value; by enforcing interest rates below inflation that the market would not clear on its own, it pushes voluntary global capital away.
Japan has sovereign debt to GDP of well over 200%. The Bank of Japan is holding short-term rates at -0.1% and is pegging their 10-year government bond yields at 0.25% by being willing to print bank reserves to buy any bond that goes over that yield. When the 10-year bond tried to go over that threshold in spring 2022, it ran into that cap and was not allowed to go over. So the bond market exited the bonds around the margins and thus took it out on the currency instead:
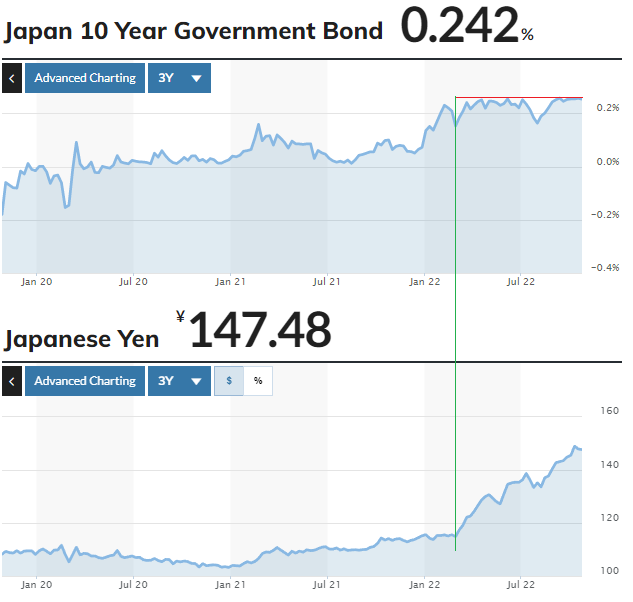
Chart Source: MarketWatch (w/ lines for clarity)
This is a remarkable move for a developed market currency, going from 115 yen to the dollar to 150 yen to the dollar between spring and autumn of the same year. The yen is normally a safe-haven currency, and Japan is going through a less severe energy crisis than Europe, and so a significant part of the yen devaluation is because they're the country with the most dovish monetary policy.
There are some ways to slow down that currency devaluation. A draconian way is to use capital controls and trap the capital from leaving, but that makes global capital even less likely to want to invest in that country in the future. A more market-oriented way is to sell some of the country's foreign exchange reserves and buy back some of its own currency. This latter option is only available to countries with a significant amount of foreign exchange reserves, and Japan has well over a trillion dollars worth of reserves.
So, Japan has been doing occasional currency interventions to slow the currency devaluation. If short-sellers get too leveraged or with too-big position sizes, Japanese currency monitors can sell several billion dollars worth of reserve assets and buy back a bunch of yen to give it a rapid-but-brief strengthening and shake them out.
When small countries do this, it doesn't really affect the dollar much. However, there are some countries like China and Japan that have a large enough stockpile of dollar-denominated reserves that they can actually contribute to Treasury market dysfunction if they go all-out on currency defense (which they've not done yet). If the Fed is not buying Treasuries, commercial banks are not buying Treasuries, and the foreign sector in aggregate is not buying Treasuries, then who is buying Treasuries?
In this way, multiple large countries together can be the actual limiting factor for how tight the Fed can be before having to resort to various liquidity programs on the US Treasury market.
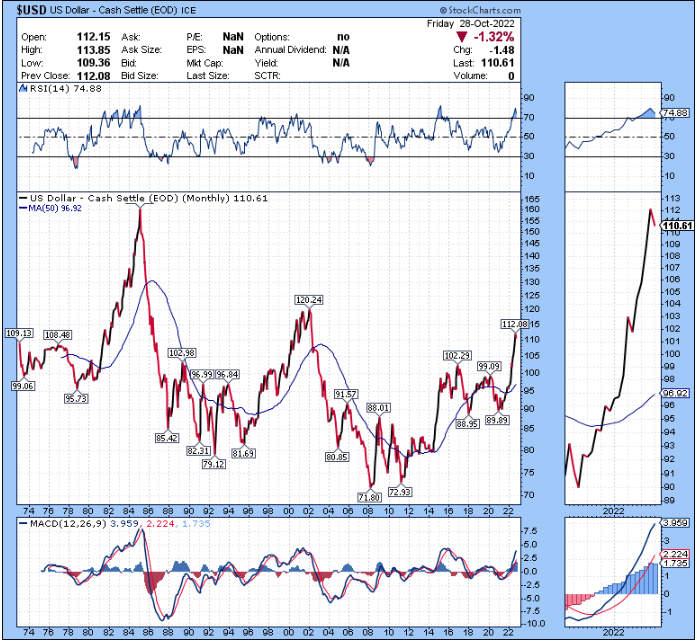
The dollar has been running out of momentum lately but it remains to be seen if it is just taking a break or if this is a more significant rollover point.
Nick Timiraos of the Wall Street Journal is widely regarded as being the "Fed whisperer" because he has a lot of access to Fed officials and is seen by many as being the journalist that the Fed uses when it wants to send out messages to the market. To what extent that is accurate is somewhat beside the point that so many Fed watchers believe it.
In an October 21st piece, Timiraos collected a number of dovish public statements from Fed officials about the possibility of slowing down rate hikes in December, and discussed how the Fed would navigate and signal around that possibility in November if that is indeed the path they end up going down. This was seen by many as a contributing factor to the bull rally in risk assets over the past couple weeks. Recently, his follow-up article walked some of that back with more hawkish talk.
The Fed funds rate is currently a little over 3%. It's widely regarded that the Fed will hike rates by 0.75% next week. After that things are a lot less clear, with the market (Fed funds futures curve) expecting a 0.50% hike in December, which would bring the lower bound of short-term rates up to 4.25%. The market then expects that the rates will top out at 4.75%-5% and sit in that range for the remainder of 2023. In other words, the Fed is likely reaching "peak hawkishness in rate of change terms", but not yet "peak hawkishness in absolute terms".
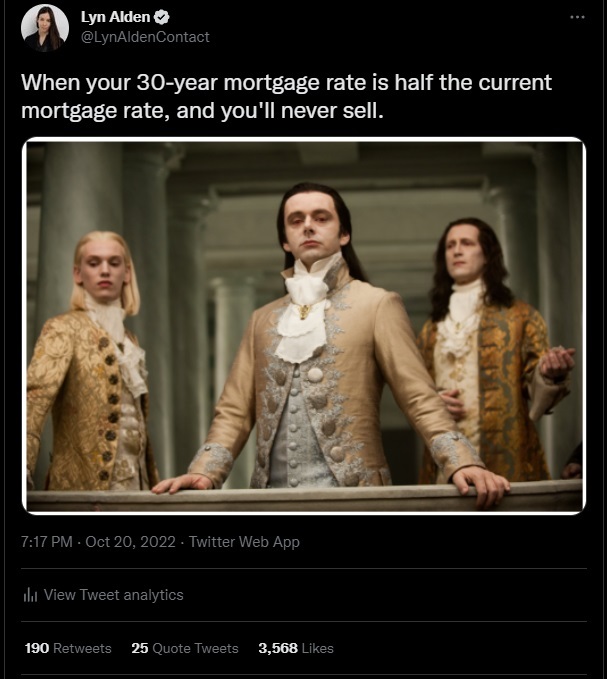
In the near term, these high rates keep pressure on the housing market because it slows down both potential buyers and sellers, with many people "locked in" to their existing homes and low mortgage rates. This will also keep pressure on corporate margins as more and more corporate debt matures and is refinanced at higher rates.
In the longer term, it puts pressure on the Federal government. The ever-increasing debt relative to GDP was workable when interest rates were going structurally downward, but now that more and more of it is refinanced at higher rates over time, the interest expense is on track to outpace all military spending:
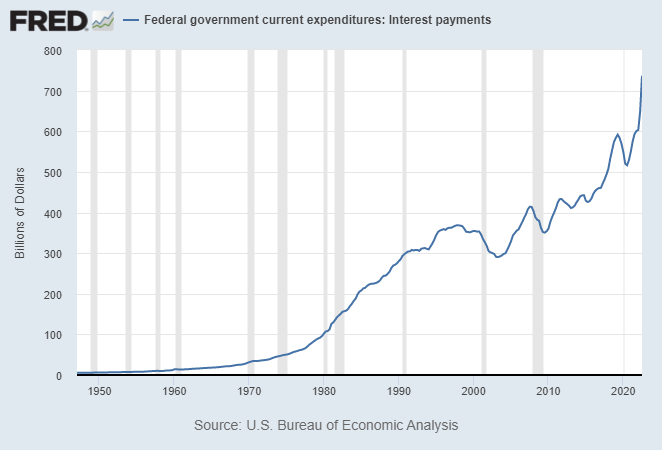
For example, if $31 trillion in debt gradually refinances towards 4% rates on average, that would be $1.24 trillion in annual interest expense, with ongoing deficits of over a trillion dollars per year that keep adding more debt to this pile. Now, some of that $1.24 trillion in annual interest would be payed to intra-government debt (such as the portion that is held by Social Security), but it still leaves nearly $1 trillion in outgoing annual interest.
Unless taxes are raised to pay for that interest (which is very hard to do in a gridlocked political setting), then that interest gets financed by increasingly even larger deficits- more Treasury securities are issued to pay interest on existing debt, and yet they themselves are interest-bearing and add to future interest payments.
Over time, they'll need to find new buyers of Treasuries. SLR adjustments by monetary policymakers could let commercial banks buy more. The Fed could resort to buying more at some point in order to re-liquify the market, but that would be optically challenging with inflation at above-target levels and would represent a major capitulation similar to what happened to the Bank of England back in September, similar to what the European Central Bank is doing for Italian debt, and similar to what the Bank of Japan is doing for Japanese debt.
Digital Assets Note
There has been some price stabilization across the digital asset space.
During the broad sell-off in risk assets earlier this year, it was mainly a valuation compression, so rates going higher sent stock valuations down and sent bitcoin and crypto down, squeezing out leverage and speculation.
Lately, however, the pockets of ongoing turbulence in equity markets is more about weak Big Tech earnings, while the valuation pressure has been less of an issue. This gives a window for non-earning monetary assets like bitcoin to potentially hold up better than the Nasdaq.
Wolf Accelerator Launch
First announced a couple months ago, the Wolf accelerator officially launched last week.
This is an on-site startup accelerator located 1,200 feet in the air with wrap-around views of Manhattan at One Vanderbuilt Ave, focused exclusively on the open source Lightning network. Founders and small startup teams that have a business idea to build on Lightning can apply.
Those that are selected will receive $250k in VC funding, and will come to an 8-week cohort to make connections and get on track to build out the concept. Wolf was launched out of Stone Ridge Holdings Group, which includes NYDIG. They have a lot of connections with bitcoin miners, payment companies, institutions, and venture capital firms to give Lightning-based businesses every possible opportunity to succeed, if the underlying concept is sound.
Techcrunch ran a good piece on this launch, sharing some of the details. The piece is worth a read but here's an excerpt:
The Lightning Network is a layer-2 payment system built on top of Bitcoin that aims to enable faster payment transactions. Separately, Taro is a protocol that launched in April of this year to help issue digital assets on Bitcoin’s blockchain that can then be transferred to Lightning Network instantly in low-fee transactions.
“They’re both generic and usable enough in such a wide range of applications that it’s like saying you’re starting an accelerator focused on HTTP,” Brewster said. “It’s a specific technology but the business use cases can be incredibly broad ranging. The fact that we’re very focused is a big part of the leg up and can be a big draw for founders.”
Stratum V2 (Decentralizing) vs MEV-Boost (Centralizing)
This past month had a significant divergence between Bitcoin and Ethereum ecosystems in terms of greater decentralization vs greater centralization.
I've been writing some of my concerns about Ethereum centralization for a while. The combination of proof-of-stake and MEV-boost (validators outsourcing their block construction to specialized third parties) has now resulted in over 60% of Ethereum blocks being OFAC-compliant, meaning they will censor things like Tornado Cash transactions at the protocol layer:
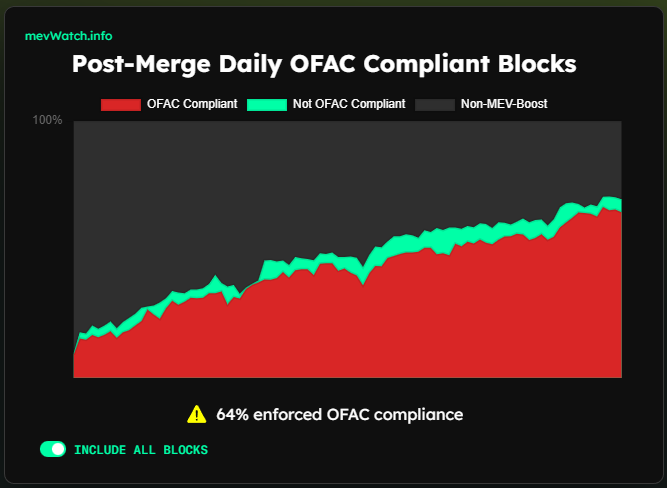
It's still easy to do non-OFAC compliant transactions, but this centralization trend is concerning a significant subset of the Ethereum community. If OFAC-compliant validators ever stop attesting to non-OFAC compliant blocks (which they're currently not doing, but could flip to doing so like a light switch), then this is already above the threshold that would cause protocol-wide base layer transaction censorship.
Meanwhile, the Bitcoin ecosystem went the other way, with the release of the reference implementation of the long-awaited Stratum V2 protocol, which gives more power of block construction back to individual miners rather than mining pools. Bitcoin has not historically had a problem with protocol-level censorship but advancements in this area will make it even more decentralized and reduce the risk of protocol-level censorship.
If that all sounds like gibberish, let's back up a minute.
"Block construction" means selecting which transactions in the queue should be put into the next block and added to the blockchain. Basically the whole point of a blockchain system, the reason why Satoshi Nakamoto bothered to invent Bitcoin back in 2008, was to create a payments and savings network that is open source and censorship-resistant. It's the idea that anyone in the world with access to the internet can participate in the network for transferring value, similar to how anyone in the world with access to the internet can send emails. A censored blockchain is a neutered blockchain.
Bitcoin Block Construction
In the Bitcoin ecosystem, miners send their hash rate to mining pools, and those mining pools construct the blocks. This has often been cited as a centralization risk, but it's not really, because if a mining pool becomes a problem, there is almost no switching costs for miners to redirect their hash rate elsewhere, and they can do so immediately. Mining pools don't custody the actual machines, and they are mostly a commoditized industry so no pool has any structural advantage over another pool.
Additionally, the Bitcoin ecosystem is purposely simple on the base layer, so block construction is also simple- you pretty much just put the highest-fee transactions at the top of the queue.
Still, any software that decentralizes this further, and gives more power back to individual miners, is better for decentralization and reduces the risk of protocol-layer censorship. The biggest miners in the world only have about 5% of bitcoin hash rate, and miners are spread rather globally, so it would require control of the majority of physical miners in order to censor the network.
Probably the best "steelman argument" against the Bitcoin mining model is that the supply chain is still pretty centralized. There are only a handful of foundries and chip designers making the hardware that miners use. Companies like Blockstream, Block Inc (SQ), and Intel (INTC) are working on opening this up more, but it'll still take a couple years to get there.
Ethereum Block Construction
In the Ethereum ecosystem, an increasing number of validators outsource block construction to specialized block constructing groups. Unlike Bitcoin, Ethereum is very complex on the base layer, with all sorts of smart contract transactions, which is its main selling point. Selecting and ordering transactions into blocks is therefore a highly specialized endeavor, and those who do it the best can extract a lot of fees by basically front-running everyone's trades.
It requires a lot of top-notch analysts and proprietary coding to optimize for Ethereum block construction, so the industry naturally consolidates towards a few. The biggest by far, Flashbots, has 80% of market share for block outsourcing, and they are OFAC-compliant. For validators to use any other block constructor is to give up a significant portion of the fees they would get by using the biggest and best. And once you are the biggest and the best, it generates network effects to remain entrenched.
Bitcoin Miner Weakness
While the bitcoin price has been stagnant in recent months, the hash rate on the network has gone vertical. The hash rate is the total amount of application-specific processing power on the network being used to process transactions.
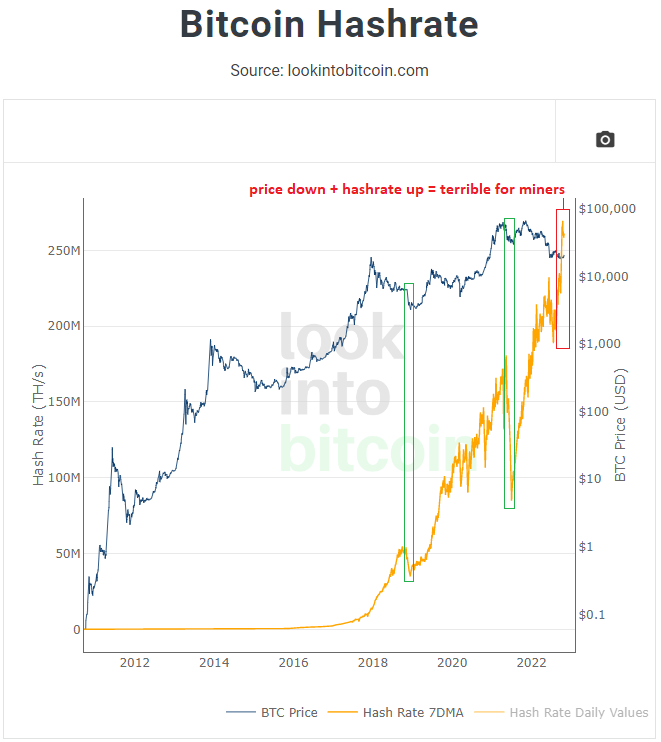
Normally the hash rate goes down during price crashes. This time, the price crashed but after some pullback, the hash rate went straight up while prices are still low.
This is a particularly bad combination for existing miners because it means they get fewer bitcoins each (a fixed number of about 900 bitcoin issued per day, spread over more miners), and each of those bitcoins are rather low-priced. This is most likely happening due to capex decisions that were made in 2021, now coming to maturity in 2022 even though they don't make economic sense if they were done today.
The biggest public miner, Core Scientific (CORZ) had to sell most of its bitcoin a while ago, and last week issued a bankruptcy warning. Marathon Digital (MARA) is the one I'm watching because they still have around 9,000 bitcoin along with some debt, and could be pressured to dump some of that bitcoin on the market like Core Scientific did a while ago.
Overall, with a handful of bankruptcies in the sector, it's probably getting to the point where hash rate will take a breather unless price begins to recover.
ETHBTC Positive Price Trend
While I am bearish on Ethereum's current trend of centralization, the ETHBTC price ratio has been strong as of late and appears rather bullish.
The combination of no net supply issuance post-Merge, and the fact that developers still haven't enabled un-staking, continues to create a rather strong supply squeeze that is constructive for price:
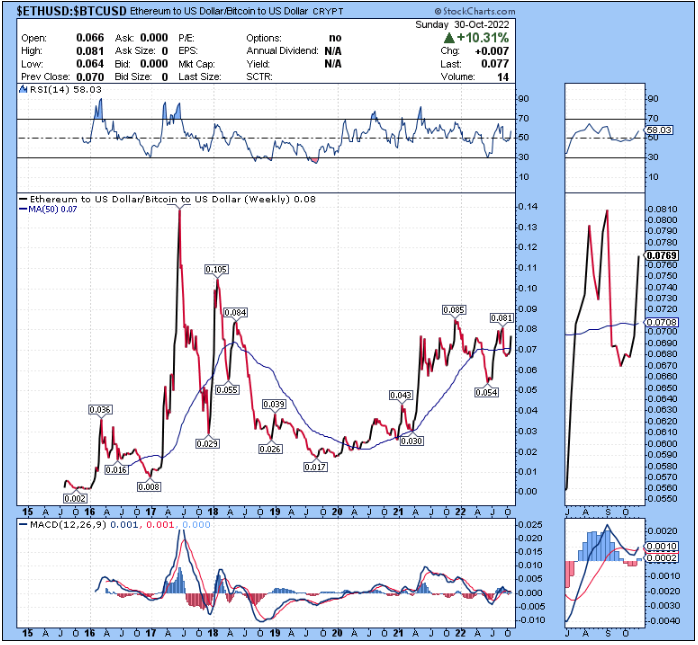
That price analysis could change at any time based on some OFAC censoring, based on updated charting, and so forth. But the ETHBTC chart within a bear market, combined with the supply/demand details, doesn't look bearish currently.
If ETHBTC rolls over and forms a structural lower high compared to the 2017 cycle (as most crypto coins do in BTC terms), then that is quite long-term bearish for ETH. However, ETHBTC hasn't done that yet, with the Merge likely playing the save so far.
So, somewhat similar to a meme stock, my current analysis on Ethereum's fundamentals is rather different directionally than my current analysis on the intermediate-term ETHBTC price ratio.
In the long run it will be ecosystem usage and sustainable demand or lack thereof that drives the price, whereas in shorter timeframes it is simply supply and demand for the coin.
Portfolio Updates
The portfolios are available in my Google Drive.
Most of the changes here are mentioned in more detail in the equity analysis section below.
Newsletter Portfolio
-In the dividend stock section, sell the 3% positions in DHI, JPM, and EBAY.
-In the dividend stock section, add 4% to RTX, 4% to TFC, and increase OMAB from 3% to 4%.
-In the growth stock section, sell the 8% position in ETSY and add an 8% position in BLDR.
Fortress Income
-In the individual stock section, sell the 4% positions each in EBAY and BAC.
-Add 4% to TFC and 4% to RTX in the individual stock section.
ETF-Only Portfolio
-No current changes.
No Limits Portfolio
-Sell BAC, EBAY, and PHM positions.
-Buy 40 shares TFC, 20 shares of RTX, and 20 shares BLDR.
Top 12 List
-Replace BABA in the aggressive list with BLDR.
-Replace BNS in the conservative list with TFC.
Other Holdings
-Sell EBAY, PINS, PHM. Buy TFC and BLDR.
Portfolio Pruning
As we get closer to year-end, there are various tax-loss harvesting opportunities to take advantage of.
In addition, with significant sell-offs in some industries, there are opportunities to "upgrade" in terms of selling a losing stock but using the proceeds to move into something that has also gone down a lot recently, but that may have better future potential.
It's good to constantly re-assess a portfolio, and here I will do some house-cleaning.
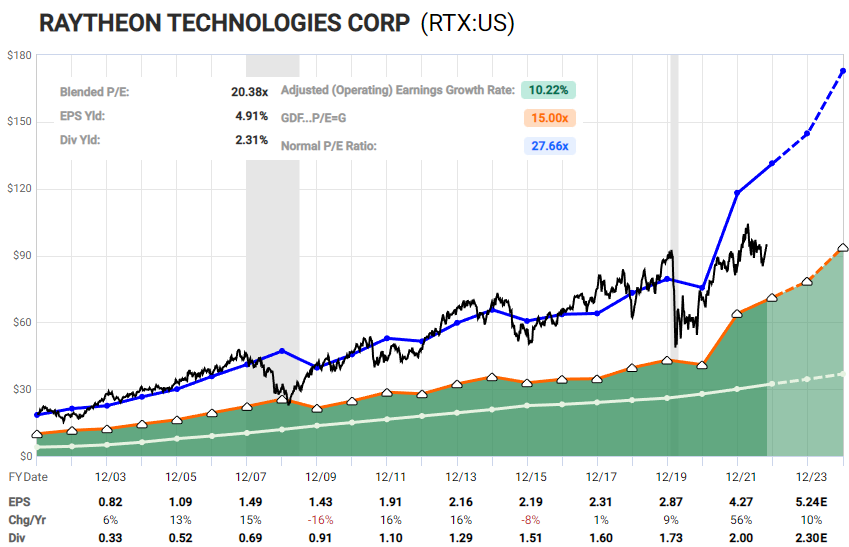
Raytheon
With the world looking increasingly multi-polar in the 2020s going forward, rather than unipolar as it largely was from the 1990s through the 2010s, many defense suppliers can do well. There are basically three bullish catalysts for Raytheon's defense business lines:
First, given the current situation and activities of Russia, China, and their various economic alliances with other Eurasian or BRICs nations, it's unlikely that the US will be cutting defense spending any time soon.
Second, polls and betting markets are pointing to Republicans winning one or both houses of Congress in the upcoming midterms, and in aggregate they are generally against most military spending cuts.
Third, Raytheon also sells military products to US allies, and a number of European countries are probably less likely to skimp on defense spending going forward than they have been.
In addition, Raytheon sells products to commercial airlines and helicopter companies as well. I don't like investing in airlines because it's a rough business model, but I like wider-moat businesses such as airports and avionics makers.
In my prior engineering profession, I used to physically work with a lot of avionics that are currently under the Raytheon umbrella of brands.
Consensus analysts are rather bullish on forward prospects over the next couple years. Here's the F.A.S.T. Graph:
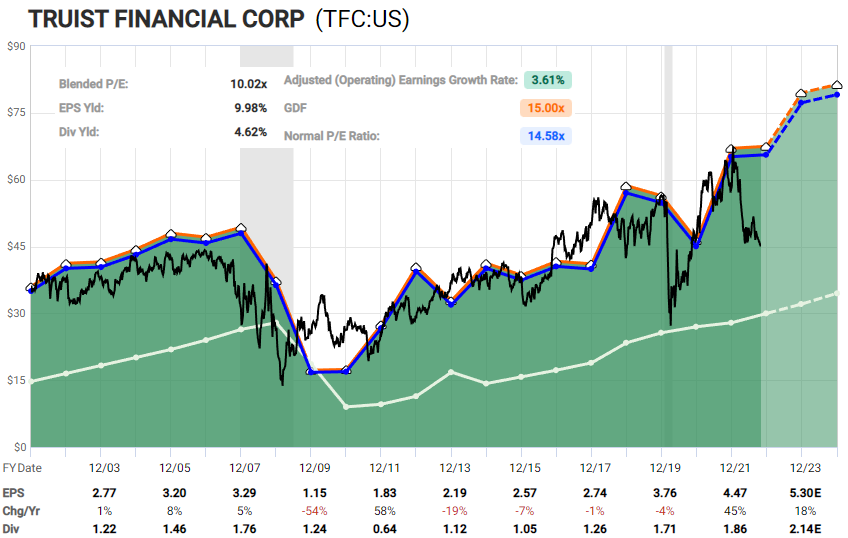
Medium Banks vs Big Banks
I'm constructive on the US banking sector in general, despite recession risks. Many investors are treating a potential recession as though it would be a repeat of 2008, whereas in reality banks are quite conservatively-positioned this time compared to that era.
The biggest banks however, with large investment banking operations and primary dealer exposure, potentially have some stagnation ahead of them.
I view the sweet spot in terms of risk-reward to be the medium banks, the middle-country banks that mostly emphasize commercial banking rather than investment banking, but still have large geographic footprints. Some of them have very high dividend yields as well, which I view as reasonably safe going forward.
Here's the F.A.S.T. Graph of Truist Financial, which is in the top ten US banks by size but not the top five, and is the result of the merger between BB&T and Suntrust:
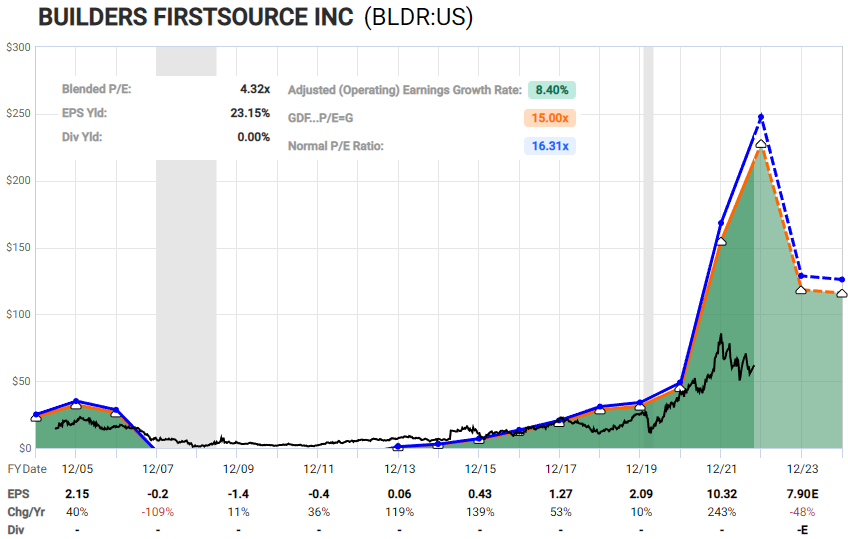
Builder's FirstSource vs Homebuilders
I view homebuilder companies as likely running into a period of stagnation. With much higher mortgage rates, many people don't want to buy or sell. However, I view homebuilders as already being cheap enough to reflect this likelihood; they are priced in such a way that if their earnings get cut in half, they're still cheap.
Early this year, I recommended and invested in a company called Cornerstone Building Brands. Two weeks later, it was acquired at a 50% premium to the entry price, and taken private. While I didn't expect that quickly of a payout, it was a testament to how cheap the company was relative to its quality.
A larger company in a similar industry to Cornerstone is called Builder's FirstSource (BLDR). This is a manufacturing company that makes lumber products, manufactured housing goods, doors, windows, and all sorts of products. In other words, they make products that homebuilders use. They also make products that contractors use to remodel or expand existing homes. Homeowners trapped into a low fixed rate mortgage that never want to sell, can still remodel or expand.
The 2020/2021 earnings spike is wearing off, but that still leaves the company super cheap. Meanwhile, the company operates in a highly fragmented industry, acquiring smaller housing manufacturing businesses, and using extra money to buy back its own cheap shares. This one is pretty risky and cyclical, but I'm long-term bullish.
I think this is a reasonable opportunity to switch from homebuilders to home products manufacturers like BLDR.
Alibaba, Etsy, and eBay
I remain contrarian bullish on Chinese stocks, but with increasing geopolitical separation between the United States and China, I view the best way to own them as being through ETFs. It's best to keep Chinese stocks at arms reach due to potential delisting issues and similar things. I've incorporated this tactic into my various portfolios and am doing the same for the top 12 list by switching Alibaba out for Builders FirstSource in the aggressive section.
Online retail, including Etsy and eBay appear challenged at the time. I view eBay as likely undervalued, but I prefer the risk/reward over a 5-year period of switching to the defense/aerospace sector with Raytheon.
Final Thoughts
In my report from two weeks ago, I finished with a lengthy tactically bullish section. There is a lot to be bearish about that I've covered since December 2021, but many quantifiable measures of sentiment became overdone to the downside for many risk assets lately.
I don't normally make short-term calls, and of course I can never be sure of things, but there were enough charts at extremes, combined with the timing relative to the midterms, that put the probabilities significantly to the upside:
I want to tie a few things together as I finish this report to highlight just how many “rubber bands” are stretched in this market. I have a defensive outlook overall, but am sensing something sharp, at least briefly, in the other direction (up) for risk assets.
-Sunday, October 16th report
Since the close on Friday Oct 14th, the S&P 500 is up 8.8% and the equal-weighted version of the S&P 500 is up 9.37%. The Dow Jones, with its more value-tilt, was up 10.89%. That was indeed an unusually sharp rise for a two-week period.
Here's the equal-weighted S&P 500 ETF recently, with the green dot representing the close on October 14th:
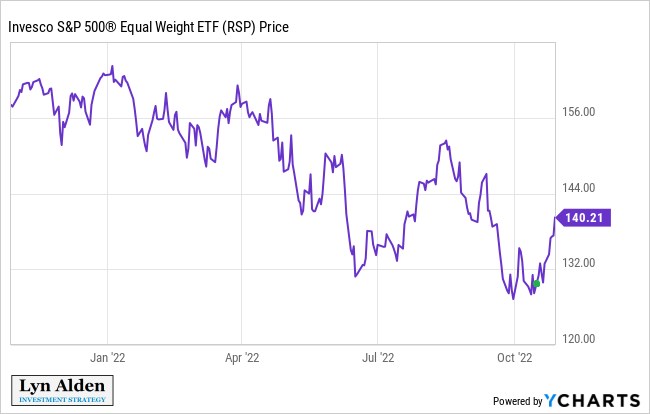
I think the easy part of that move is out of the way now. I think aspects of this rally could still have legs but my timing conviction is less clear now, and is back towards specific parts of the market rather than others.
I continue to be constructive towards good dividend-paying entities, such as certain pipeline businesses, certain banks, and a number of healthcare stocks. To the extent that I want to take risk outside of the dividend/value side of things, it's in assets like Brazilian equities, home products manufacturers, and bitcoin.
The part of the market that I have the most concern about is big tech. Apple (AAPL) for example has a price/earnings ratio of over 25, with 3-year analyst consensus forward annualized EPS growth of less than 6%. They also have a decent amount of exposure to China.
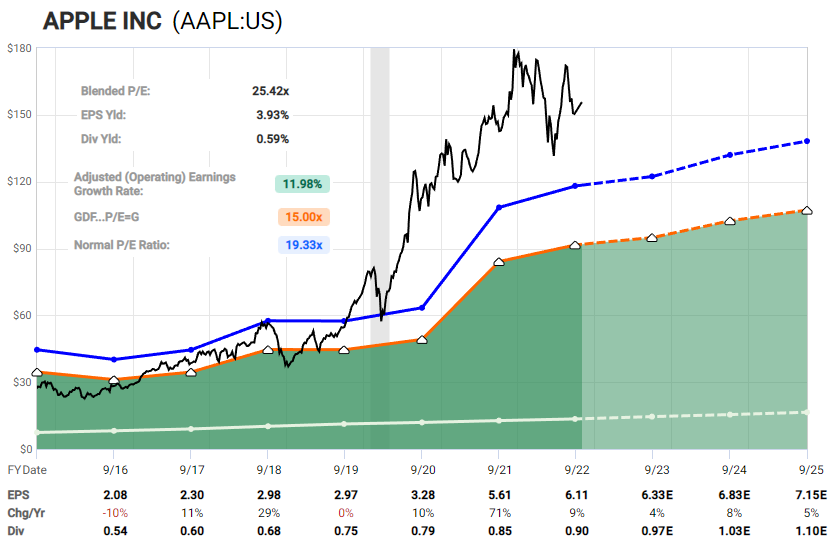
Chart Source: F.A.S.T. Graphs
Historically, the biggest stock by market capitalization doesn't do very well over the subsequent decade. And it's often due to valuation; the leading company for example could fall from having a price/earnings of 25x to 15x, and if it grows earnings by 5% per year for that decade, the stock price would be flat for the decade. That scenario or something similar to it would lead to a lower valuation on higher earnings per share.
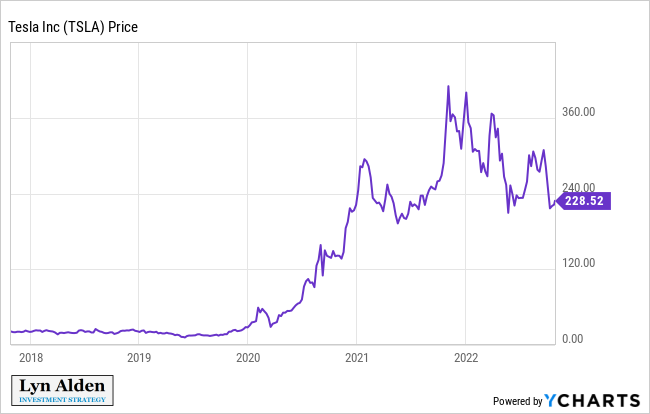
Tesla stock also looks heavy. They have considerable exposure to China and battery metal prices, and I'd expect their high-end cars to struggle in a recession. I'm not viewing it as a short opportunity at the moment, but it's on my radar as potentially becoming one.
I continue to view the 2020s decade as more value-and-physical than growth-and-virtual. The world had a huge build-out of social media and smart phones and digital advertising over the past decade, and an underinvestment in physical things like electrical grids, energy production, chemicals, refining capacity, and manufacturing.
That's not to say that the world won't keep getting more virtual (I think it will up to a point), but rather it's about which sectors have been underinvested relative to their needs, compared to which sectors are overflowing with competition and were overbuilt relative to their needs. And it's also about valuation, which doesn't matter much during structural trends but matters during major cyclical shifts.
