Deep Dive: Macro Update and Growth Analysis
 By
Lyn Alden
By
Lyn Alden
The macro section of this report focuses on energy, interest rates, and currency comparisons, and takes up extra length in this report due to the complexity of current macro conditions.
Then, there is a significant bitcoin and crypto update. Lastly, the stock section of this report highlights a number of companies and industries that still have favorable growth prospects for 2022 and 2023 at a time when analysts are rather bearish on growth expectations for the broad S&P 500.
Macro View
This continues to be a time with significant macroeconomic uncertainty, with energy shortages, central bank tightening, yield curve control, and other issues.
This section walks through updates on some of the major items impacting markets.
Energy News
WTI crude continues to trade at rather high prices, and has experienced extra volatility due to the war and sanctions.
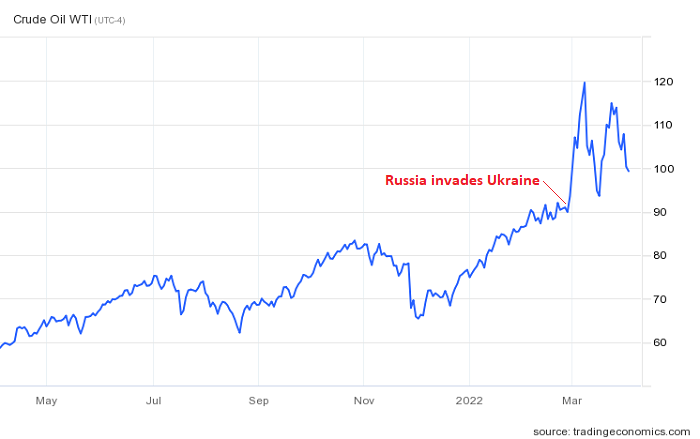
Russia has demanded that “unfriendly” countries, now including many European countries due to sanctions, begin paying for gas in rubles by opening a Russian bank account and doing a euro/ruble conversion. This has caused some recent market turbulence and confusion. Contracts are difficult to renegotiate in a short period of time.
Energy rationing is on the table in some European markets because if supply contracts break down, Europe has no immediate ability to replace all Russian natural gas with LNG. Such a transition will take a lot of time and expense. But also, Russia has no immediate ability to sell all of its gas elsewhere, either, and so it would lose that revenue. Therefore, ongoing Russia/Europe relations around gas deliveries remain tense.
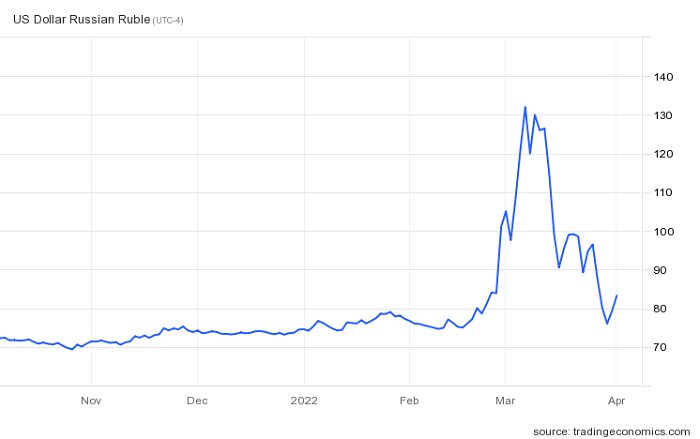
Meanwhile, the Russian ruble has recovered all of its losses vs the US dollar that it encountered since the day of its invasion of Ukraine. However, the ruble began slipping in the weeks prior to the invasion, and it hasn’t yet fully recovered to that level, but it’s close:
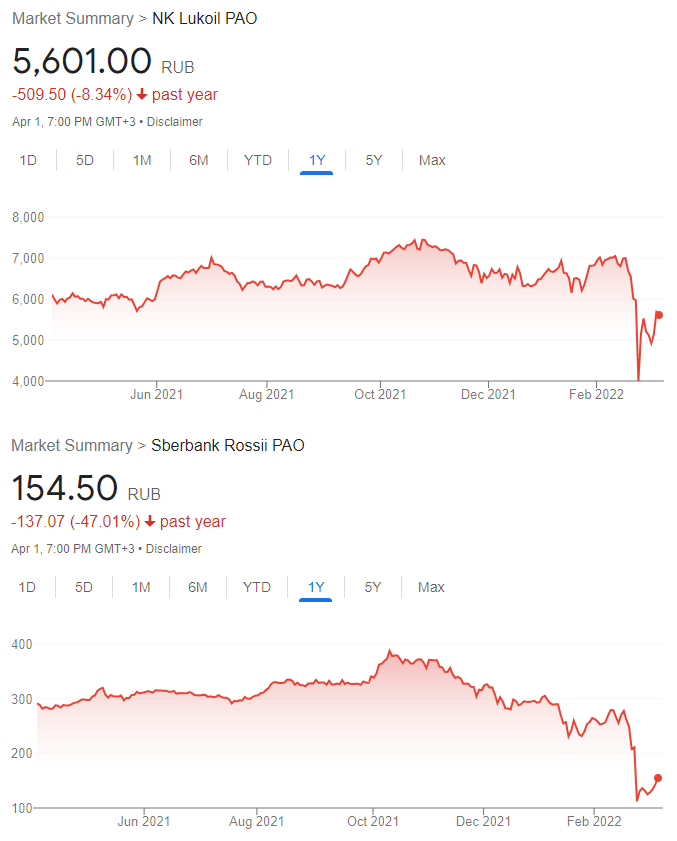
Although the US-dollar denominated ADRs and ETFs are not trading, ruble-denominated Russian stocks are trading again. Some like Lukoil have partially bounced back well considering the circumstances, while others that were more directly impacted by sanctions like Sberbank remain in a collapsed (but potentially bottoming) state.
If I were a domestic Russian investor, I’d be buying Russian stocks with a careful amount of capital (along with gold and bitcoin, and foreign assets where possible), but of course foreign investors have political and ethical realities to be aware of regarding any Russian assets now, so that market is not really investable for most people.
The war continues to rage on, with increasing civilian deaths in Ukraine. There have been reports of progress on ceasefire talks but nothing concrete yet, and there does not seem to be enough pressure to make Putin pull back, even though the speed of the war is clearly going much more slowly than he anticipated. Latin American countries, African countries, and most Asian countries have avoided sanctioning Russia because they rely on Russia’s commodities.
As a financial analyst, I’m mostly focusing on the numbers/finances/commodity situation in my professional work, even though the overall humanitarian story is the bigger picture. There are plenty of journalists covering details around the full situation, including several specific atrocities that are happening in Ukraine. A lot of people in Ukraine and Russia are suffering from these decisions.
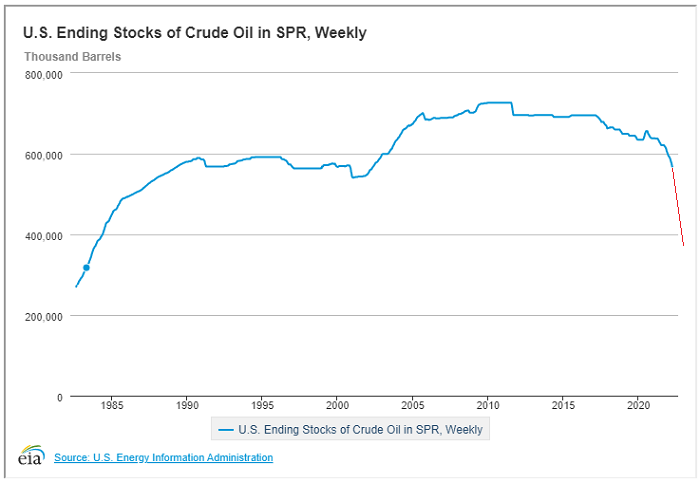
In recent days, President Biden directed the US Strategic Petroleum Reserve to begin releasing 1 million barrels of oil per day for the next six months, totaling around 180 million barrels in total drawdowns by the end.
The pro argument for this action is that it is a counter-cyclical release into a high energy price environment, which can lower prices and help the most vulnerable people afford necessary energy, during a war that is reducing energy availability. The con argument is that this is a political decision in the months leading to the mid-term elections, and that this situation doesn’t represent an actual energy crisis in the US to use this strategic reserve for (unlike Europe, which has an actual energy crisis).
President Trump drew down the Strategic Petroleum Reserves despite being a low energy price environment, which President Biden continued. The proposed sharp drawdown under President Biden in red, if completed to the full amount proposed, would consequently bring it to the lowest level since the mid 1980s.
When looking back at the full 2020s decade, I think we’ll be surprised at how high the oil prices reach at some points, although it won’t be a straight line higher. I’m somewhat skeptical about the sustainability of huge near-term spikes in the oil price, but I’m quite bullish on longer-dated oil futures, as well as oil producers. The same is generally true for gas and uranium.
Multiple signs continue to point towards structural energy shortages in the years ahead. Rationing can mitigate price spikes, but will hurt economic growth and quality of life. So with a combination of tight supply offset by possible periods of demand destruction, the price chart could be messy but this is an industry I definitely want exposure to.
As Europe tries to diversify its energy sources away from Russia, including buying more American gas, that can eventually raise prices for Americans. Natural gas is a less fungible/transportable product than oil so there tends to be much larger price differences between regions, but extreme price differences (like we’re seeing now) eventually result in supply responses and new infrastructure to arbitrage those differences.
Meanwhile in the US, shale oil and gas producers are still drawing down their drilled-but-uncompleted well count:
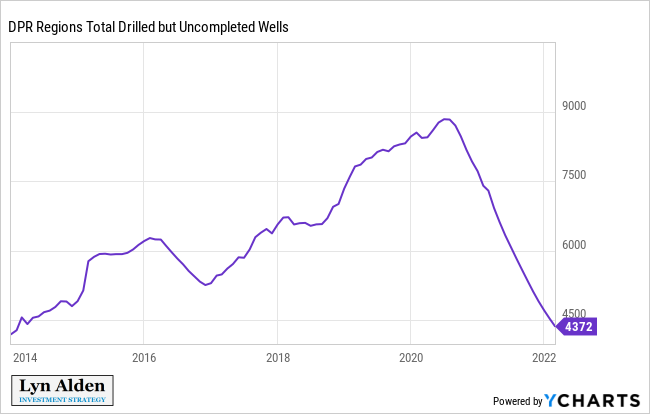
These are wells that had capex put into them already but are waiting for completion. The producer can complete them when the price is right, and get a pretty cheap source of oil.
For years, there was a structural increase in this number; oil companies were starting more wells than they were completing, and thus building up a stockpile of partially-completed wells that they could tap into later. For the past year and a half, there has instead been an unprecedented drawdown in drilled but uncompleted wells; oil companies are completing wells far faster than they are starting new ones. In other words, there continues to be a relative lack of capex, and US shale oil supply growth is not sustainable without more capex.
The most commonly cited reason for this lack of capex among CEOs is shareholder preferences. For years, oil companies were rewarded by investors for growing, even if that growth was unprofitable, and they destroyed a lot of capital in the process by creating too much supply, resulting in low oil prices, until shareholders were tired of losing money. So, shareholder preferences shifted towards capital restraint and shareholder returns, to focus less on growth and more on profitability, debt reduction, and dividends. Additionally, many other pools of capital stopped investing in the industry for ESG reasons, which increases the cost of capital and forces the industry to be more free cash flow positive and to fund its capex from cash flows rather than equity and debt issuance.
The oil and gas industry has had terrible returns for 10-15 years due to the structural increase in US shale oil supply and a long cyclical period of slower growth and low prices. Plus, oil companies have been told for years that demand for their product is going to collapse soon due to renewable energy sources and electric vehicles. And now that energy prices are spiking, they are being told that it’s transitory, that high prices will result in demand destruction and thus lower prices, etc. Who, then, would put a lot of long-term capital to work to bring expensive sources of new supply to market? Does any CEO want to be the guy that ramps up expensive drilling at the top of the cycle?
Oil prices unfortunately probably need to be high for longer, to get more capex into the space. It took years of oversupply and low prices to convince oil companies to stop drilling so much. Similarly, it’ll likely take years of undersupply and high prices to convince them to start drilling a ton. These things don’t turn on a dime which is part of why commodity cycles are so volatile in both directions.
Battle of the Yield Curves
The 10-year minus 2-year Treasury yield curve inverted this past week, which is broadly considered a reliable recession signal (although that signaled recession typically doesn’t happen for some time). The gray bars on this chart are recessions:
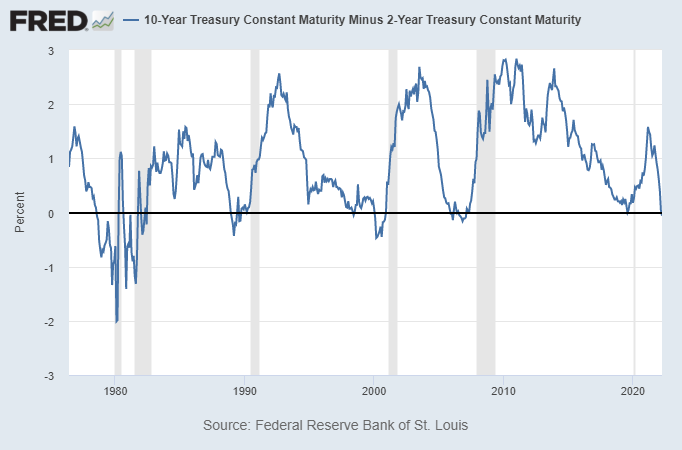
Chart Source: St. Louis Fed
The 10-year minus 3-month curve is still very steep, suggesting no recession. That’s historically a slightly more reliable curve than the 10-year minus 2-year curve. And if we split the difference between the two, and look at the the 10-year minus 1-year curve, that is still very steep as well. This is because the market has priced in a lot of expectations for Fed rate hikes in the 2-year curve that haven’t materialized yet in these shorter-duration curves.
The blue line in the chart below is the 10-year minus 3-month yield curve, and the red line is the 10-year minus 1-year yield curve:
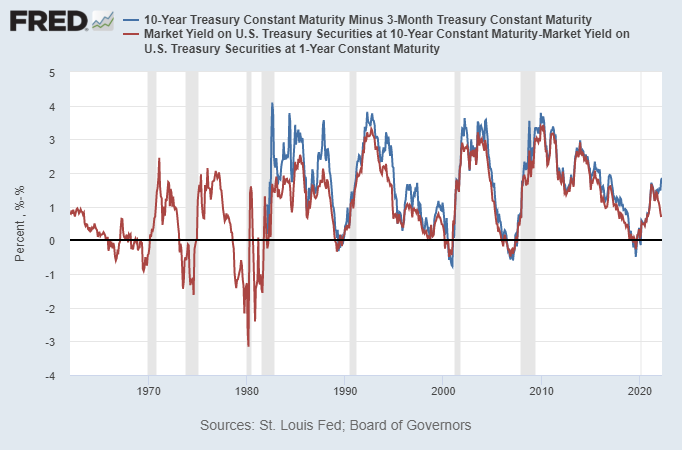
Chart Source: St. Louis Fed
Another way to quantify this is to look at the percentage of all possible Treasury duration pairs that are currently inverted:
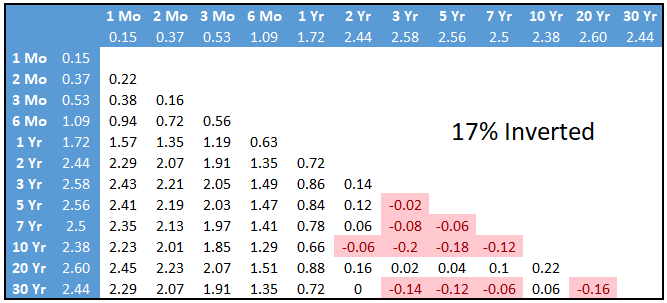
Chart Source: Lyn Alden
Jeffrey Kleintop, the Chief Global Investment Strategist at Charles Schwab, posted a great chart showing that usually before recessions, over 50% of the Treasury curve is inverted:
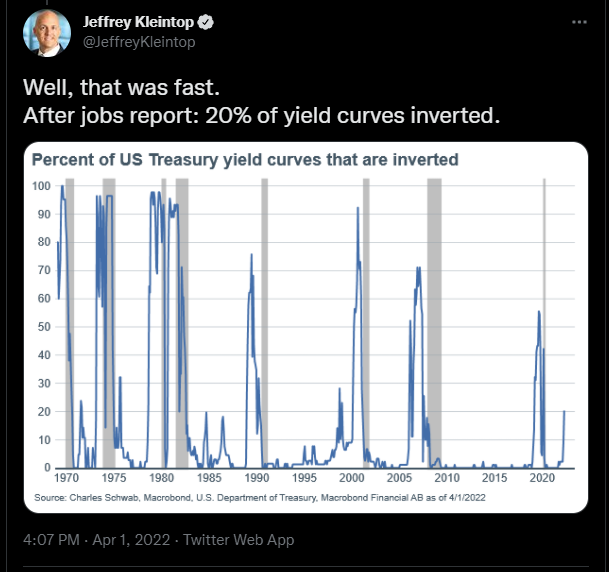
Chart Source: Jeffrey Kleintop
Collectively, the yield curve is starting to flash danger, but is not yet past the event horizon that has invariably signaled a recession.
Meanwhile, consumer sentiment is below 60, which is already at recessionary levels. And the Fed is hiking rates into that low sentiment (when normally they would be cutting rates with this low sentiment), which hasn’t happened since Paul Volker, four decades ago. And when Volker did it, debt as a percentage of GDP was low, not high.
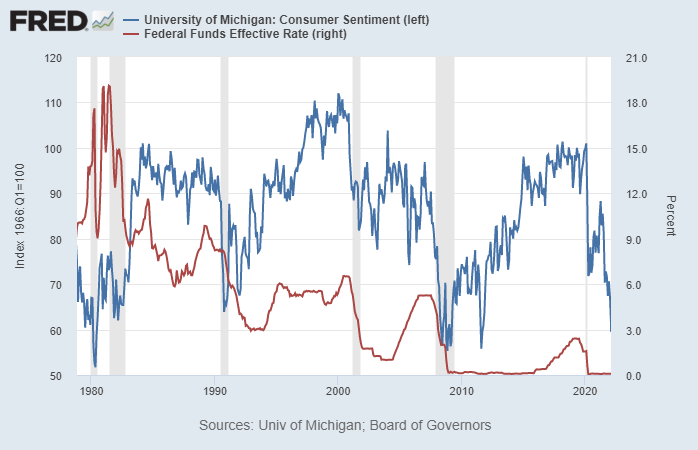
Chart Source: St. Louis Fed
People are being squeezed by inflation, with wage growth being outpaced by consumer price growth. That’s a classic stagflationary environment, and is hard for either fiscal policymakers or monetary policymakers to address. It’s in large part a supply-side problem, as well as a problem with the structure of the global financial system itself.
Similarly, hedge fund manager Teddy Vallee shared a great chart the other day. It shows their firm’s custom index of China credit leading indicators in blue along with the US ISM purchasing manager’s index in black:
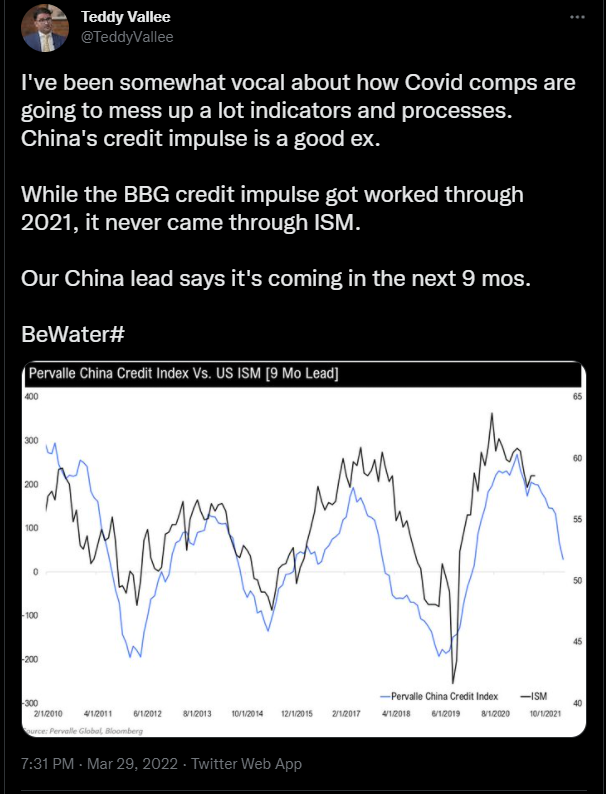
Chart Source: Teddy Vallee
What it is showing is that the rate of change of the US economy has been tightly correlated to the Chinese credit cycle over the past decade, with a 9-month lag. And if that relationship continues to hold, China’s recent credit contraction cycle will likely continue to ripple through the US economy over the next two quarters.
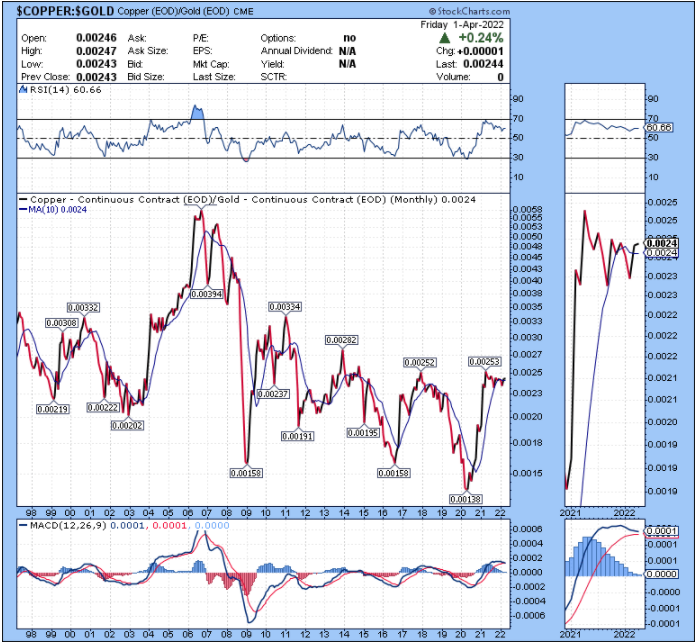
Zooming out, the copper/gold ratio and the ISM PMI charts are suggesting that we’re entering a period of economic weakness in the US.
Here’s copper/gold:
And here’s the ISM PMI:
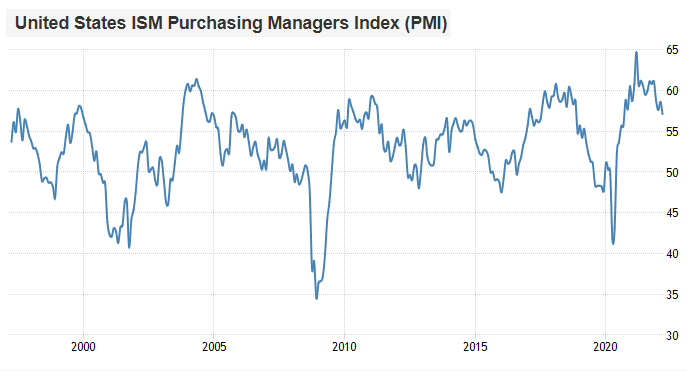
Chart Source: Trading Economics
On the other hand, US banks are still seemingly in lending mode, which suggests that the economy is still early in the economic cycle. This suggests no recession on the near-term horizon, but certainly allows for a period of economic softness:
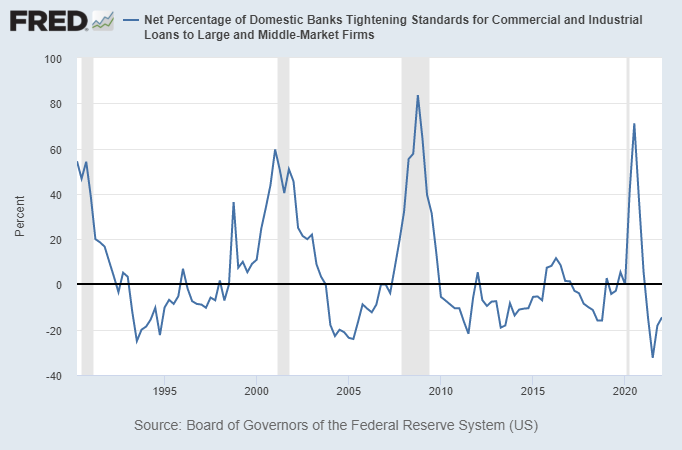
Chart Source: St. Louis Fed
The highest inflation of the past four decades, and the disruption in commodity markets and supply chains, can make things happen quicker. A number of indicators are likely less reliable in this environment than usual, but we still must be aware of them and parse them for meaning to the extent that it’s possible.
I continue to like gold, bitcoin, and commodities as part of a diversified portfolio in this environment for this reason. I also like defensive equities in general, with a smaller allocation to more aggressive equities. I’m increasingly cautious on consumer-oriented companies, because consumers are having their discretionary income squeezed. Cash-equivalents continue to be useful for rebalancing and protection against liquidity shocks.
Currency News
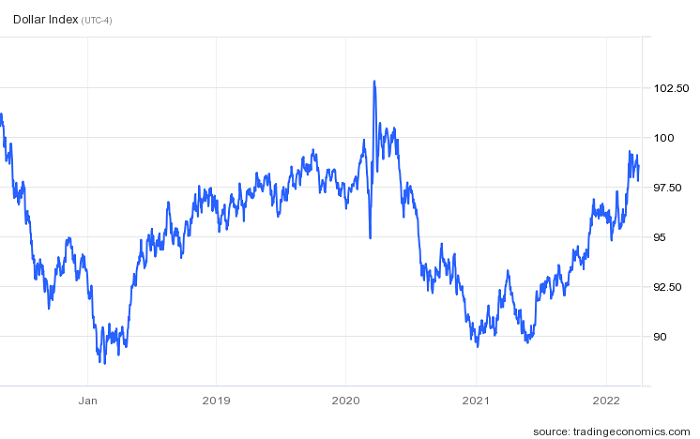
The dollar index continues to be strong, but with narrow breadth. In other words, it is less about dollar strength against all currencies (e.g. the dollar is down vs the Chinese yuan, the Brazilian real, and some other currencies over the past year) and more about euro and yen weakness specifically.
Here’s the dollar index (mainly vs euros and yen):
And here’s the dollar vs the yuan:
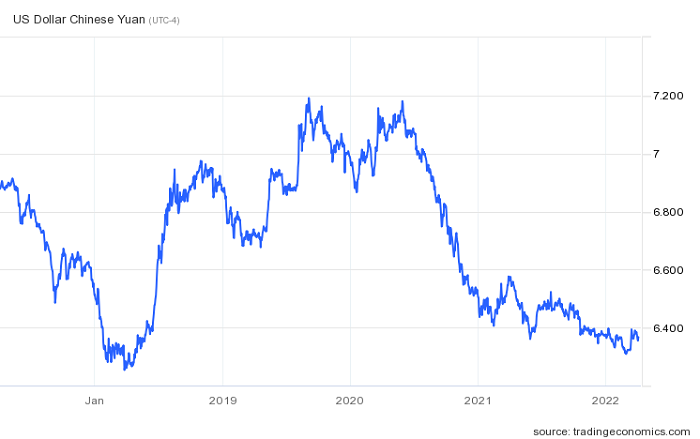
Notice the big correlation between those two charts until 2021, where they completely diverged. The yuan mildly strengthened against the dollar in 2021, while the dollar significantly strengthened against euros and yen. This has continued into 2022.
European countries are broadly facing an energy crisis, which is obviously bad for their economy and currency.
Meanwhile, Japan is doing formal yield curve control, meaning that the Bank of Japan has an official unlimited bid for 10-year Japanese government bonds at 0.25% yields to peg yields below that level. If yields are not allowed to rise to market-clearing levels, then the market instead takes it out on the currency, and that’s what we’ve seen with the yen recently. They also have an energy/commodity import problem, similar to Europe.
I have a moderately favorable view towards Latin American assets and southeast Asian assets generally, and the same is true for Chinese assets but with an awareness of geopolitical risk (which necessarily impacts position sizing).
The 2020s decade continues to be defined by de-globalization and supply-side scarcity, in contrast to the globalization and supply-side abundance of prior decades. My public newsletter from two weeks ago went into some of the ramifications of this.
Back in 2020 with my article on the fraying petrodollar/eurodollar system, I discussed the idea that the dollar-centered global financial system is running into structural issues for both the US and other countries, and that payment channels and reserve holdings are likely to be more diversified going forward. Much like how COVID-19 accelerated the inevitable technological remote work trend, the war in Ukraine seems to be accelerating this inevitable technological diversification of payment channels and reserve assets on the global field. I updated this view with my recent article on the nature of money.
A few days ago, Reuters and others reported that Brazil substantially increased the yuan weighting in their currency reserves over the past year, albeit from a small base:
BRASILIA, March 31 (Reuters) – Brazil’s central bank more than quadrupled its foreign reserves in Chinese yuan last year, policymakers reported on Thursday, as it trimmed holdings of U.S. dollars and euros and built Brazilian reserves of currency from its biggest trade partner.
The Chinese currency, which until 2018 was absent from the forex reserves of Latin America’s largest economy, rose to 4.99% of Brazilian central bank holdings at the end of last year, from 1.21% at the end of 2020.
That gave it the third largest share of the central bank’s reserves, slightly behind the euro, which fell to 5.04% last year from 7.85% in 2020. Dollar reserves fell to 80.34% of the total from 86.03% a year earlier.
I think we’ll continue to see some degree of currency reserve diversification among countries in the years ahead, especially for ones who have China as their single largest trading partner. Gold should continue to be attractive to central banks as a neutral reserve asset as well, especially during a period of negative real interest rates on bonds and currency.
Bitcoin Note
Bitcoin had a price breakout above its recent resistance. I don’t know how durable it is, but I’m keeping my eye on it for sure:
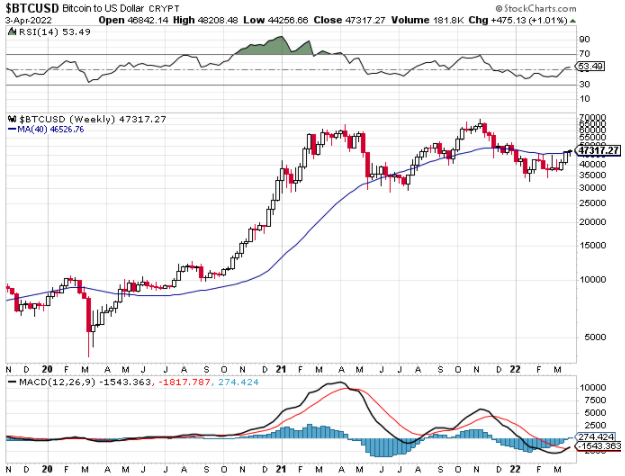
I continue to view dollar-cost averaging as the best way to get exposure to bitcoin for most people that want some as part of their asset mix.
Most indicators suggest that bitcoin is in a historical value region and thus that it’s a good time for long-term accumulation. However, the bitcoin price also tends to face turbulence when the US economy is slowing, as it is currently.
Being such a young asset, the sample size for that observation is not very large, and ultimately I think it will come down to whether the Fed creates a liquidity crisis or not. And if bitcoin acts like a commodity (i.e. with no margin pressure to worry about), then a stagflationary environment could be the type of environment where it decouples favorably from US equities. This is the first serious stagflationary environment in developed countries since bitcoin’s inception.
I continue to view bitcoin as a good structural long idea, ideally as part of a diverse portfolio with some liquidity on the side to rebalance into any big dips that might occur along the way.
Luna Defense Guard Bitcoin Accumulation
Some of this recent bitcoin breakout was probably due to over $1.3 billion worth of bitcoin purchases by the Luna Foundation Guard, which plans to buy $3 billion in bitcoin for reserves, and to eventually increase that reserve to over $10 billion.
I’ll rewind a bit and explain what the heck that means.
Terra is a proof-of-stake smart contract cryptocurrency based around algorithmic stablecoins, and particularly around TerraUSD or “UST” which is their dollar stablecoin. Unlike USDT or USDC, which are custodial stablecoins (where centralized entities hold fiat dollars as assets and issue redeemable stablecoin tokens representing those assets), UST is an algorithmic stablecoin. This means that it approximates the value of a U.S. dollar but does not hold U.S. dollars.
The way this works is that Terra’s primary token, LUNA, serves as the volatility offset for UST. If UST goes above $1, there is an arbitrage opportunity to burn LUNA and create more UST. If UST goes below $1, there is an arbitrage opportunity to create LUNA and burn UST. UST is supposed to remain around $1, while LUNA is allowed to be volatile. The more demand there is for UST over time, the higher UST and LUNA market cap should go. It’s like a central bank that tries to incentivize market participants to do both sides of open market operations.
However, if LUNA’s price does not keep pace with UST market cap expansion, then UST can become less and less “backed” by LUNA over time. That’s a general trend we’ve been seeing since late 2021 when UST demand started to take off. At this time, it’s still over 200% backed, but declining fast.
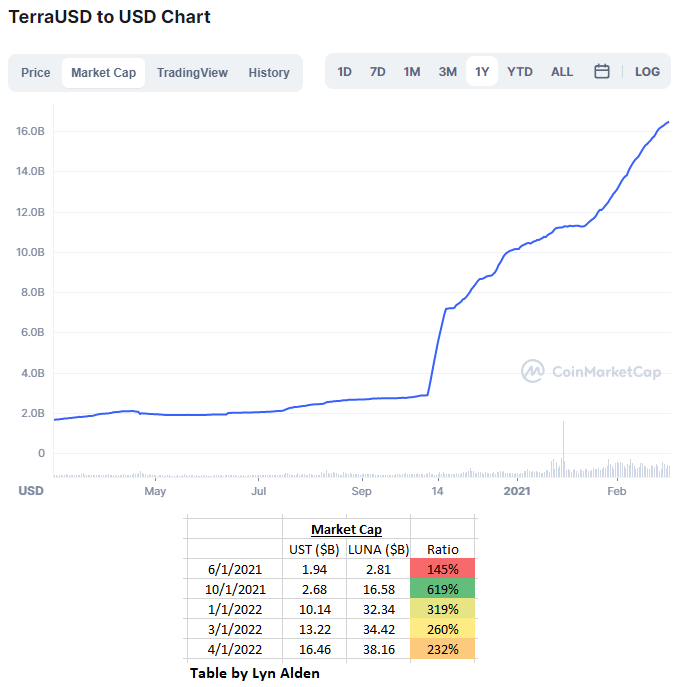
Terra is now the second biggest ecosystem in DeFi based on total value locked:
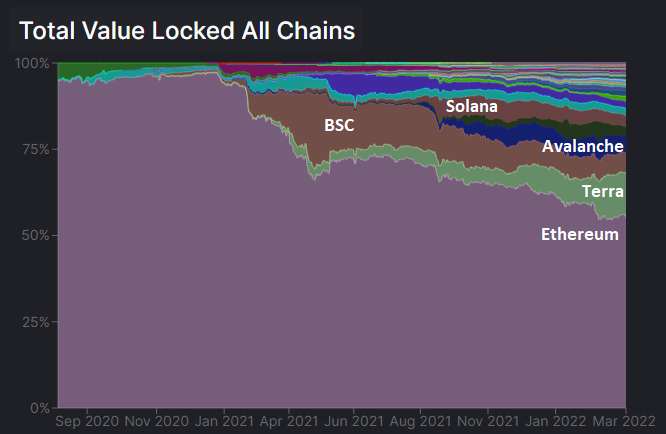
Chart Source: DeFi Llama
The catch? Well, the huge demand for UST is almost entirely driven by unsustainably high yield farming opportunities, much like other DeFi ecosystems. Investors have been able to earn nearly 20% yields on UST in Terra’s Anchor protocol due to various arbitrage opportunities, and that looks like it is starting to dry up. If that VC-supported yield opportunity dries up, UST demand will likely decline. If UST demand shrinks, it could cause a negative feedback loop and liquidity problems for both UST and LUNA, also known as a “death spiral” where tons of capital pulls out of the Terra ecosystem, which crashes the price of LUNA and then eventually breaks the UST peg. If that occurs, it’s functionally very similar to an emerging market currency crisis.
Unlike bitcoin which has no centralized foundation for it, most smart contract blockchains have specific for-profit or nonprofit organizations that serve as their central promotion and development hubs. Terra has Terraform Labs. Solana has the Solana Foundation. Ethereum has the Ethereum Foundation. Avalanche has Ava Labs. These are generally founder/VC-supported entities, with specific leaders and employees trying to promote and develop their ecosystems, and they often use token pre-mines as starter capital.
Terraform Labs and other parties raised capital to set up the Luna Foundation Guard, which will act as a second layer of defense for the UST/USD algorithmic peg rather than that peg relying entirely on LUNA. As they describe it:
In connection with its stewardship and support of the Terra ecosystem in general, LFG is establishing a decentralized UST Reserve protocol – a non-profit initiative to provide a further layer of support to ensure that UST maintains its peg. In an event where the market price of UST materially deviates from the USD peg, holders of UST will be able to close the arbitrage and bring the market price of UST back to the peg by swapping UST for major, non-correlated assets like BTC that capitalize the reserve. The reserve functions as a release valve for swelling pressure to exit UST to LUNA on-chain, dampening the reflexivity of the system by reducing the dilution of the LUNA supply during severe contractions and restoring the peg in real-time and maintaining an alternative arbitrage opportunity outside of the Terra protocol itself.
One way to think of this is that it’s similar to a country’s sovereign reserve. During good times, an emerging market can use accumulated trade surpluses or currency sales to increase its reserves of foreign assets, such as gold or dollars or euros. Then, if the country later experiences a recession and currency crisis, it can defend the value of its currency by selling some of those reserves that it previously stockpiled, and using the proceeds of those sales to buy back some of its currency units from those that are selling it.
On one hand, Terra buying a lot of bitcoin is bullish for bitcoin… at first. LFG could have bought USDC or USDT as reserves. They could have bought ETH as reserves. They could have bought a mix of these assets as reserves. But instead, they bought BTC as reserves, having judged that to be the best one for the purpose of holding perpetual, decentralized, pristine collateral with minimal counterparty risk. This further validates the argument that bitcoin is the best digital reserve asset. And now, the bigger the Terra ecosystem gets, the more demand they expect to have for their BTC reserve. Eventually as they expand onto other platforms, they intend to add small amounts of other tokens as reserves. For example, to the extent that they expand usage of UST into Solana’s ecosystem, they expect to bring some SOL into their reserves. Their stated expectation is to have BTC be the primary reserve asset along with LUNA, and smaller allocations to other tokens.
On the other hand, this presents a future risk for the bitcoin price. If Terra encounters a problem and is forced to sell a lot of bitcoin to defend its UST peg, it will be detrimental to price in a similar way that their current buying is favorable to the price. Terra’s unsustainable Anchor protocol with 20% yields results in a lot of UST demand, and with this new reserve practice by Terra, UST demand now results in BTC demand. This can be thought of as a source of indirect, artificial, or unsustainable BTC demand, which should eventually dry up. Active bitcoin traders should keep an eye on Terra’s LUNA and BTC reserves relative to UST market capitalization because if it starts to break down and they are forced to defend the UST peg, we could see tens of thousands of coins worth of rapid BTC selling pressure. I’m not saying that will happen but it’s a new factor to monitor going forward.
Larsen/Greenpeace Advertisement
In other news, Chris Larsen is funding a $5 million advertising attack against bitcoin’s proof-of-work energy usage, in a partnership with Greenpeace and others.
Chris Larsen is the co-founder and executive chairman of Ripple, a company that is the centralized creator of the XRP token. Ripple is currently being sued by the SEC for allegedly selling unregistered securities (the XRP token), and that lawsuit has gone on for a while. Ripple has also generally failed to get their XRP token network effect to catch on over the years, even though it was created back in 2012. A lot of founders across the crypto space have a negative view of Ripple and their practices over the years.
Ripple, like many other centralized cryptocurrency creators, has an incentive to criticize bitcoin so that they can promote their coin instead. Some of them like Terra do not do this and instead market themselves as being useful alongside bitcoin, but many altcoins do attempt to replace bitcoin. The general approach of these altcoin attacks on bitcoin is to obfuscate trade-offs that their system makes compared to bitcoin, mainly around their own systems’ comparatively high levels of centralization vs the quite-decentralized bitcoin network.
Larsen wants bitcoin to switch to proof-of-stake. Ironically, a proof-of-stake version of bitcoin already exists (anyone can fork the code and make one), and is basically worthless in terms of price and usage. Since genuine bitcoin’s ruleset is defined by tens of thousands of independent nodes, there is basically no way to force updates into the system, which is what makes it the most immutable blockchain and is what gives it a monetary premium. It only upgrades via backwards-compatible opt-in upgrades (aka “soft forks”).
I wrote an article last year analyzing bitcoin’s energy usage, with the general conclusions being that 1) bitcoin energy usage is trivial compared to its purpose, 2) the bitcoin network is designed to get more energy efficient every year as the block subsidy declines and additional layers build on top of the base layer, 3) proof-of-stake has its use-cases but is no replacement for proof-of-work in terms of decentralization and security (which are the most important attributes of a blockchain) and 4) an increasing share of bitcoin’s energy consumption is stranded or wasted energy sources anyway, and bitcoin miners will increasingly act as load balancers for the grid (which is a net positive for renewable energy sources).
Lightning Growth
After a period of consolidation, capacity on the Lightning network (a secondary layer on top of the bitcoin base layer) seems to be heating up again. In particular, one of the largest crypto exchanges, Kraken, has integrated Lightning. Kraken’s node is quickly becoming one of the biggest nodes on the Lightning network. This chart is a couple days old so it’s probably bigger by now:
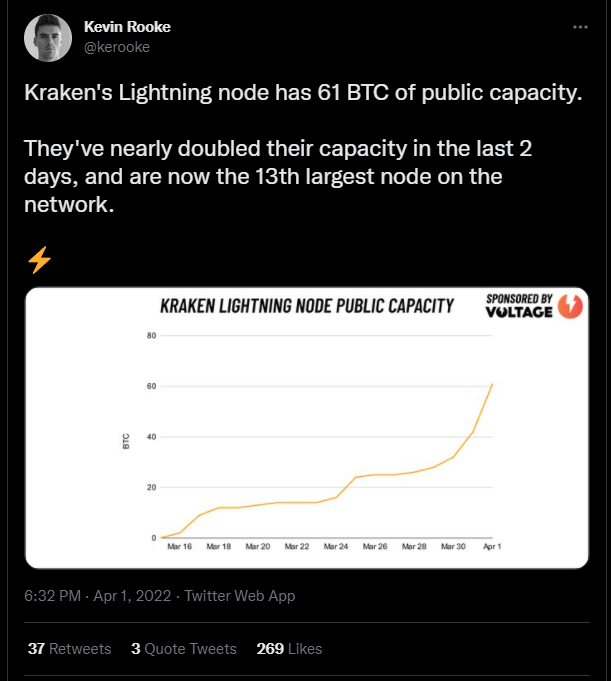
Chart Source: Kevin Rooke
The biggest annual bitcoin conference is taking place from April 6-9th in Miami, so there will be some big announcements coming up this week regarding bitcoin itself and the Lightning layer in particular. Some of the announcements are not public yet and other ones are.
As an example of an already-public one, Impervious is launching their browser on April 7th. This browser uses the Lightning network to send information, in addition to sending value. This information transfer includes peer-to-peer video, audio, messaging, decentralized storage, document collaboration, payments, cryptographic identity management, and more. Or as they currently like to market it:
Zoom, without Zoom.
Google Docs, without Google.
Medium, without Medium.
WhatsApp, without WhatsApp.
Payments, without banks.
Identity, without the state.
All without centralized intermediaries and built into the Impervious Browser.
This basically includes all of the things that the Web3 industry plans to do, but without a speculative token attached to it. And due to that lack of a speculative element, I don’t necessarily expect a huge initial surge of usage. But tools like this for decentralized value-sharing and information-sharing will increasingly be available for people who want to use them for practical purposes, and I’m bullish on this type of technology for the long run.
Smart Contract Note
Competition is heating up in the smart contract space, particularly between Ethereum and Avalanche.
Fees are very high on Ethereum, especially for high-velocity low-duration applications such as DeFi, so a lot of demand has shifted towards other smart contract blockchains with more scalability (typically at the cost of greater centralization and complexity). Basically, “distributed compute” is a rather commoditized service, and usage of this service should disperse into cheaper platforms over time, which is indeed what we’re seeing.
For example, here’s that DeFi TVL chart from DeFi Llama again:
There are different scaling approaches to try to minimize fees and increase throughput. Ethereum for example has turned to roll-ups as its scaling mechanism, with sharding being another possibility (their developer roadmap frequently changes, based on new tech that starts catching on). Avalanche instead uses subnets for scaling, and recently has been taking some of Ethereum’s market share.
This past month Avalanche launched a $290 million incentive called Avalanche Multiverse to bring DeFi and crypto games to its subnets. And in recent days as an early example of this, the crypto game DeFi Kingdoms ported over to a new subnet on Avalanche.
Meanwhile, an Ethereum sidechain associated with the current biggest crypto game, Axie Infinity, was exploited for over $600 million in value (denominated in ETH and USDC), which is one of the biggest crypto exploits in history so far. It apparently took six days for developers to notice the attack. As The Block reports:
-Ronin, an Ethereum sidechain built to support the play-to-earn game Axie Infinity, has suffered an exploit, developers said Tuesday.
-173,600 ETH (worth roughly $590 million) and 25.5 million worth of the stablecoin USDC were lost.
In other news, OpenSea, the largest marketplace for art-based NFTs, is reportedly integrating Solana onto its platform. Ethereum still retains the vast majority of NFT market share, unlike DeFi where Ethereum is quickly distributing market share over the past year to competitors. The diversification of OpenSea across multiple layer one blockchains could eventually distribute NFT market share in a similar way that DeFi market share has been distributed.
NFT trading is somewhat lower-velocity and longer-duration than much of DeFi, so there has been less fee pressure to move away from Ethereum. However, the high fees are still an issue over time, especially for low-price NFTs. Solana represents a lower-fee and higher-throughput (and more centralized) smart contract platform than Ethereum with DeFi and NFT capabilities.
Overall, I continue to be somewhat bullish on the more scalable smart contract chains (Solana, Avalanche, Terra, etc) relative to Ethereum for the intermediate term. Users primarily seem to favor a better user experience and low fees, rather than maximizing decentralization, for these types of use-cases. In the long run, I consider all of these types of coins to be speculative digital equities and thus recommend significant caution before considering to put any serious capital into them.
Vitalik Buterin posted a good chart a couple days ago using data from Messari (albeit as part of an article he published on April Fools Day). It shows the date of the blockchain launch on the horizontal axis, and the size of the pre-mine for insiders on the right axis. It doesn’t include every blockchain of course, but it has a lot of the majors:
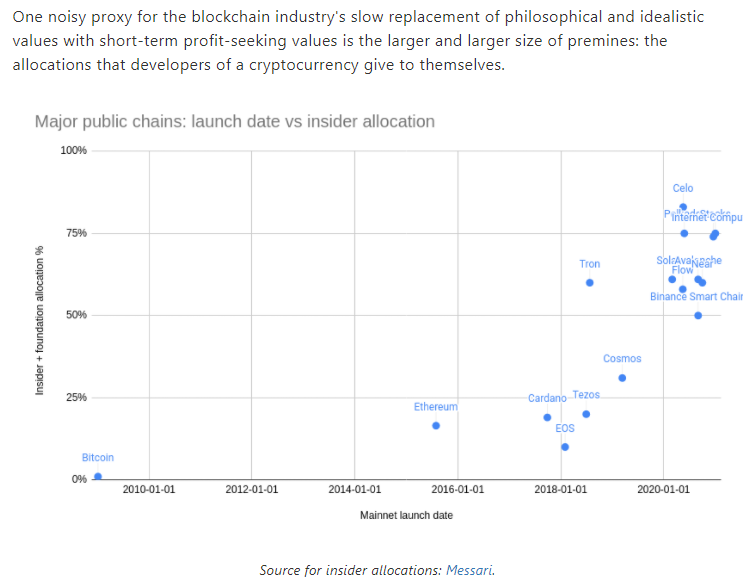
Chart Source: Vitalik Buterin
Bitcoin is on the left, with zero pre-mine. Satoshi absorbed all of the development time/costs, gave himself no initial pre-mine from the launch, mined bitcoin alongside everyone else in the early years to keep the network running, and then never sold a coin. Next on the chart is Ethereum, although we should add the caveat that many of the non-insider initial investors were anonymous, could have actually been insiders, and thus we cannot verify the true percentage of the pre-mine that went to insiders. And then as we get into the recent batch of blockchains, they have huge and well-known insider allocations.
Along these lines, the current digital asset ecosystem startup environment is very different depending on what part of the ecosystem you look at.
Bitcoin-Focused Startups
VCs and developers that build things on top of bitcoin today are consciously forgoing digital seigniorage when they do so.
Projects in the bitcoin ecosystem tend to have a pretty high utility-to-speculation ratio, meaning they are trying to solve real-world problems rather than focusing on speculation or financialization. Bitcoin-focused companies tend to work on things like collaborative custody solutions, better wallets, payment solutions, peer-to-peer information transfer, mining-related liquidity provision, and so forth.
Startups in this bitcoin-only industry use the established startup route of issuing normal illiquid seed and venture equity with a long-term exit horizon, rather than initial coin offerings. The Impervious browser is a good example; this is a company that is basically offering all the popularized applications of Web3, but doing so without a speculative token attached to it and instead is just doing it on the bitcoin network. Have most people heard of it yet? No.
The downside of this long duration approach is that the seed/venture deals in this ecosystem are much smaller; we likely won’t see bitcoin-only firms named on major sports stadiums any time soon like what we’re seeing with broad crypto firms. And without a speculative incentive mechanism, it generally means slower adoption based on needs, rather than immediate adoption based on arbitrage opportunities and VC-funded temporary incentives to get users in quick.
Altcoin-Focused Startups
In contrast, VCs and developers on more recent blockchains tend to emphasize more speculative sorts of things, like DeFi, play-to-earn gaming, NFT trading, paid incentives for initial use, and so forth.
Going the token route provides fast exit liquidity for VCs, in contrast to traditional long illiquid holding periods for startup seed/venture investors. It also creates gambling/gaming opportunities to incentivize speculators to participate from the day of launch.
This approach pays off bigger in the near term, with much more capital raised for these types of entities, and being able to afford naming rights of sports stadiums and that sort of thing, but a lot of what gets built becomes self-enriching rather than fixing an actual problem. It remains to be seen what percentage of the products built by this industry will have long-term staying power.
Portfolio Updates
The portfolios are available in my Google Drive.
Newsletter Portfolio
-Sell FB from the growth stock pie. Increase ADBE and FISV each from 8% to 12%. Increase AMZN from 10% to 12%.
I’m not bearish on FB and actually think it might be bottoming here, but I like some of these other opportunities better. ADBE in particular has been killed lately and I think it has a bright future. This seems like a decent time to lock in some capital gains tax losses and move capital around to high-conviction areas that have also sold off.
Fortress Income
-No current changes.
ETF-Only Portfolio
-No current changes.
No Limits Portfolio
-Sell HTHIY. Buy 5 more shares of CI and 2 more shares of MSTR.
I continue to like HTHIY but I have moderately higher conviction in CI and would like to consolidate here.
Top 12 List
-No current changes.
Other Holdings
-No current changes.
Stock Analysis
Consensus analyst expectations are for pretty weak adjusted earnings growth for the S&P 500 in the coming year:
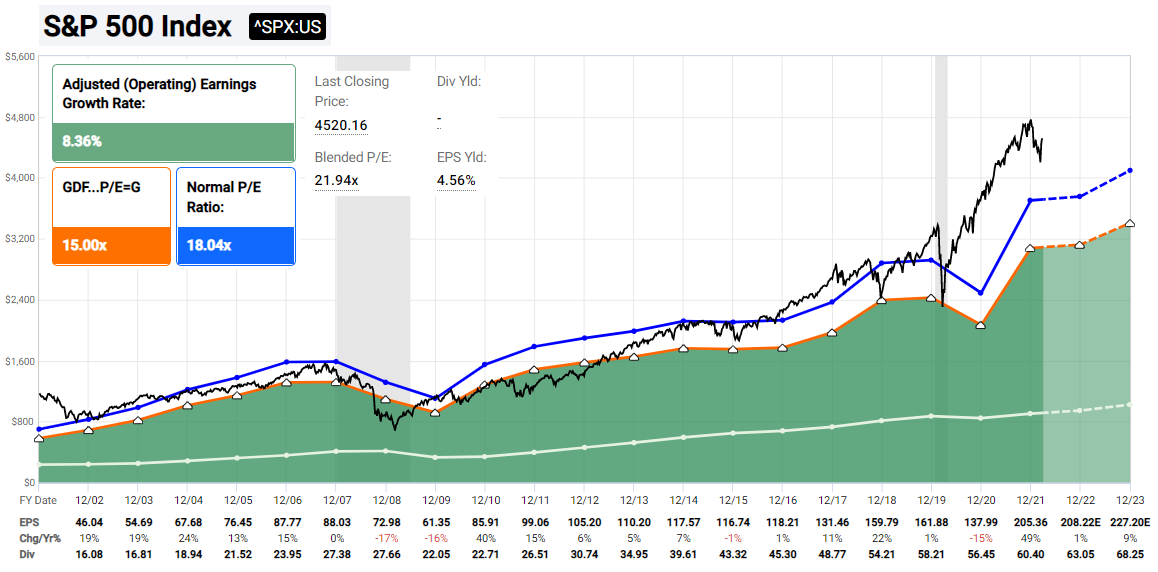
Chart Source: F.A.S.T. Graphs
With stressed consumers and declining PMI, this isn’t surprising. The question then becomes, where can we find growth in this environment?
Cigna (and broadly, healthcare)
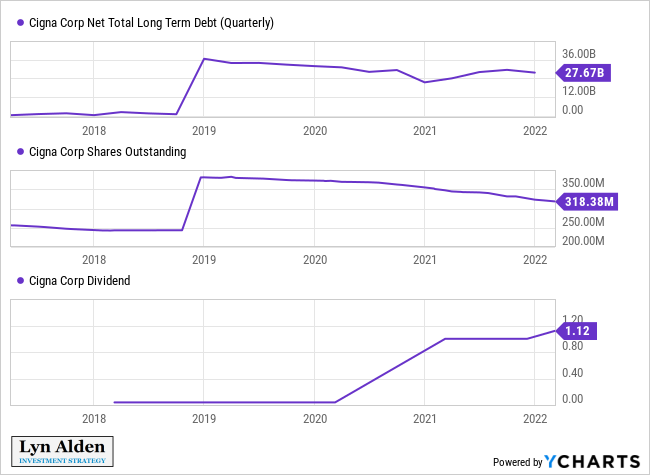
For starters, I’m going to continue to pound the table on healthcare companies, including Cigna (CI):
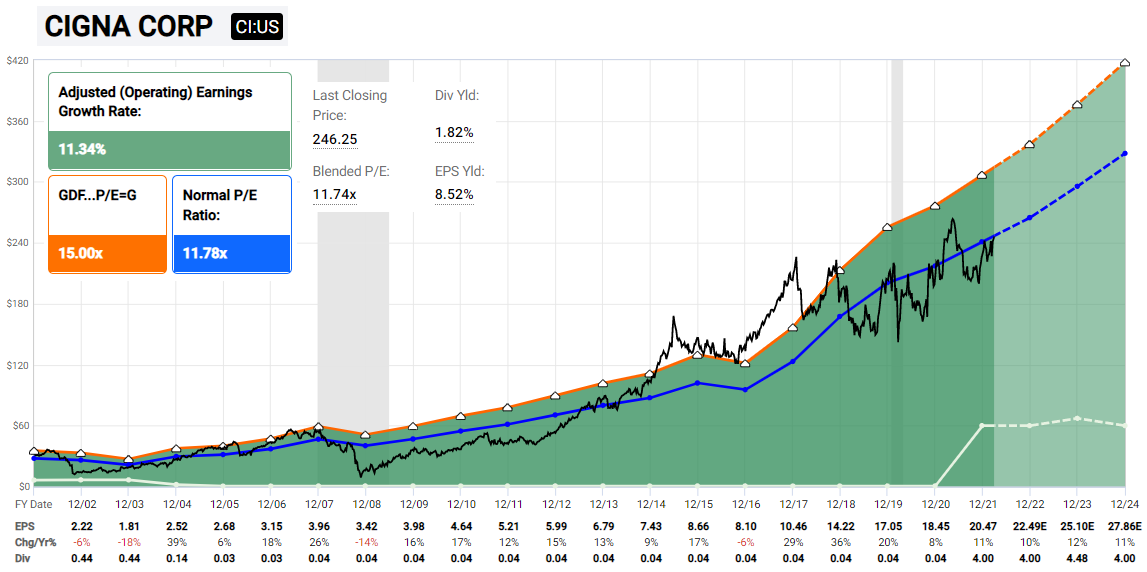
Chart Source: F.A.S.T. Graphs
This company continues to expand, while shifting towards being a dividend growth company that is paying down acquisition-related debts and reducing its share count.
Schlumberger (and broadly, oil services)
Secondly, we can look at some of the enablers of the oil and gas producers. I have been focused on oil and gas producers as part of my bullish energy theme, but what about companies that sell technology to them? Analysts are very bullish on Schlumberger (SLB) in the coming few years:
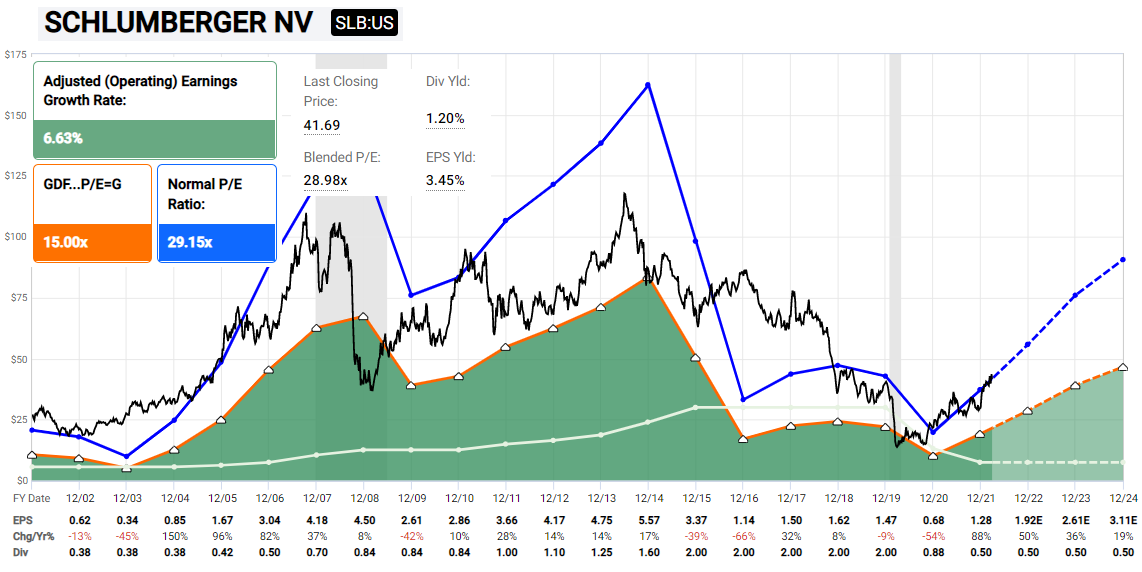
Chart Source: F.A.S.T. Graphs
Most of the capital they make is expected to go towards rapid debt payoff, which will strengthen the balance sheet. They are coming out of 2020 with a deep value impaired position, so this is a rather cyclical (risky) play.
I think this oil capex cycle is going to last for a quite a while, as evidenced by the big drawdown in drilled-but-uncompleted wells over the past year and a half that I discussed in the macro section of this report. Looking out over the 2020s decade, I think the market is still underestimating how much drilling is going to have to happen in order to avoid rolling energy crises.
The easiest way to play this industry is via the VanEck Oil Services ETF (OIH) which gives exposure to the industry with less single-company risk.
Barrick (and broadly, gold producers and royalty companies)
Gold miners are making tons of free cash flow in this environment.
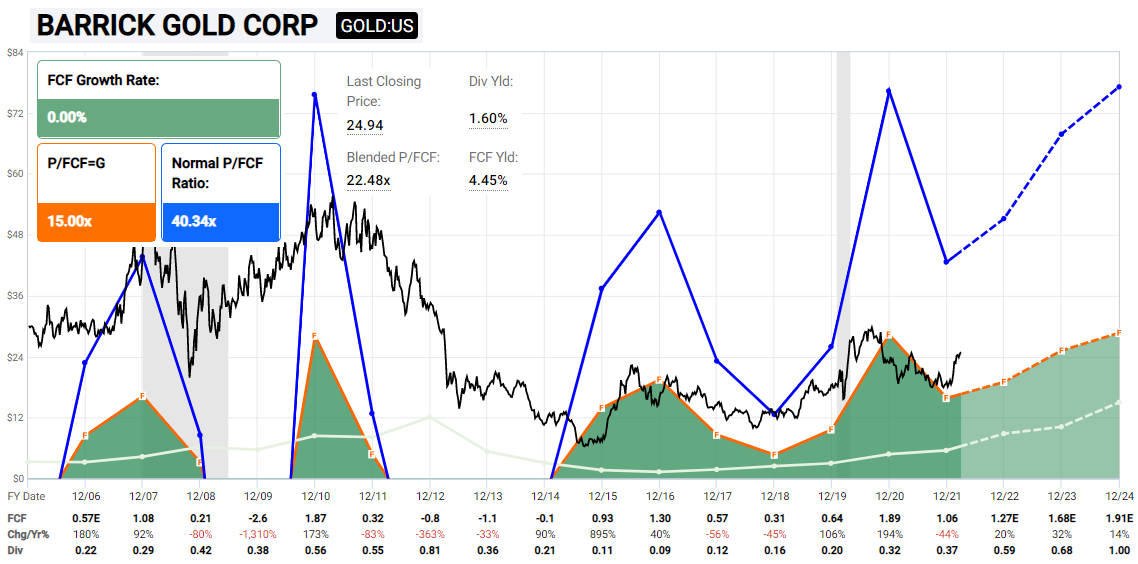
Chart Source: F.A.S.T. Graphs
I wouldn’t exactly call gold miners “cheap” as many people in the industry are, but they’re certainly cheap relative to their history. Some of the small gold miners are truly cheap, but they do come with increased operating/exploration risks compared to the large and more diversified miners.
Gold miners have spent decades failing to produce free cash flow, and generally destroying shareholder capital. After a long bear market, most of them are now acting similarly to how oil companies are acting, where they are being very prudent with capex and emphasizing shareholder returns instead. As such, the industry is actually free cash flow positive, for a change of pace:
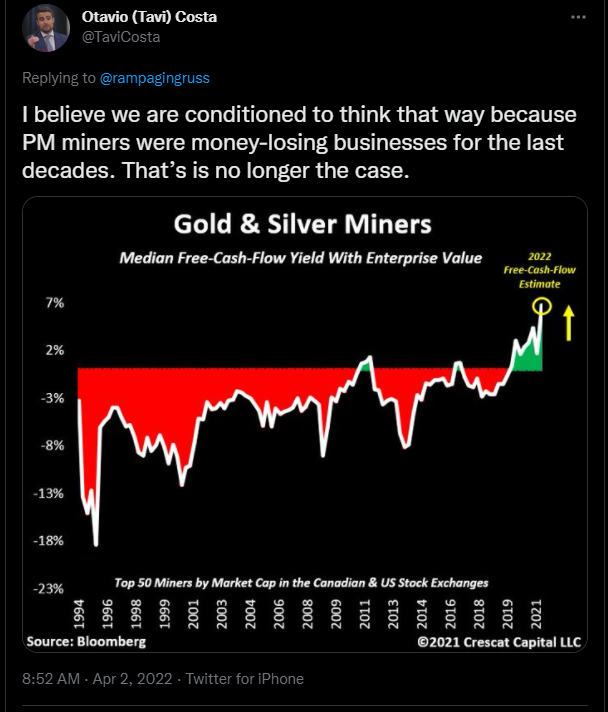
Chart Source: Tavi Costa
Meanwhile, the S&P 500 to gold ratio just had its first negative monthly MACD crossover since late 2018:
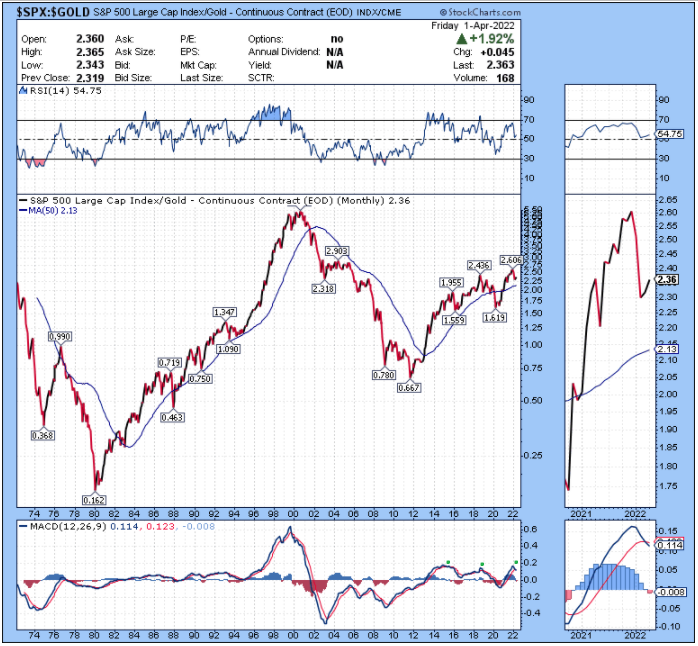
I continue to be bullish gold and gold stocks as part of a diversified portfolio, as I have been since late 2018. This worked out well from 2018 to 2020, and then struggled in late 2020 and into 2021 as stocks recovered amid stimulus. Going forward I think we’re in another cycle like 2018-2020 with a decent shot of persistent gold outperformance occurring.
At the very least, in a stagflationary environment like this, I would not have zero gold exposure.
Final Thoughts
This continues to be a very challenging macro environment, and my overall positioning continues to have stagflation in mind. This means an expectation of slow growth, but with persistent inflationary aspects due to supply-side shortages, combined with monetary debasement.
I remain diversified across domestic equities, foreign equities, commodities, gold, bitcoin, and some cash-equivalents. There are plenty of good assets at reasonable valuations out there, but as the US economy slows down and the Fed tightens monetary policy into an already-weak economic backdrop, there is potentially a price valley to climb over in the quarters ahead.
This means that I want to own good assets, but without leverage, and with plenty of liquidity to rebalance into any turbulence that we might encounter.
