Deep Dive: Macro Update and Gold Market Analysis
 By
Lyn Alden
By
Lyn Alden
The macro section of this report focuses on recent dysfunction in global sovereign bond markets, and the US business cycle.
The digital asset section provides an overview of some of the recent capital raises and payment integrations for the Lightning network.
The equity section takes a look at gold and gold-related equities. Gold has held up reasonably well compared to stocks and bonds in this environment, but gold-related equities have suffered. There are (early) signs of a bottoming process for gold-related equities, but I would need to see some more follow-through to the upside to be convinced.
Macro View
The biggest macro topic by far during the past couple weeks has been the disorder and subsequent interventions in developed market currencies and sovereign bonds. It has been a big enough news event that my upcoming public newsletter will probably focus on it too.
Currency and Bond Market Disorder
As a summary for recent macro events, Japan performed their first currency intervention in over two decades to support the yen amid a backdrop of yield curve control, the British pound sterling had its biggest single-day move in history in response to a new fiscal budget announcement, the Bank of England resumed purchases of long-duration UK sovereign bonds despite 10% inflation in order to stabilize a flailing pension system, and bond yields across the developed including the US had unusually volatile moves to the upside with constrained liquidity.
Let’s back up and unpack that mess a bit.
The Fed has been aggressively tightening monetary policy this year, in an attempt to rein in demand, create higher unemployment, and reduce price inflation.
Many emerging markets started tightening last year (Brazil raised rates from 2% to 14% starting in early 2021), and many other developed market central banks have tightened as well, but the US and Canada have been ahead of most of the developed market pack in terms of hawkishness. The Bank of Japan and the European Central Bank have been among the biggest laggards in tightening- the most dovish due to the most problematic debt situations.
Meanwhile, much of Europe has an acute energy crisis due to Russia halting their gas flows, combined with domestic energy policies over the past several years that gave Russia a lot of leverage over them. It will take time and money to diversify their energy import infrastructure to other types of energy. The European Central Bank is holding rates very low and is still buying Italian debt to avoid a fiscal spiral for Italy (150%+ debt-to-GDP, with rising yields and outright nominal default risk since they can’t print euros themselves).
And also meanwhile, although Japan’s energy problems are less severe than Europe’s, they are paying elevated prices for liquified natural gas, since it has to compete in that market with Europe’s purchases. With over 250% government debt to GDP, the Bank of Japan is sticking with the most dovish monetary policy in the world- they are keeping short-term rates at -0.1% and capping 10-year government bond yields at 0.25%, by being willing to print yen and buy any 10-year government bond that tries to sell over that yield. This is called yield curve control, and the result is that since the global bond market is dealing with price controls in bonds, they sell the bonds and take it out on the currency instead, resulting in unusually rapid yen depreciation.
This combination of a hawkish Fed and balance of payments crises in both Europe and Japan has been bullish for the dollar.
But that doesn’t mean the US gets out of this for free. The US Treasury bond is the primary global reserve asset, and the US dollar is the primary global lending currency. In other words, foreign entities (governments and corporations in various ways) save up reserves in Treasuries and other dollar-denominated assets, and they have liabilities denominated in dollars. They take out more dollar-denominated debt and/or print money to accumulate Treasuries when the dollar is weakening and the global economy is expanding, and play more defense when the dollar is strengthening and the global economy is contracting.
If the dollar spikes higher relative to most other currencies, like it has done so this year, it hardens the liabilities of foreign governments and foreign corporations that have dollar-denominated liabilities, and puts pressure on their currencies. In that environment, foreign official sources generally stop buying more Treasuries as reserves, and even resort to selling some Treasuries if needed in order to buy back and support their currencies.
Japan, for example, has $1.2 trillion in Treasuries, and a sizable portion of that is in the official sector. Since they are holding interest rates below a market-clearing rate via yield curve control, their currency will depreciate as long as the Fed is aggressively tightening their own monetary policy. However, if they want to prevent that depreciation from becoming too disorderly or going too far, they can sell some reserve assets to intervene in currency markets (sell foreign assets and buy back yen), which also has the effect of putting pressure on the Fed’s ability to keep tightening at this pace.
Indeed, the Bank of Japan recently performed its first currency intervention since 1998, with a $20 billion sale of reserves. They could technically do this ten more times and still have over $1 trillion in reserves. Reuters reported that China is looking at similar measures too, and they have nearly as many Treasuries as Japan. The US Treasury market would run into acute liquidity problems and force a Fed response, before China and Japan run out of Treasuries to sell (and it won’t even come close to that) if they start that game in earnest.
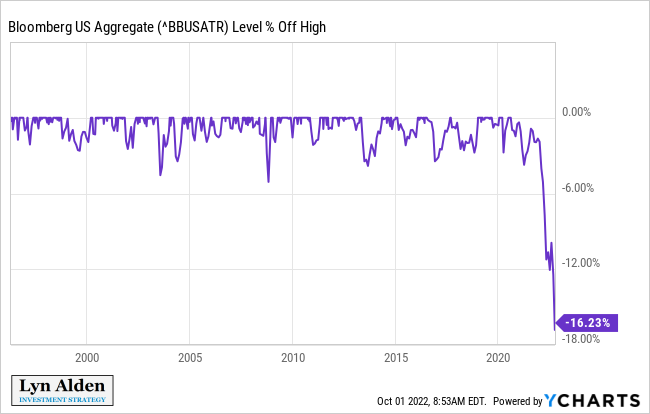
So, the United States ends up facing a problem with its Treasury market too. Foreigners in aggregate aren’t buying, and around the margins are selling. The Fed is letting Treasuries mature off its balance sheet without reinvesting the proceeds, which makes them gradual net sellers. Commercial banks have supplementary leverage ratio (“SLR”) requirements that limit their ability to accumulate Treasuries (they already have the highest allocation to Treasuries in decades), and so they’re not buying Treasuries. Who’s buying Treasuries?
Well for every seller there’s a buyer, but often at a worse price and in an illiquid, disorderly way since many of the biggest pools of capital aren’t buying.
Here’s the US Aggregate Bond Index historical drawdown from highs over the past 25+ years:
Back in my May newsletter, as this was underway, I described some of the likely effects if the Fed raises rates to 3%, 4%, or 5%:
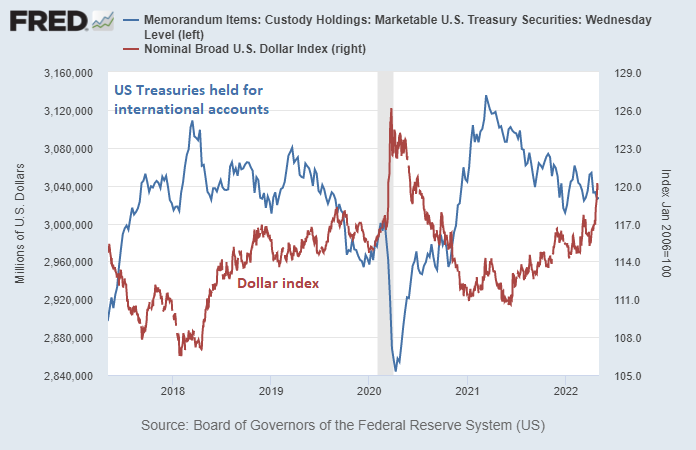
The dollar would likely strengthen further in that scenario, which would squeeze all of the countries that have a lot of dollar-denominated debt (which is primarily owed to places like Japan, Europe, and China). The foreign sector in aggregate would likely stop buying Treasuries, and might have to sell Treasuries to get dollars, like they did during March 2020:
Chart Source: St. Louis Fed
US corporations would have unfavorable exchange rates on their exports, and export volumes would probably decrease.
The various yield curves would likely invert, the Treasury market would likely become illiquid, the high yield credit market would likely become illiquid, and recession indicators would probably worsen. Demand will have been reduced, but at the cost of a recession, and the financial system would start to seize up.
-May 2022 Newsletter
In my follow-up June newsletter, I described how a number of central banks were running into a “checkmate” scenario, which I defined as the inability to stop QE even in the face of high official inflation numbers:
I think major central banks including the Federal Reserve, Bank of England, European Central Bank, and Bank of Japan are nearing the losing side of a checkmate scenario, where economic realities dwindle their set of possible choices to zero. The latter two have likely already been put in checkmate, while the former two are hanging on for the moment.
This is primarily due to the long-term debt cycle described earlier in this issue, where their economies were stimulated to higher and higher debt as a share of GDP and lower and lower interest rates over decades, until they hit super high debt levels with zero or slightly negative rates. Then, they grind through that low-rate disinflationary period for a while, until they finally work through excess capacity, and reach a period of scarcity, stimulus, and inflation.
“Checkmate” in this context happens when a central bank encounters inflation that is above its target level, but still can’t stop printing money, due to lack of buyers of their country’s government debt, or due to other critical liquidity problems in their financial markets. In other words, it’s what happens when a country with a super high debt ratio gets hit with acute commodity shortages, and thus has to keep doing quantitative easing on its government bonds even during high inflation.
This historically only rarely happens to developed market central banks, and until recently hasn’t really happened to any of them since World War II (the prior inflationary part of a long-term debt cycle). When it happened back then, it occurred to several of regions at roughly the same time, and that seems to be the case today as well.
-June 2022 Newsletter
At that time, the Bank of England was one of the hold-out hawks that was still able to tighten policy, along with the Fed and a number of other large central banks. The events from last week shifted the Bank of England over to the checkmated dove camp, at least for now, as they resume QE for a couple weeks despite 10% official inflation for “financial stability” reasons.
The UK Debacle
The proximate issue with the UK government bond blow-up and resumption of temporary QE is that pension funds were getting margin called (which is not a sentence any of us wants to hear) in significant part due to the big drawdown in government bonds that they have heavy exposure to.
UK pension funds’ collective assets are more than 100% of UK’s GDP. If they crash, then in addition to wiping out pensioners, it brings the whole UK financial system including the UK government bond market to its knees. And since they all have similar exposures (long bonds), if some of them start having to liquidate bonds to meet margin calls, it further pushes the prices of those bonds down (yields up), which cascades into yet more funds being margin-called and having to sell. It’s a leverage-fueled vicious cycle of selling that triggers more selling.
To restate the severity of this problem, official UK inflation is 10%, government bond yields spiked up to around 4.5% (less than half of current inflation), and this triggered a debt liquidation, solvency and liquidity crisis, that forced emergency intervention from the central bank to buy those bonds at those prices.
Here is the key part of the Bank of England’s September 28th statement:
As the Governor said in his statement on Monday, the Bank is monitoring developments in financial markets very closely in light of the significant repricing of UK and global financial assets.
This repricing has become more significant in the past day – and it is particularly affecting long-dated UK government debt. Were dysfunction in this market to continue or worsen, there would be a material risk to UK financial stability. This would lead to an unwarranted tightening of financing conditions and a reduction of the flow of credit to the real economy.
In line with its financial stability objective, the Bank of England stands ready to restore market functioning and reduce any risks from contagion to credit conditions for UK households and businesses.
To achieve this, the Bank will carry out temporary purchases of long-dated UK government bonds from 28 September. The purpose of these purchases will be to restore orderly market conditions. The purchases will be carried out on whatever scale is necessary to effect this outcome. The operation will be fully indemnified by HM Treasury.
They go on to say that they will eventually unwind this intervention, and that they are also going to delay their prior plan to start selling government bonds until the end of October. So, they went from being about to sell bonds, to buying them instead. Not even just holding flat.
Andrew Hauser, the Bank of England’s head of markets who is responsible for managing the Bank of England’s balance sheet, had a speech on balance sheet reduction planned for September 29th, which was subsequently cancelled because the opposite is going to happen now, at least for October. It shows how caught off guard they were.
As some analysts have pointed out, although pension solvency was the proximate issue to fix here, the foundational issue has to do with needing to monetize more government debt due to too much supply, insufficient buyers, and at yields that don’t cause a fiscal spiral given how high debt-to-GDP ratios are. There’s not enough unlevered balance sheet capacity to absorb the ongoing bond issuance without central bank support.
According to many economists, however, the BoE’s deeper problem was that by bailing out ministers, the central bank appeared willing to print money to finance government, something it had previously pledged never to do because it was inflationary.
They described the process as “fiscal dominance” because the Treasury would be calling the shots with the result that inflation could get out of control.
Allan Monks, economist at JPMorgan, said: “The optics are not favourable for the bank and will inevitably prompt discussions about fiscal dominance and a monetary financing of the [budget] deficit.”
Of course when push comes to shove, central banks monetize fiscal deficits when needed, voluntarily or otherwise. If they don’t, it leads to nominal government default in their own currency, which almost never happens. And if nominal government bond default happens at scale, it threatens the entire deposit base of banks, since banks use government bonds as a key piece of collateral.
Even attempts at fiscal austerity once sovereign debt is over 100% to GDP usually fail without central bank assistance and/or financial repression, because tighter fiscal policy ends up leading to contraction in GDP and domestic asset prices and balance sheets, which puts more pressure on government bonds because there is shrinking balance sheet space to buy them as most assets in general sell off. Austerity works for keeping debt low, but historically does not usually work when debt is very high (especially if the fiscal problems are now structural, like a high ratio of retirees to workers). The only way to make deleveraging work in that context is to somehow suppress bond yields below the rate of inflation and nominal GDP growth for a long time, which comes with a ton of consequences.
Central bank independence exists to a reasonable degree during peacetime, but during war or other acute crises (pandemics and lockdowns, acute energy shortages, government debt bubbles with over 100% debt-to-GDP combined with an inflation problem, etc) realpolitik takes over and central banks largely become subservient to the sovereign Treasury.
At the core of every central bank is the implicit or explicit mandate for financial stability, and a domestic financial system collapses if the main collateral that underpins it (government debt, which is owned by banks, pension funds, insurance companies, and so forth) is defaulted on. Central bank interest rate management and deficit monetization is what allows government debt to GDP to get this high to begin with, and then once it is there, the central bank basically loses its independence and has to monetize it until a significant inflationary currency reset occurs.
Hawkish Dominos Falling
In the face of high inflation, central banks have tried to rein in demand, with limited success so far.
Along with the US drawing down its strategic petroleum reserve (additional temporary oil supply) and Chinese recurring zero-Covid lockdowns (keeping a lid on oil demand), central bank tightening has kept oil prices, copper prices, semiconductor prices, and so forth in check for the moment, but at the cost of economic slowdown, asset price collapse, and sovereign bond disorder.
Among developed markets, the Bank of Japan and the European Central Bank dominos fell first, with the need to monetize Japanese and Italian government debt respectively, despite above-target inflation. The US, Canada, UK, and other developed market central banks got further, but now the Bank of England has fallen, at least for now, as it joins the Bank of Japan and European Central Bank in monetizing government debt despite above-target inflation.
All of this matters to varying degrees, but it’s not until the US Federal Reserve has to resort to some sort of liquidity program on US Treasuries despite above-target inflation, that things would really change for this cycle in a major macro sense.
It’s like the third act of Avengers: Infinity War where most of the Avengers team (central banks) have already fallen to Thanos (the impossible combo of high debt and inflation), but Thor (the Fed) is amped up with his new Stormbreaker axe, and is still in the fight against Thanos as the last hold-out.
But even Thor is running into problems here, as he did in the movie too. A couple weeks ago, the Bank for International Settlements published a paper on stress in the US Treasury market and similar markets.
This chart from that paper measures a combination of Treasury volatility, market illiquidity, funding illiquidity, and impaired market making.
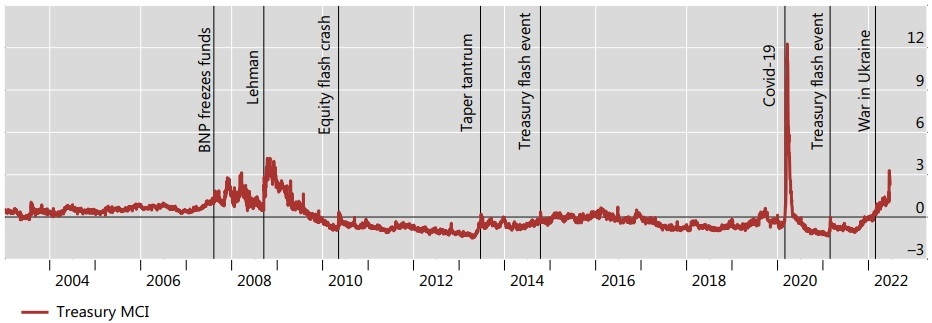
–Under Pressure: Market Conditions and Stress (BIS Paper)
Treasury market functioning is about the third worst it has been in at least the past twenty years. This chart came out before last week and it worsened last week, so by some measures it could be up to the #2 worst now after the March 2020 breakage. There were also a number of weak Treasury auctions recently. The Bloomberg government bond liquidity index captures this pretty well:
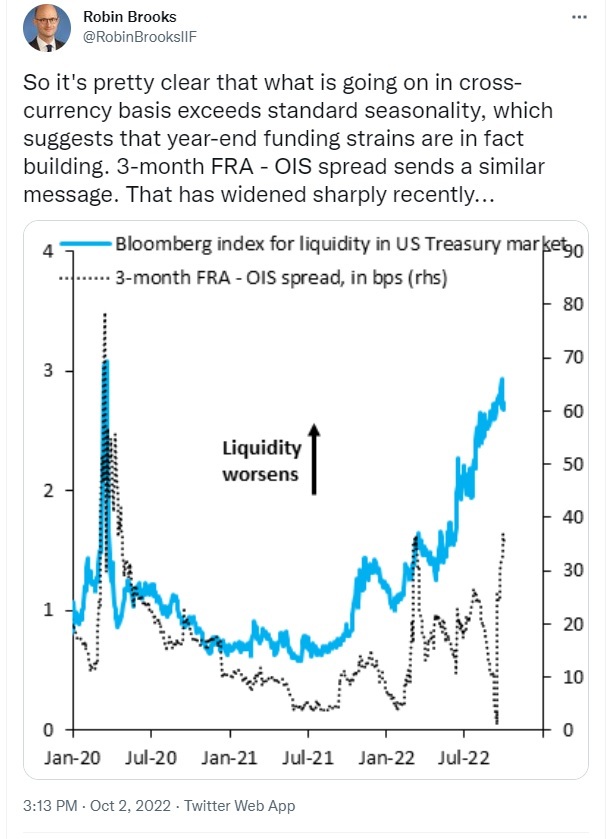
Chart Source: @RobinBrooksIIF
Meanwhile, the foreign sector continues to trim its US Treasury exposure. Last week saw their biggest weekly outflows since March 2020:
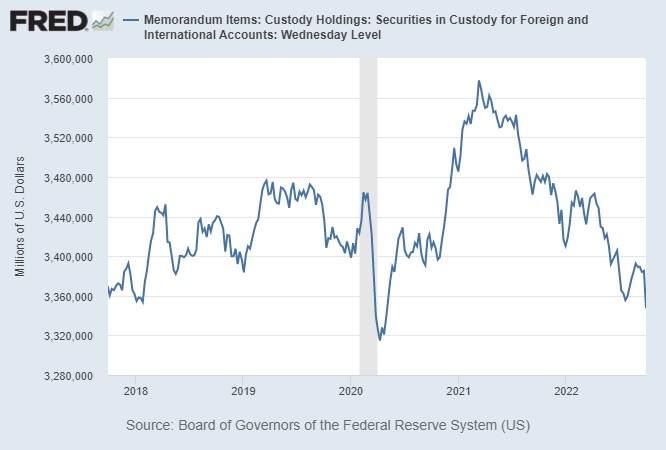
Chart Source: St. Louis Fed
As the Fed continues to tighten monetary policy, it will likely continue to result in the foreign sector not buying Treasuries, and even trimming Treasuries to intervene in their currency markets. Treasury market disorder will likely persist until there is a halt to the rise in the dollar index and a halt in tighter US financial conditions.
That doesn’t mean there won’t be some pockets of relief. As it currently stands, many assets are oversold after last week and sentiment is quite bearish, so another bear market rally would be more likely than not. However, that just encourages the Fed to continue tightening.
Most market commentators are focused on unemployment rates and inflation as the key signals that will determine Federal Reserve monetary policy. However, I continue to view Treasury market disorder as the more likely limiting factor for the Fed’s plan on monetary tightening. In other words, with the current tightening plan, there is a good chance that the US Treasury market or adjacent markets (credit markets, or pension funds, for example) will run into acute liquidity problems before inflation is back to 2%, and before unemployment increases significantly.
If that happens, the Fed could resort to buying long-duration government bonds again, but they also have other levers they can pull such as SLR adjustments that would put more Treasuries onto US commercial bank balance sheets. Either way it would be a form of liquidity intervention.
Even if they get it down to 2% inflation, or get outright deflationary briefly (due to a global collapse in demand), then as soon as they loosen policy again, many of the supply restrictions are still there for when demand returns, especially in the global oil and LNG markets. This would likely trigger another inflationary cycle.
US Business Cycle Analysis
There have been some volatile and conflicting US economic reports in the past week.
I view the US purchasing manager’s index as the most important macro chart, but it only gets updated once per month. We don’t have September numbers yet.
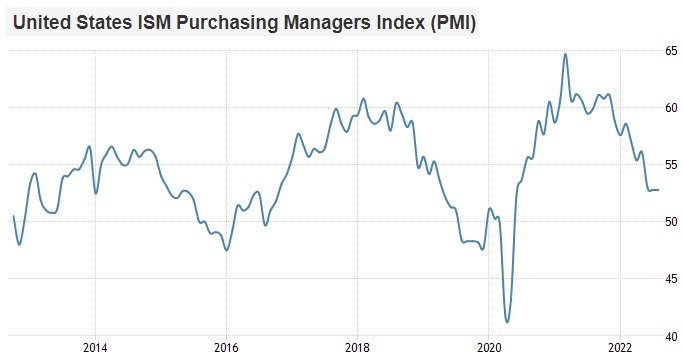
Chart Source: Trading Economics
Regional PMIs come out at various times, and often give us more recent (but more volatile and less complete) datasets to be directionally aware of. For example, the Chicago PMI for September came out recently and it was quite bad:
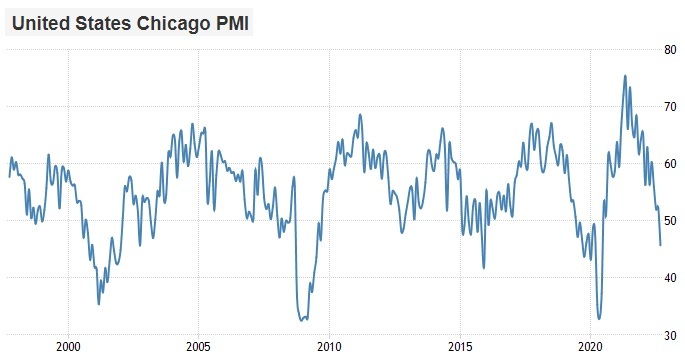
Chart Source: Trading Economics
On the other hand, the Atlanta Fed’s GDPNow indicator, which forms its estimate from a broad rolling set of incoming economic data, sharply jumped from 0.3% to 2.4% estimated real annualized US GDP growth for Q3, which is the quarter that just ended but hasn’t been reported yet:
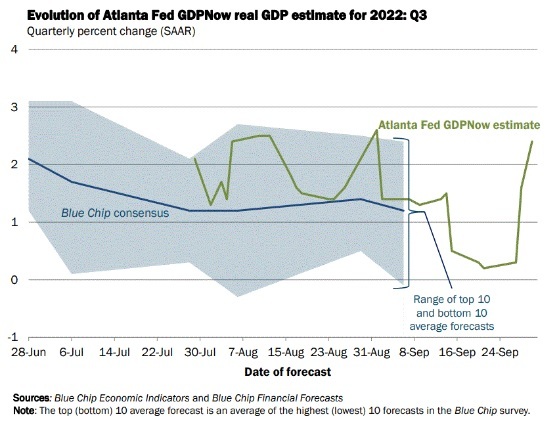
Chart Source: Atlanta Fed
This year, Q1 and Q2 had negative real growth, and Q3 estimates were hanging onto positive levels by a thread. This recent data props it up a lot, and weekly jobless claims have been improving in August and September.
However, as long as tighter monetary policies continue, I expect Q4 to see renewed deceleration in economic conditions. I previously wrote about Q3 potentially being an eye of the storm, where economic deceleration cools off a bit before continuing in Q4.
Digital Assets Note
The past week was a big one for Lightning network news.
Since the network is still small (albeit fast-growing from that small base), Lightning is still mostly under-the-radar as far as big pools of capital are concerned. However, I continue to view it as a potential game-changer and major payments innovation when looking out several years.
Watching the Lightning network here in some ways is like watching various networks and pieces of the early Internet start to connect to each other and build better user interfaces for non-techie people to start using.
Since I began covering it pretty extensively in January 2021, it has reached critical mass and taken off in pretty interesting ways.
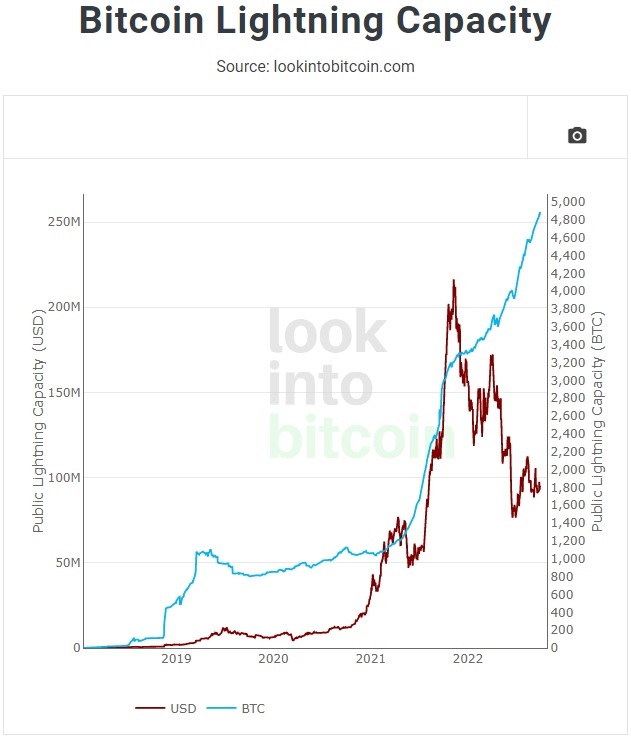
Chart Source: Look Into Bitcoin
Strike $80 Million Series B
Strike, a payments company that makes heavy use of the Lightning Network, announced a Series B that raised $80 million. The funding round was led by venture capital firm Ten31, and included financing from the University of Washington in St. Louis and from the University of Wyoming.
Strike allows users to send and receive bitcoin or fiat currency, and because it makes use of the Lightning Network (an open source protocol), it is interoperable with many other payment networks (unlike most of the closed payment ecosystems that we are generally used to). They also have an application programming interface “API” for companies to build on Lightning, using Strike as a foundation.
One of their goals is to integrate Lightning payments with the biggest point-of-sale providers that merchants around the United States and other countries use.
To my knowledge, this $80 million is the second biggest individual capital round among Lightning companies so far, after Lightspark’s $175 million seed raise earlier this year (and that one was an outlier in terms of capital raising because it was founded by David Marcus, a well-known experienced former executive at both Facebook and PayPal).
Bitnob Kenya Launch and M-Pesa Integration
Bitnob, a bitcoin-based Nigerian savings and payments company, introduced services in Kenya as their third jurisdiction of operation. Previously they were available in Nigeria and Ghana. And they have integrated with the M-Pesa network, which has 50+ million users.
From their news release:
We’re excited to announce that our Bitnob family just got bigger! Bitnob is now available in Kenya!
We’ve seen the growing interest in bitcoin in East Africa, most especially in Kenya, and we wanted to bring them the opportunity to buy, send, receive and save in bitcoin with Bitnob.
Our Kenyan users can now fund and withdraw from their wallets using Mobile money merchants like M-PESA, TKASH, and Airtel Money, making it convenient for them to kickstart their bitcoin journey.
As an example of my prior point about Strike being able to interface with other payment ecosystems due to its use of the open-source Lightning Network, here’s another section of the Bitnob news release:
Bitcoin solves these problems. Imagine being able to receive money from your loved one outside the country straight into your Bitnob app within seconds at little or no fees. Bitcoin makes remittances easier, cheaper, faster, and more secure. Through Bitnob we are giving Kenyans the ability to experience the speed and convenience made possible with bitcoin.
Now with Bitnob, you can receive money from your family using Cash App or Strike in the US straight to your mobile money account.
You can also now send money from Kenya to Nigeria or Ghana or send money from any of these countries to Kenya.
Kind of like how various different email providers (Gmail, Yahoo, your own hosted email server, etc) can make use of the same open source email protocol to easily interface with each other and make emails sendable between users of different email providers, various different payment and savings ecosystems can make use of the Bitcoin/Lightning open source network to transfer value between each other.
On a related note, there is a rather new service called Machankura that is active in nine African countries (previously six), that allows users to send and receive bitcoins via cheap feature phones, without internet, which is a common setup in parts of Africa. They just need wireless phone access, and it was designed this way for that reason. It’s a custodial service, but because it uses the Lightning network, users can send their bitcoin outside of this ecosystem including into self-custodial methods if they are able to get access to the basic technology for that.
Of course this international open network integration model brings up regulatory questions, and so custodial companies have to comply with their various jurisdictional regulations. However, individual users with some degree of technical know-how can interface with the network directly and self-custodially, in a more truly peer-to-peer way that is somewhat resistant to regulation and enforcement.
Lightning Labs Alpha Taro Code
Back in April 2022, Lightning Labs announced Taro, a new protocol that makes use of Bitcoin’s November 2021 Taproot soft-fork update. Taro allows entities to issue various assets, such as dollar stablecoins, on the Bitcoin/Lightning network. Users can therefore send stable dollar value over the Lightning network, while making use of bitcoin-native liquidity through core hubs of the Lightning network. River Financial has a good “Taro 101” type of article here.
As an update, a few days ago Lightning Labs released the alpha code for Taro, for developers to test. So, that’s tangible progress from their April announcement, and within a reasonable timeframe.
Lightning Labs announced a $70 million Series B capital round earlier this year, has developed the largest of the four main Lightning Network implementations, and operates liquidity services. In crude technical terms, “implementations” in this context are like browsers, except instead of letting users interact with the Internet, they allow users to interact with the Lightning Network, which is an open source set of standards that all the implementations adhere to if they want to be interoperable with each other. And then companies like Strike and Bitnob can build platforms on top of those implementations. And kind of like browsers, technically anyone with time or money can make their own implementation.
MicroStrategy Lightning Job Posting
MicroStrategy (MSTR), the software company that is best-known these days for holding 130,000 bitcoins, recently posted a job for a Lightning engineer on its website.
The company’s executive chairman Michael Saylor shared it on social media and said, “the engineers at Microstrategy are working on some exciting new Lightning apps to help our enterprise customers secure networks, monetize websites, and deploy wallets en masse using Bitcoin.”. He previously briefly mentioned this concept at the September 2022 Baltic Honeybadger conference, and in prior interviews has talked about potential applications for Lighting in spam prevention and other use-cases.
Right now, the biggest public company involved with Lightning development is Square (SQ), which created one of the four main Lightning implementations and has integrated Lightning for its Cash App accounts. It would be interesting to see to what extent MicroStrategy might get involved as well, so that’ll be something I plan to monitor. Most of the other companies working on Lightning are still private companies, such as Blockstream, Lightning Labs, Strike, Bitnob, Voltage, and so forth.
Price Action
Despite rather intense moves in traditional financial markets over the past couple weeks, bitcoin’s price action has been rather firm:
Chart Source: Look Into Bitcoin
A lot of the leverage and fast money was washed out of the space after the LUNA and 3AC crashes earlier this year, so there aren’t many sellers left. However, there also isn’t much buying going on either, and so bitcoin has been chopping along sideways.
Research by Messari showed that there was a spike in bitcoin inflows from UK and European buyers amid the recent sovereign bond carnage. There was no similar inflow spike for ether that week, although one week does not make a trend.
I continue to be structurally bullish on bitcoin for the long-term. However, I’m still quite cautious on price in the intermediate term, with the Fed continuing to tighten monetary policy into a period of economic deceleration. I view this as likely being a great value accumulation zone for a 3-5 year view, but it’s still a very unclear period for the next 6 months.
I view dollar-cost averaging into bitcoin with an appropriate position size as the best way to get exposure for most people that want some.
Portfolio Updates
The portfolios are available in my Google Drive.
Newsletter Portfolio
-No current changes.
Fortress Income
-No current changes.
ETF-Only Portfolio
-No current changes.
No Limits Portfolio
-No current changes.
Top 12 List
-No current changes.
Other Holdings
-No current changes.
Gold Market Update
I added gold and gold miners to my portfolio in late 2018, which worked out well. In my August 2020 newsletter after a substantial bull run, I wrote about how I expected gold’s price to likely take a breather for a while, while re-iterating that I remain bullish in the longer term.
That ended up being right in terms of timing (gold indeed peaked in August 2020), but the subsequent bear market in gold has lasted longer than I would have guessed. I thought it would last maybe 6-18 months, but it’s now going on for 25+ months.
And the cause is pretty clear- gold did basically what I expected it to do from August 2020 until early 2022, but when the Fed began aggressively tightening monetary policy in spring 2022 faster than I would have guessed, it resulted in extra dollar strength and another leg down in gold.
Gold priced in euros or pound sterling or yen has been more in line with my original expectations, whereas gold priced in dollars has been weaker than expected due to the Fed’s aggressive moves:
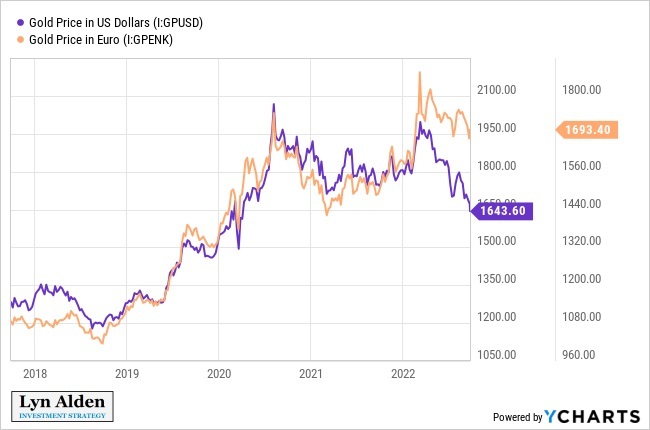
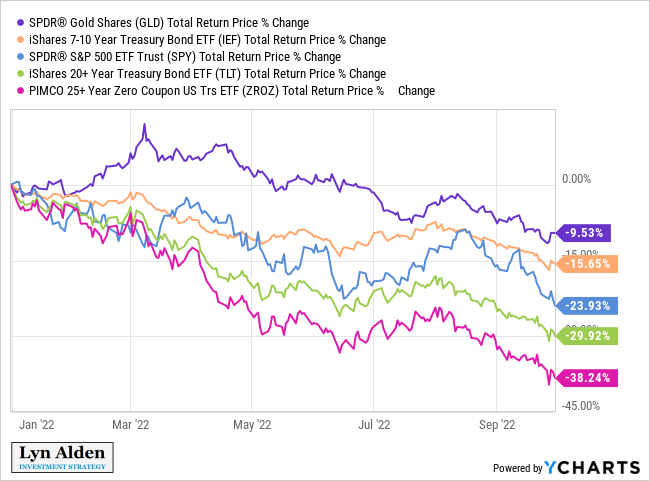
However, gold has outperformed stocks and long-duration Treasuries this year, even as it underperformed cash.
Meanwhile, there has been an unusual uptick in Comex gold physical deliveries.
Deliveries have already been somewhat elevated since the pandemic began, but here in 2022 they climbed higher:
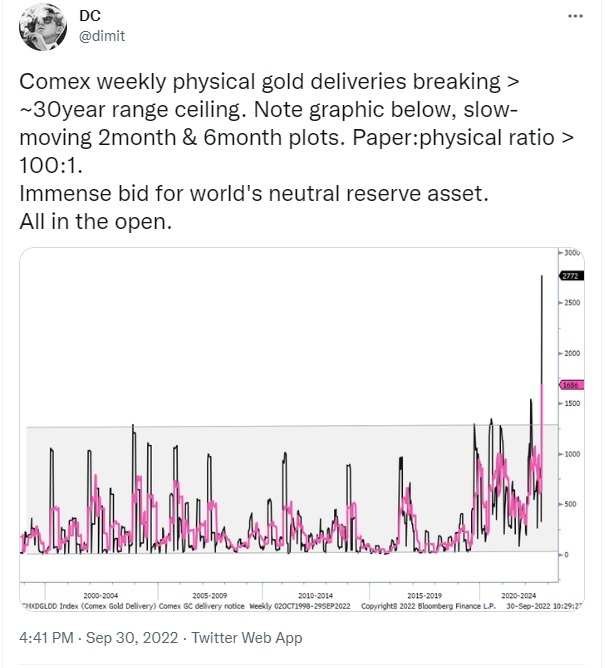
Chart Source: @dimit
The divergence between physical gold markets and paper gold markets has been a long topic of frustration among structural gold bulls.
Any physical commodity with a high stock-to-flow ratio is vulnerable to this, and gold has the highest stock-to-flow ratio of any physical commodity by far. It’s easy to make claims for it, so that a lot of investors think they have exposure to gold but would run into problems if they all tried to call in their claims for the physical at once (like a game of musical chairs when the music stops).
However, I find it interesting that in the same year that sovereign bond markets have become rather disorderly, physical gold deliveries have increased substantially.
We also have to keep in mind the backdrop of frozen currency reserves, partial de-globalization, geopolitical tensions and wars, and so forth. A country having gold bars vaulted in its own jurisdiction is the most sovereign type of reserve asset they can have, since it doesn’t rely on other countries’ honoring their liabilities in real or nominal terms, but does subject the holding country to the price risk of gold.
The ratio of the S&P 500 to gold is generally in gold’s favor. Momentum in this ratio has been rolling over, which means stocks have been rolling over relative to gold:
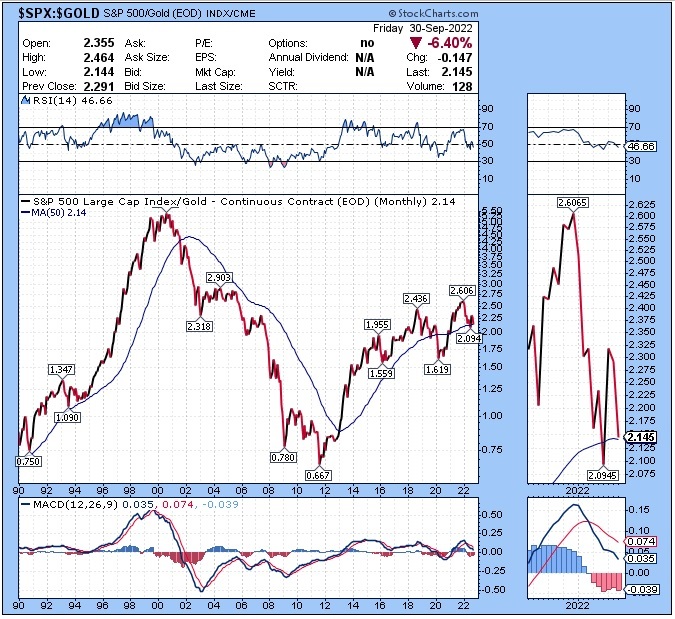
My view is that gold is likely to remain lackluster in dollar terms as long as the Fed continues to tighten monetary policy aggressively, but should be a good buy when the Fed has to pause, pivot, or adjust its approach.
And as I described in the macro section earlier in this report, US Treasury market liquidity problems might be the initial catalyst that results in Fed re-liquification programs prior to unemployment rates getting very high.
Environments with strong corporate earnings growth, with or without Fed tightening, are usually good for stocks and not good for gold. That’s what the market had in 2021.
In 2022 and potentially into 2023, the economy is decelerating (good for gold), the Fed is tightening monetary policy (bad for gold), but corporate earnings are rolling over and their valuations have been pressured (worse for stocks).
If the US gets outright recessionary conditions and the Fed eases monetary conditions, that would likely be good for gold but still not great for stocks (valuations could stop falling, but earnings would be weak).
I generally prefer gold royalty companies more than gold miners on a risk-adjusted basis in general. This is because I’m bullish for the long run on both gold and oil in dollar terms, and oil is a big expense for miners. Royalty companies, on the other hand, have little or no exposure to operational expenses, so they capture the upside if gold and other commodities rise together. Of course, this has to be balanced by the fact that investors have to pay much higher valuations for those royalty companies.
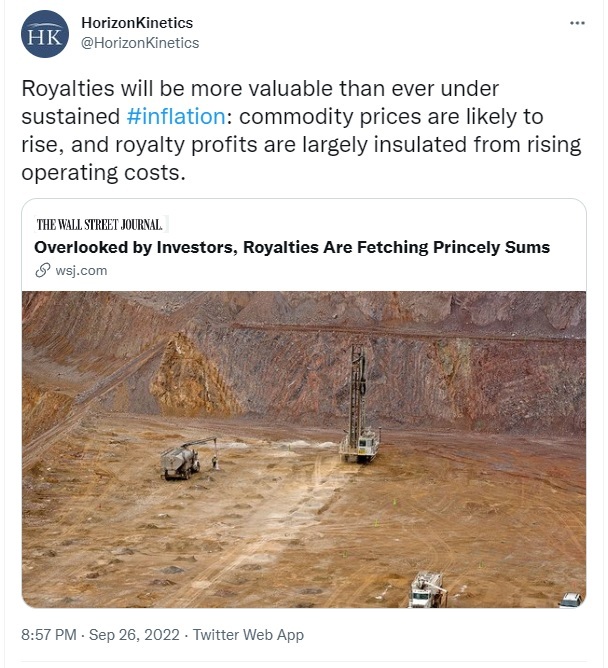
Chart Source: @HorizonKinetics
I avoid focusing too heavily on any one company, but Sandstorm (SAND) has been one of my preferred royalty companies. Its share price has suffered along with the price of gold, but as it falls to the low end of its range currently, I find it quite interesting again.
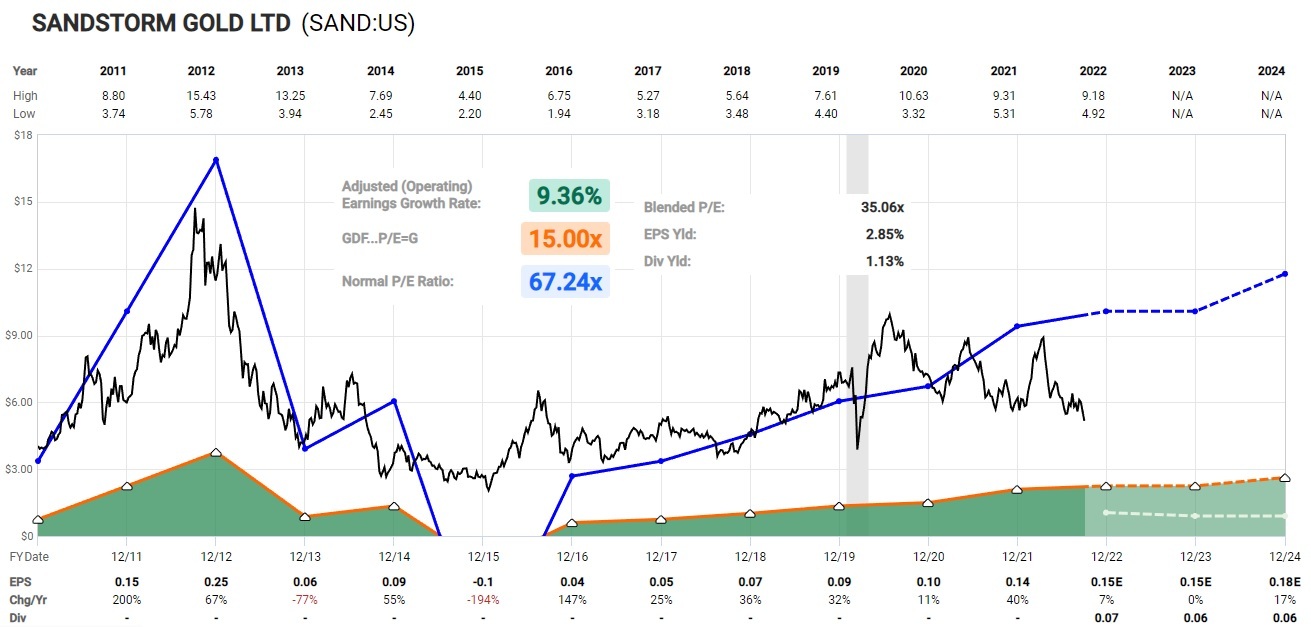
Chart Source: F.A.S.T. Graphs
Over the past couple of years, the company has diversified and grown its portfolio of royalties and partially de-risked its Hod Maden exposure. However, it did dilute its share base more than previously stated by management. I do think the dilution will be value-accretive in the long run (i.e. I don’t view their acquisitions as malinvestment), but it did put downward pressure on the share price amid a gold bear market. The stock price has generally underperformed its fundamentals.
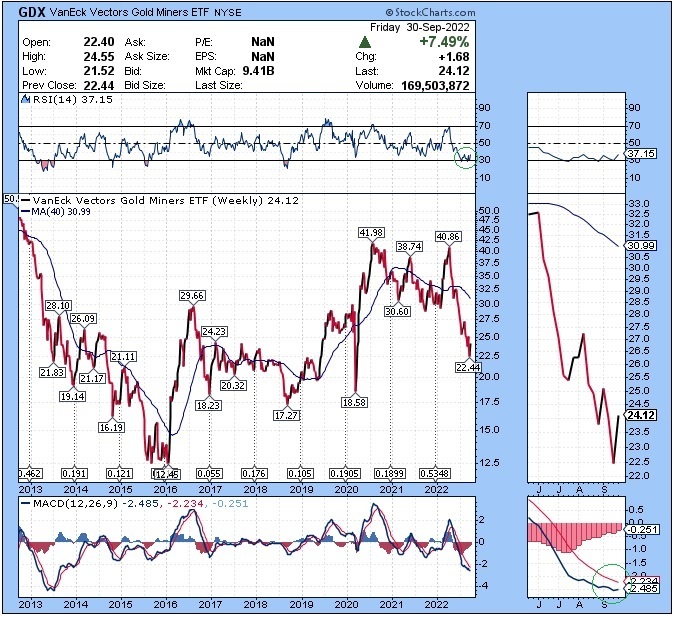
Focusing on GDX, I think the gold miners and royalty companies in general are trying to bottom here, but I would need to see more positive momentum signs of that to have a firmer view:
If we look at the GDX to GLD ratio, a potential bottoming formation is more clear, but I still need to see a more persistently constructive price action:
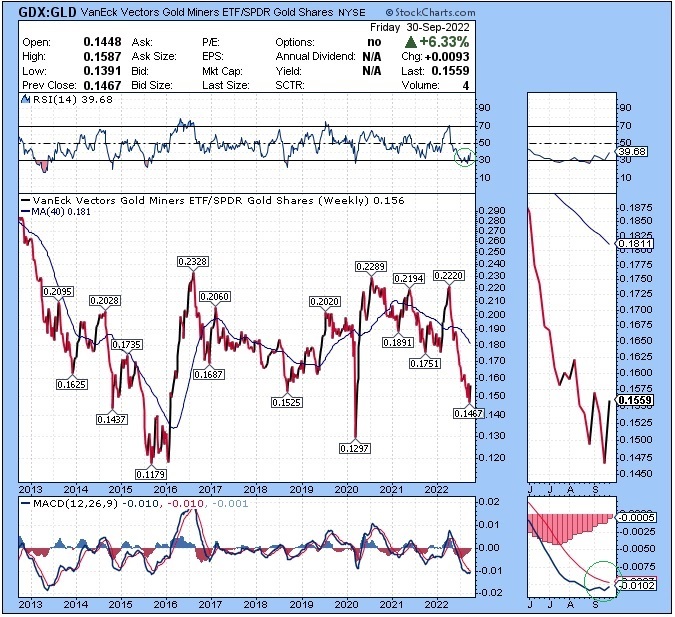
Fundamentally this attempt at a bottom makes sense, because I also think the Fed is getting close (within months) of running into having to pause some aspects of its monetary tightening plan or running into acute US Treasury liquidity problems.
For defense, I prefer gold itself, and this terrible price action of GDX in 2022 is a clear illustration as to why. However, if gold resumes a bull market, especially with gold miners and gold royalty companies very oversold compared to gold itself, I’d expect to see a stronger upward move in those equities. They require a lot more risk management and cautious position sizing, however.
In summary of my current view of the gold sector, I currently like gold more than the majority of other assets (up there with cash, pipelines, and defensive value stocks), and am starting to once again pay pretty close attention to gold equities, but want to see some higher highs and higher lows in terms of price before pounding the table on them and increasing my allocation.
Defensive Positioning Continues
For much of this year, I have been recommending a defensive tilt, and that can mean different things for different types of portfolios (trading portfolios, investing portfolios, high turnover, low turnover, various tax situations, and so forth).
As examples of defensive assets for this environment, I have been using cash, gold, defensive value equities (healthcare stocks, tobacco stocks, etc) and North American energy pipelines, as examples. I don’t change my portfolios around in a high turnover way, but I do tilt them in certain directions based on macro conditions, and have overweighted these types of assets compared to a typical 60/40 portfolio.
Defensive value and pipelines have generally turned out the best of this set year-to-date, with many of them in positive territory for the calendar year against a backdrop of most asset prices going down. Cash and short-duration Treasuries have been secondary winners, as they at least avoided the worst of the carnage. Gold is down but has held up better than most assets. The baseline portfolio assets (broad stocks and long-duration bonds) have been worse.
Other than Latin American equities (Brazil, Mexico, Chile), most attempts at risk-taking have been punished this year. Risk-off conditions have played out in line with expectations that I developed back in December, but certainly on the worse end of the possible spectrum since they ended up tightening at the high end of the possible spectrum:
The Stock Market and Stimulus Correlation
Ever since the global financial crisis, US stocks have been very reliant on persistent stimulus, either monetary or fiscal, in order to keep going up.
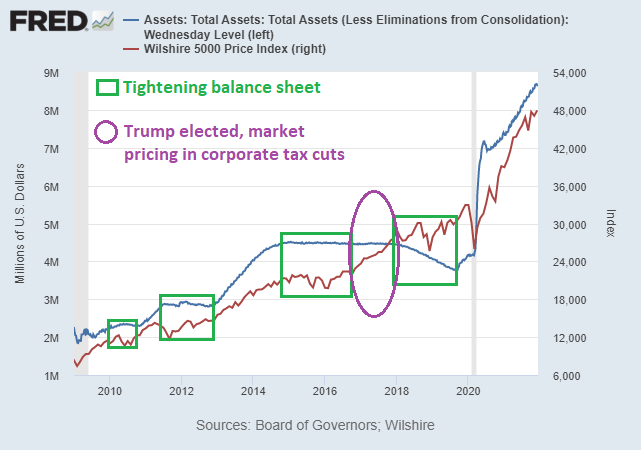
This chart is cluttered but quite important in my opinion. It shows the Wilshire 5000 price index (the closest proxy for the broad US stock market) and the Fed’s balance sheet. I’ll walk through it in the following paragraphs:
Chart Source: St. Louis Fed, annotated by Lyn Alden
In 2010 (first green box), the stock market had partially rebounded from its 2009 depths. The Fed had performed emergency quantitative easing (QE1) during the crisis, but had not been actively stimulating recently. The Fed’s balance sheet went sideways, and the stock market chopped along sideways as well. Then in late 2010 (the end of the first green box), the Fed announced QE2 and both the Fed balance sheet and the stock market began going up together.
From late-2011 to 2012 (second green box), the Fed held their balance sheet flat and the stock market chopped along sideways again. Then after that green box, they did QE3 from 2013 to 2014 to expand their balance sheet a lot, which coincided with another bull market period.
From 2015 to 2016 (third green box), the Fed once again held their balance sheet flat and the stock market chopped along sideways again. This was a bigger deal because the dollar strengthened, and several emerging markets including Brazil in particular entered very serious recessions. The price of oil crashed and remained down for years as global growth slowed. The US experienced an industrial recession (which was not quite big enough to cause a full recession), in large part because of how weak the energy sector was, which cascaded into weakness in manufacturing to supply the energy sector.
The year 2017 (purple circle) was an exception. The Fed continued to hold their balance sheet flat and began gradually raising interest rates, but Donald Trump was elected to be president in November 2016 and was sworn in to office in early 2017, with a Republican majority in both houses of Congress. The stock market quickly began pricing in tax cuts including corporate tax cuts in particular, which indeed materialized a year later. This was a form of fiscal stimulus; tax cuts without associated spending cuts, resulting in a bigger fiscal deficit, which was good for the stock market. Corporations were able to repatriate hundreds of billions of dollars from overseas and use the majority of it for share repurchases, which was great for stock prices but didn’t meaningfully impact GDP growth or employment.
From 2018 through much of 2019 (fourth green box), there wasn’t any more fiscal stimulus coming down the path. The Fed continued raising rates but also began performing quantitative tightening, which means shrinking their balance sheet. The stock market once again entered a very choppy sideways period. By 2019 it was clear that the global economy was slowing, the US yield curve inverted, and the Fed slightly reduced interest rates.
From late 2019 onward, the Fed has been performing massive monetary stimulus. This was initially triggered by the repo rate spike in September 2019, but then was kicked into high gear by the COVID-19 global lockdowns to address the illiquid Treasury market. The largest fiscal stimulus and monetary stimulus in modern history occurred together, and this was massively beneficial to the stock market.
With fiscal stimulus winding down, and the Fed now tightening, the base case would be for a volatile market again as we enter another probable “green box” in 2022. Equities have been very reliant on these ongoing stimulus efforts. Plus, equity valuations are much higher now, and 2021 already had record inflows into equity at a scale that exceeded the prior twenty years combined. Everyone piled into equities. It could be different this time, but that’s not the assumption I would go with. The caveat is that fiscal stimulus from a Build Back Better bill might serve as another purple circle, but that remains to be seen, and much of that money is not very fast-acting like stimulus checks or corporate tax cuts are.
So, I am looking for a defensive posture around the margins.
-December 12th, 2021 report
Since then, we indeed got another “green box”, and quite a bad one due to combo of balance sheet reduction and aggressive interest rate hikes. I expected it to go sideways-to-down like some of the prior green boxes (and possibly a bit worse), but it ended up going straight down:
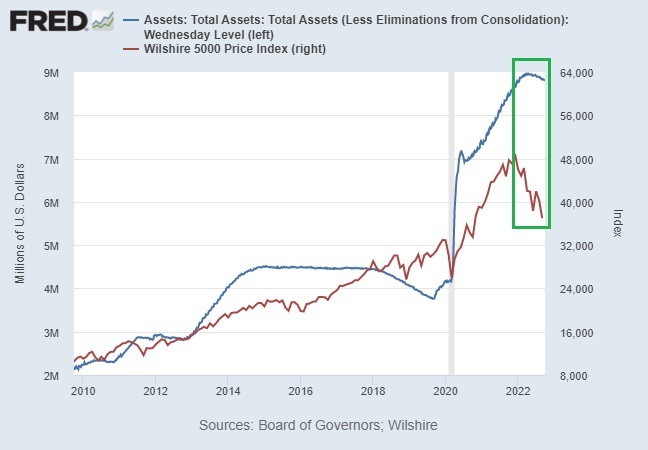
Chart Source: St. Louis Fed
Going forward, I unfortunately continue to view a high likelihood of correlation here. Any signs that the Fed might pause or pivot on some aspect of its tightening would likely contribute to a bounce in many asset prices. On the other hand, any signs that the Fed is committed to ongoing rate hikes and continued balance sheet roll-off (which is currently the case), will likely continue to pressure most types of assets, with defensive assets holding up better than more rate-sensitive or cyclical assets.
Bounces in risk assets just give the Fed more incentive to tighten harder, until the US Treasury market or adjacent markets become acutely illiquid like the UK government bond market and pension system recently did.
Final Thoughts
This continues to be a particularly challenging macro environment to navigate.
We have to avoid sensationalist and fear-oriented content throughout financial media and especially social media, while also realizing that there are many truly historic events happening here.
Back in 2019, I wrote a long article about a probable government bond bubble forming, and the specific mechanisms (large fiscal deficits that are monetized by central banks) that would likely end it. The one thing I didn’t have yet was a specific catalyst, which came in spring 2020.
Since mid-2020, after that catalyst arrived, I have been using the 1940s decade analogue in a number of articles to describe the 2020s decade, with an emphasis on the long-term debt cycle and fiscal-driven inflation, rather than war. The pandemic/lockdown, rising political polarization around the developed world, and energy supply shortages could have been the fiscal and social equivalent of “wartime finance” instead.
However, with war in Europe and the recent sabotage of the Nord Stream pipelines, plus ongoing tension around Taiwan, the 2020s vs 1940s analogy has only gotten more literal in terms of rising geopolitical conflicts and outright kinetic warfare.
Many of the largest developed countries are forced to monetize their highly-indebted government bond markets amid high inflation, there are acute energy shortages in many parts of the world to a level that represents true national security threats in some cases, and political polarization continues to rise broadly, with the recent Italian elections being an example of that.
There are a lot of attractive risk assets for the long-term out there that I’m keeping an eye on, such as Latin American equities, Indian equities, gold equities, bitcoin, energy producers, a variety of cyclical value equities in general, and so forth. And for many of them, I’m happy to accumulate now in a barbell approach and already own them, while maintaining an overall defensive tilt with other parts of my portfolio. When the Fed runs into difficulty trying to tighten policy more, and has to pause or pivot, then many of these assets would likely become very attractive and I’d probably want to increase my positions.
So, navigating this period becomes about managing timeframes, as we keep a watch list of what we’d like to own more of, and being aware of some of the key catalysts out there. For example, BLDR and SWN are two stocks I’m potentially looking to buy, but am holding tight for the moment as I watch the macro conditions unfold a bit more.
