Deep Dive: Business Cycle, Bitcoin, and Nutrien Analysis
 By
Lyn Alden
By
Lyn Alden
This issue discusses the ongoing COVID-19 impact on the U.S. and global economy and then dives into a beaten-down stock that has rather little exposure to the COVID-19 problem.
U.S. Business Cycle Update
The U.S. stock market, and many global stock markets, have been able to rally for the past few weeks. Precious metals, corporate bonds, and junk bonds also came back up from their sell-offs.
This is essentially a matter of liquidity, as central banks around the world, especially the Federal Reserve, are flooding the world with hundreds of billions of dollars and other units of currency (pounds, yen, euro) every week.
The Federal Reserve in particular has been aggressively buying Treasuries, financing U.S. federal loans and bailouts to companies and individuals, and has extended that purchase program into corporate bonds and even a certain type of junk bond referred to as a “fallen angel”- specifically junk bonds of companies that were rated investment-grade in March but recently were downgraded to junk status.
In terms of monetary and fiscal policy, this is certainly a year for the history books. The last time fiscal and monetary policy were this aggressive in the United States, as a percentage of GDP, was during World War II. Back then, the government issued a ton of Treasury debt to fund the war effort, debt reached very high levels relative to U.S. GDP, and the Federal Reserve backstopped it by buying a bunch of it and officially kept Treasury bond interest rates low despite high inflationary pressures that would normally cause the market to set the rates at a higher level.
I’ve described in two research pieces, The "Global Dollar Short Squeeze" and "The $40 Trillion Problem", that a large portion of the selling pressure both in the United States and globally is the result of a shortage of dollars outside of the United States to service over $12 trillion in dollar-denominated debt that is held outside of the United States. The first article described the existing situation pre-crisis, and the second article described the current consequences of it during March’s intense global sell-off amidst the global economic shutdown.
As of this writing, that dollar shortage is being addressed (but not solved), which is a key variable for allowing markets to have lower volatility. However, it remains a risk that if this global economic shutdown persists, the problem will resurface and help cause another round of selling.
Nearly 17 million people filed initial jobless claims over the past 3 weeks in the United States. It was 3.3 million three weeks ago, then 6.8 million the week after (revised up from 6.6 million as originally cited that week), and now another 6.6 million last week. More Americans lost their jobs in these three weeks than through the entire 2008-2009 financial crisis.
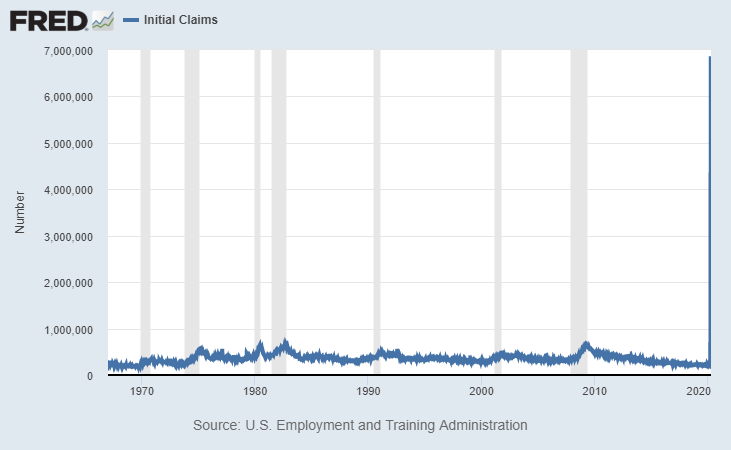
Chart Source: St. Louis Fed
A large portion of these jobless people worked at restaurants, hotels, retailers, transportation companies, casinos, theme parks, event venues, and so forth. But then it ripples through the service and product supply chain into the various companies that supply those industries, or provide software to them, or build their equipment and products, and so forth. Buildings with fewer people working in them need fewer janitors. Many people at home take care of their own kids and cleaning rather than break social distancing rules by letting their nannies and housekeepers into their homes (which for many of them, means no income). And then if people have less income, they buy fewer discretionary goods, which puts pressure on those otherwise unrelated companies and their suppliers, and it becomes a vicious cycle.
The Federal Government and other sovereign governments mandated a large portion of the economic shutdown to quarantine the virus, but then are on the hook to bail out individuals and companies that are the most-affected, assuming they don’t want a deflationary collapse of the highly-indebted global financial system and a lot of social unrest. It then opens up a puzzle of who gets bailed out and who doesn’t. It’s a big moral hazard and an unusual mix of private capital and public support. One of my big concerns is a scenario where the largest and most well-connected companies end up getting the most direct routes to bailout money while countless smaller businesses struggle through red tape and with less favorable support.
When people are able to fly, eat at restaurants, stay at hotels, go to Disney World, and get back to normal life, a portion of these jobs can quickly return. However, another large segment of the jobs are now part of a typical severe recession cycle, where companies learn how to do more with less, and where job losses result in less spending power that trickles into other job losses. In other words, even if the virus magically disappeared tomorrow, the probability that these 17 million people would all return to work right away is unrealistic. It would be a process, just like with any recession resolution.
Countries in Asia have so far handled the virus better than most other regions in terms of how quickly they contained the virus. Mainland China’s reported numbers are not to be relied upon (even if one sidesteps the political speculation of what the ruling Communist Party of China is willing to disclose, they simply didn’t have enough test kits to determine actual virus numbers even if they wanted to share them), but South Korea, Hong Kong, and Singapore have reliable numbers and have done well. They dealt with SARS in the past, and for Korea, Japan, and Singapore, they have more collectivist cooperation and trust between their populations and their governments than we do in the more individualized West. However, it’s concerning to see that after they initially got the virus under control, it started to come back and they had to re-double their efforts of social distancing, particularly in Singapore.
Southern Europe and the United States have been hit particularly hard, due to a combination of less available testing, differences in culture, and so forth. In addition, we don’t know the full extent of the impact of the virus in emerging and frontier markets, because they have fewer testing resources and in some cases less than reliable reporting. My relatives in Egypt are undergoing similar quarantine and curfew procedures that we’re doing here in the United States, including closed restaurants and virtual work where possible, and I don’t have reports from them yet of particularly overwhelmed hospitals or other medical distress that are any worse than the level that is happening in the United States. One of my relatives there is a doctor in Cairo who is quarantining himself after having potentially been exposed to the virus from a patient (who was being treated for another issue and only later found to have the virus).
Latest Portfolio Changes
I added Diageo (DEO) to the Fortress Income portfolio, which I mentioned in the previous report was likely.
Other than that, I’ve been sitting tight on my holdings. I did some trimming and buying as the crisis began which I covered in previous reports, but am now quite set with what I personally want to hold through this.
My Google Drive shows my portfolios, updated in real time.
Asset Spotlight: Bitcoin
Whenever people join my website newsletter (which I post mostly on EWT and on Seeking Alpha as macro research pieces as well), they get an automatic email asking them what their major investment interests are, and then I read all of their responses and reply to a subset of them.
A trend that I’ve noticed is that whatever alternative asset tends to be doing well that year, triggers a lot of emails. People are always interested in the new thing that’s doing well.
2017: Bitcoin
In 2017, when bitcoin and cryptocurrencies were skyrocketing, I received a ton of emails from people interested in bitcoin and other cryptocurrencies. So, I wrote an article on the topic in autumn 2017 with a neutral and mildly bearish view, explaining my view on bitcoin and other cryptos and why I prefer precious metals. I’ve updated it a few times since to keep some of the numbers fresh and to tweak my viewpoint a bit as new information becomes available.
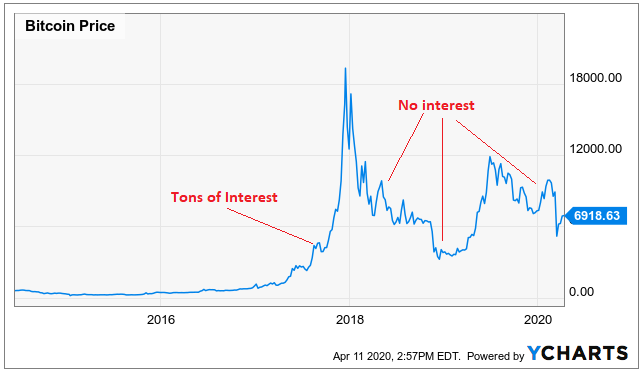
When I wrote the article, bitcoin was around $6,500, it quickly went to almost $20,000, and then it crashed way down to $3,000, rebounded back up to $12,000, briefly crashed back below $4,000 again earlier this year during the global liquidity crunch, and as of this writing is back at $7,000. In other words, it was incredibly volatile but ultimately ended up at roughly the same price that I initiated neutral coverage of it 2.5 years ago in autumn 2017.
After bitcoin crashed at the end of 2017, the number of emails from new readers expressing interest in bitcoin went down considerably.
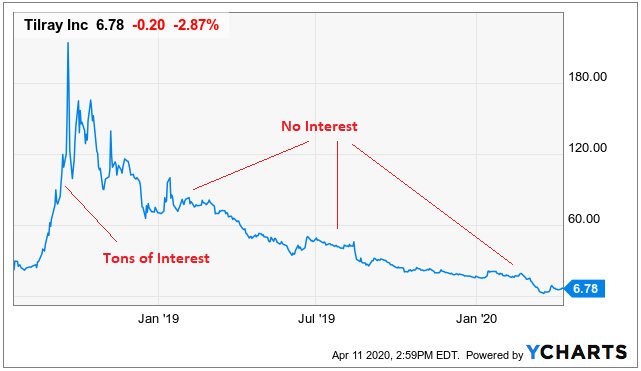
2018: Pot Stocks
In 2018, after bitcoin had fallen from its highs, the new hot topic in my email responses was pot stocks. Everyone was excited about the growth opportunities, and I responded with many emails acknowledging the potential growth of the market but suggesting caution due to a) overvaluation and b) oversupply and c) lack of strong competitive advantages to find companies that can make high returns on capital. I never felt enough of an edge to write an article about the subject, and did not invest in any companies in the industry.
2019: Gold Miners
In 2019, after pot stocks crashed, the most popular topic in my incoming email was gold and silver stocks; the miners. They were doing great.
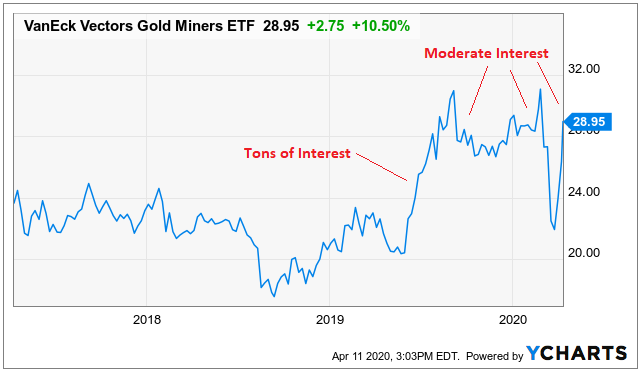
Unlike bitcoin and pot stocks, I was also bullish on gold and silver stocks, particularly since autumn 2018 when I initially added them to my M1 Newsletter portfolio.
However, even a good thing can get ahead of itself in the near term. In response to readers that sent emails expressing interest in gold stocks, for the ones I replied to, I often stated that I like gold and silver stocks and that I include them as part of a diversified portfolio. In other words, I would try to present my positive view of the asset class but not in a speculative or over-exposed fervor after it had recently had a period of good performance.
About six weeks ago in February 2020, I tweeted that although I’m bullish on gold, gold had a lot of positive sentiment lately and to be cautious about it. I didn’t sell any of mine, but plenty of people use options or other leveraged strategies to play it, so my concern was with people that were getting overleveraged or overexposed to it.
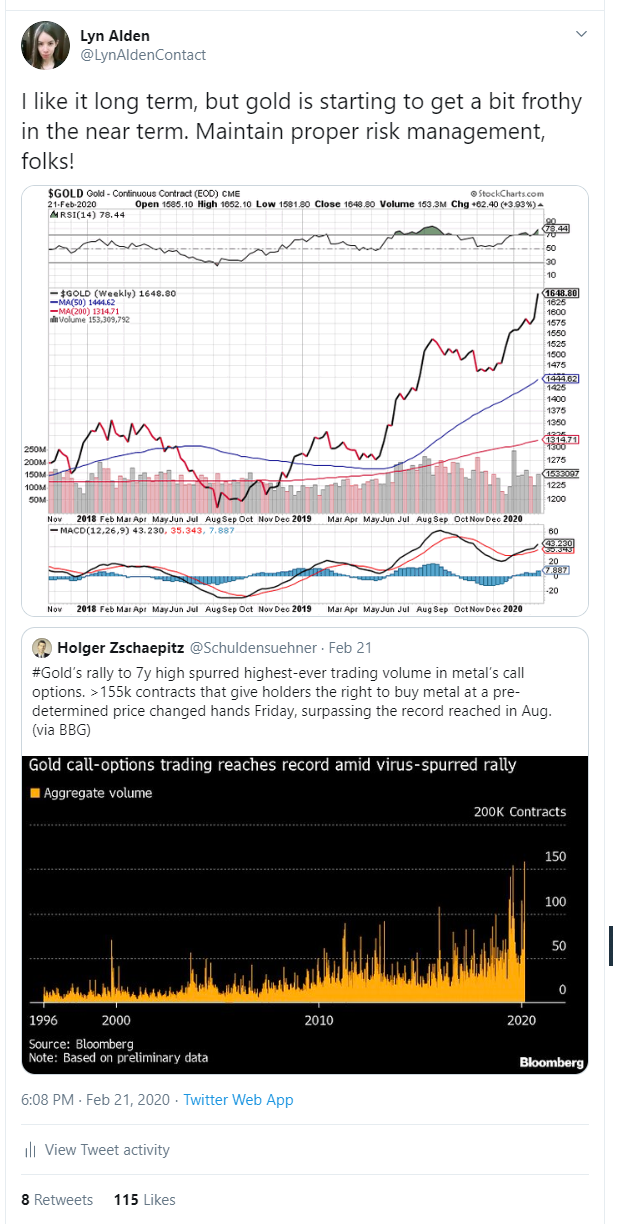
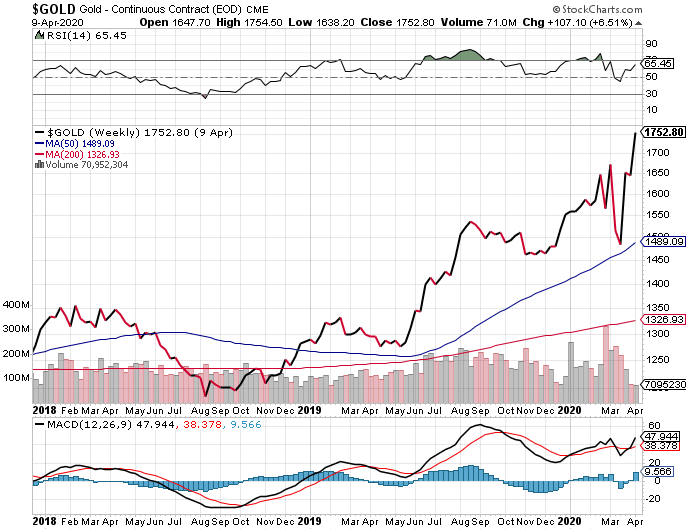
We ended up getting a pullback in gold down to the $1400’s for several weeks during the liquidity crisis before it recently launched back to new seven-year highs over $1700. More volatile parts of the precious metals complex, including silver and gold miners, sold off harder and have rebounded back as well, although gold itself has led the way up.
If my blog had been up and running back in the early 2000’s, I probably would have received a lot of email interest about emerging market “BRIC” (Brazil, Russia, India, China) investing at the time, which was all the rage back then and led to a huge emerging market overvaluation in 2007 and consequently a decade of poor returns and lower valuations for emerging markets since then.
Be Contrarian and Unemotional
The point is, always keep emotions in check when investing. If there’s one asset class that you’re particularly excited about, take a step back for a moment and ask yourself if it’s a crowded trade, and if your emotions are leading you to overexpose yourself to it or to expect too much from it too soon.
As Bruce Flatt, the CEO of Brookfield Asset Management (BAM) has said a number of times during his long period of outstanding private equity acquisition performance, “We don’t like well-attended auctions.”
Precious metals are still relatively under-owned among the generalist investor compared to various points in the last 50 years. There have been these local bursts of interest among professional investors, macro tourists, and momentum traders, especially in 2019 after gold broke out from a multi-year consolidation. And in 2020, niche retail demand for physical coins has been notably high. However, precious metals continue to be a small or nonexistent part of most investment portfolios. I continue to be bullish for the long run for a variety of fundamental reasons, but tend to prefer the space after pullbacks, whenever interest takes a step or two back.
Recently, I covered gold stocks favorably in early March after their moderate pullback, and again in mid-March after their sharper pullback, from which they have since recovered significantly to the upside.
Bitcoin is becoming interesting to me in this upcoming environment of excess liquidity and perpetually low interest rates as well. After 2.5 years of being relatively neutral on it and the price going up and down and eventually being roughly where it was when I first analyzed it, I now consider myself bullish on it.
My conviction on the asset is not as high as it is with gold and silver, because it’s a newer asset with less strict properties of scarcity. However, as a small speculative position, I am starting to like bitcoin for diversification after a couple years of it being relatively beaten down and trading in a volatile but ultimately sideways pattern.
By May 2020, the bitcoin algorithm will undergo a “halving” that it does every 4 years, which means fewer coins will be created every 10 years and therefore that it will take more computational power to create each coin, and so new coins will become more scarce and require more capital (electricity and processing power) to produce. This is only the third halving in bitcoin’s history and both previous times tended to be relatively good years for the price.
Bitcoin doesn’t have any intrinsic value like gold and silver and other commodities do (i.e. it’s not a chemically unique metal that is specifically suitable for various applications), and like all commodities bitcoin doesn’t produce cash flow.
However, bitcoin benefits from the network effect after 11 years of having been the first and continuously most popular cryptocurrency. As long as the bitcoin network continues to be perceived to be a deflationary store of alternate wealth (the number of bitcoins will never exceed 21 million, unlike dollars and other fiat currencies that multiply every year), it can be useful as a liquidity play, meaning that it tends to do well when fiat currency liquidity is abundant.
For example, U.S. broad money supply is increasing at the fastest year-over-year pace in decades:
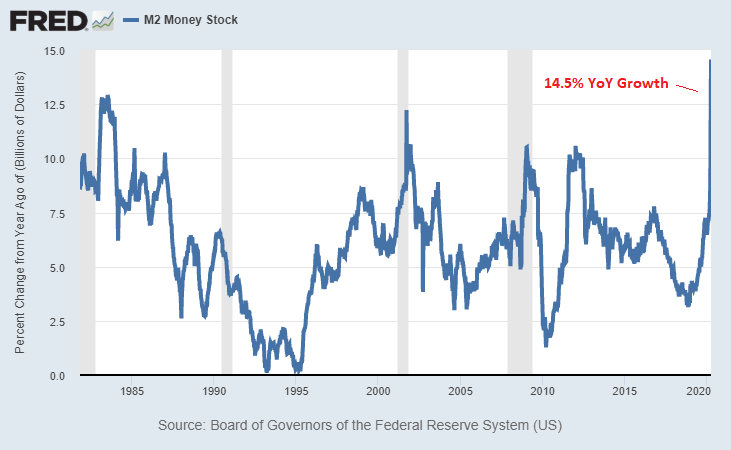
So, I now consider myself a mild speculative bull for bitcoin as a small position. There is plenty of upside and downside potential for this volatile asset class, and I consider it a reasonable calculated bet to hold some through 2020 and 2021 which will include the algorithm halving and and excess of liquidity from global central banks. However, it’s worth noting again that it’s a very volatile and risky asset class; mainly suitable for speculation.
Nutrien (NTR) Deep-Dive Analysis
Nutrien (NTR) is a major producer of fertilizer (especially potash, for which they are the world’s largest producer), and operates a large agriculture retail business where they sell various agricultural products including their fertilizers.
The company, headquartered in Canada, formed under its current name at the start of 2018. It was the result of a merger between PotashCorp, a large fertilizer producer, and Agrium, a large agricultural retailer.
The thought process behind this merger makes sense. Commodity production, whether it’s oil or metals or agricultural products, is cyclical and companies don’t have much control over their prices. The retail business is a bit steadier. Combining the two makes for a vertically integrated company that can balance out years low fertilizer prices with the retail business, and can make the retail business more competitive and wider-moated by producing some of the products it sells.
Nutrien’s base of operations has among the world’s lowest production costs of potash, which gives them a competitive advantage. They are higher on the cost curve for some of their other fertilizer products.
On the retail side of the business, they have an extensive footprint of retail locations throughout North America and Australia, and targeted exposure to certain parts of South America. They continue to make tuck-in acquisitions from the highly-fragmented agricultural retail industry, which will keep improving their retail density and scale, which is good for maximizing their pricing power and efficiency.
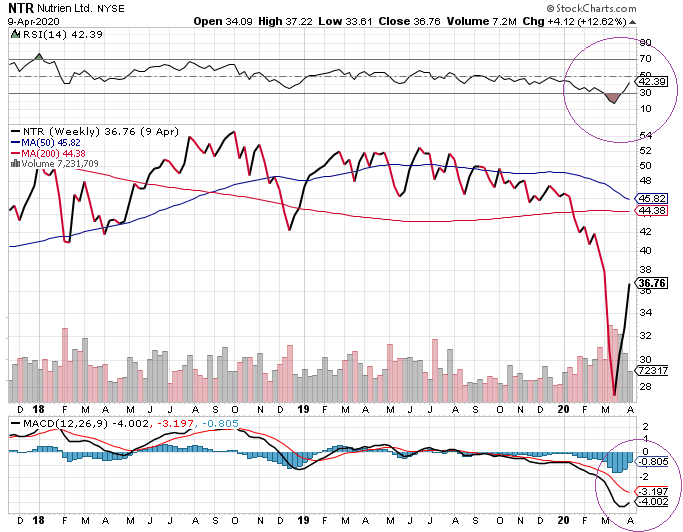
Nutrien stock was recently oversold in terms of weekly RSI, and the weekly MACD looks like it may have found a floor.
Fundamentally, I like the long-term forward risk/reward potential here as part of a diversified portfolio.
Management and Performance
Nutrien has underperformed broad stock indices since its post-merger inception at the start of 2018.
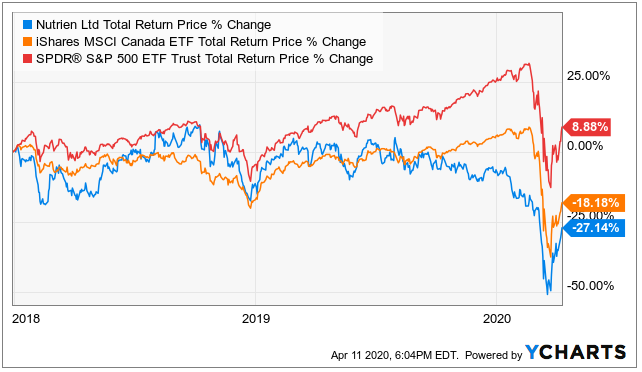
However, it has been due to forces outside of the company’s control, as is the case for most well-run commodity companies in this environment.
If you think this recent broad stock-sell off was bad, just look at the commodity complex. Commodities were already having a bad decade before this recent sell-off. Agricultural commodities are currently about two standard deviations below their average pricing levels over the past 10 years, and near their low points over the 10-year period.
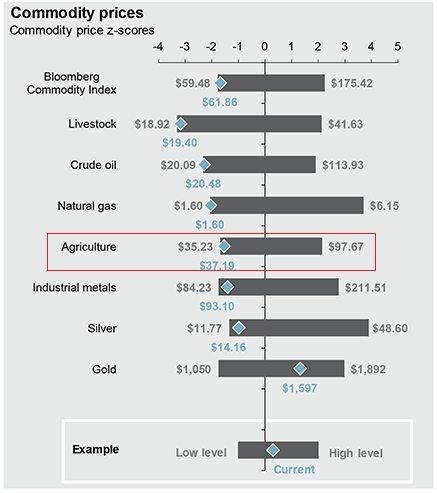
Chart Source: J.P. Morgan Guide to the Markets
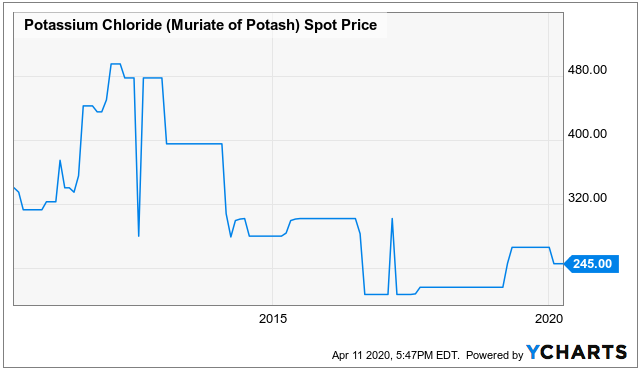
Potash hit a local bottom a couple years ago and has been in a mild recovery since then.
What’s notable about Nutrien, and the agricultural industry more broadly, is that it operates on a very different cycle than the credit/business cycle that most other companies operate on. In other words, people don’t consume fewer calories during a recession. They still consume the raw agricultural commodities in similar amounts, even if they end up eating cheaper at-home preparations, for example. However, agriculture operates under its own cycle of supply and demand, wet seasons and dry seasons, new fertilizer production capacity, the establishment or dissolution of pricing cartels, and so forth.
The 2018-2019 trade war between the United States and China was difficult for American farmers, because China started to prioritize purchases from Brazil and other places. The United States in general runs a trade deficit every year, but we are one of the world’s largest agricultural producers and exporters and it’s a strong industry for us due to our large amount of arable land. A reduction in Chinese demand for U.S. soybeans and other products meant less demand from U.S. farmers for agricultural supplies and fertilizers.
And then the spring and summer period in 2019 was the wettest year on record in the United States, which also came after an unusually wet autumn 2018. While some rain is necessary, too much rain damages crops, delays planting and harvesting (and thus results in missed periods of fertilizer application), and causes other problems.
The year 2020 is likely to be less bad for agriculture than 2018 and 2019, but time will tell. Andy Jung, the Director of Market and Strategic Analysis at The Mosaic Company (a large producer) has a good article that explains the dynamics of the industry in 2019 and presents an outlook for 2020:
What are the 2020 market drivers? We believe that there is significant pent-up demand for fertilizers globally and the U.S. market in particular. Our crop nutrient affordability metric, the ratio of a wholesale fertilizer price index and a crop price index, suggests fertilizer prices are very affordable at present and thereby should provide a very attractive value proposition.
Nutrien has a moderate balance sheet, with a BBB credit rating and little over $9 billion in net debt. The company’s net income and free cash flow fluctuate substantially in a given year, ranging from $500 million to well over $3 billion, which makes for a volatile debt/income ratio, which tends to be my preferred debt metric. Their EBITDA was $3.6 billion in 2019, which gives them a debt/EBITDA ratio of less than 3x. Their debt/equity ratio is well below 50%, but their debt/tangible-equity ratio is slightly above 100%. The company has mildly reduced its leverage compared to mid-2019, and I’d like to see that trend continue. The good news is that their debt maturity profile is very spread out for many years, rather than short-term in nature.
Historically, PotashCorp (Nutrien’s fertilizer-producing predecessor) generated solid returns on invested capital in the mid-teens for many years, although it was heavily dependent on commodity prices. Overall, as a large producer that is on the low end of the potash cost curve, and historically good returns on invested capital, Nutrien is evidenced to have some degree of an economic moat.
Valuation Analysis
Despite the fact that a company like Nutrien has almost nothing to do with the normal business cycle or COVID-19, it saw its stock price fall from $46 at the beginning of the year down to under $28 in mid-March. In other words, it fell just as hard as the broad stock market, but unlike the broad stock market, it was already having a rough time to start with.
The stock has since rebounded to over $36, which is still considerably below where it came into the year.
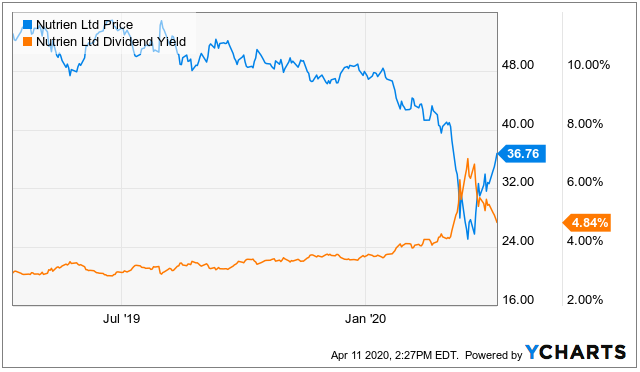
The dividend yield for much of 2019 was a bit over 3%. It briefly spiked to well over 6% during the bottom of the recent sell-off, and is now at around 4.8%.
I consider this dividend to be moderately reliable. The company is a good source of income and they send most of their money back to shareholders as dividends and buybacks, but the precise payout levels are dependent on commodity prices. They are intent on being a dividend growth company that pays out a larger dividend each year, but their ability to follow through with that plan will ultimately depend on industry dynamics, and particularly potash and nitrogen pricing.
In 2019, the dividend was not quite covered by earnings ($1.76 in dividends with just $1.70 in GAAP earnings), however it was covered by free cash flow. Analysts expect continued solid free cash flow generation in the years ahead.
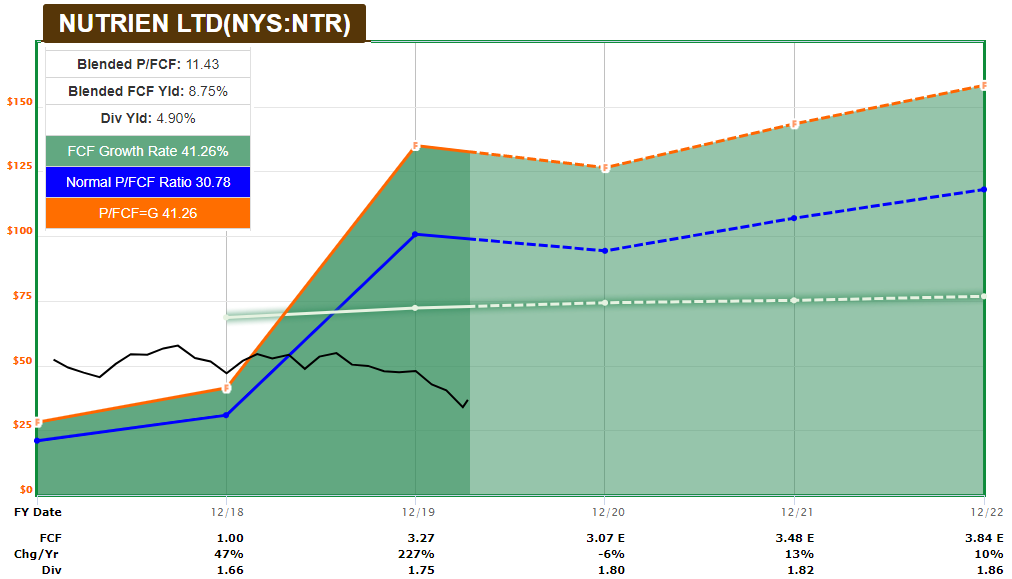
Chart Source: F.A.S.T. Graphs
The company reduced its share count by over 6% in 2019, and they have an ongoing buyback authorization in place. Their free cash flow goes towards dividends, buybacks, and potentially some debt reduction, so their share reduction percent will change each year depending on commodity prices and other uses of capital.
Here’s a pretty bearish StockDelver model for Nutrien:
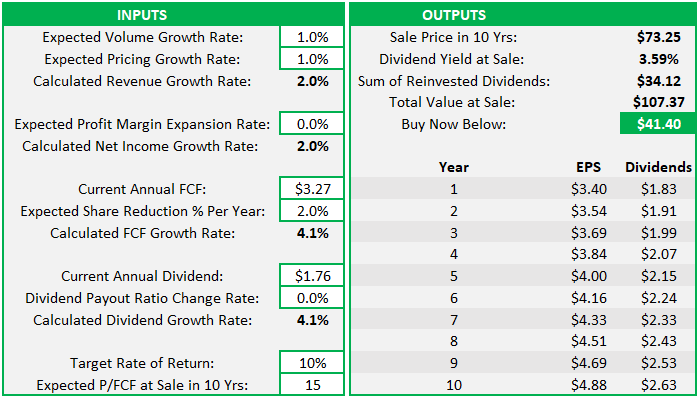
In this model, I assume just 1% average volume growth and 1% average pricing growth over the next decade. I also assume a long-run average of just 2% share reduction per year. In other words, it’s basically a flat version of what’s happening now and with less share buybacks. With a 10% target rate of return and eventual sale at 15 times annual free cash flow, the stock would be a buy at under $41, which is higher than the current price.
In reality, volume and pricing will be a lot more volatile than that, and my base case is for higher pricing numbers in the years ahead. Their commodity prices can easily have 10% or higher pricing moves to the upside in a good year.
Company Risks
Nutrien’s primary risk is fertilizer pricing, which itself consists of numerous sub-risks.
-Unusually wet seasons can disrupt the crop-planing season and result in missed fertilizer applications.
-Trade wars can temporarily impact U.S. agricultural exports, and this is a key market for Nutrien.
-State-run fertilizer-producing competitors could operate irrationally, failing to match supply with industry demand, resulting in global oversupply and low pricing.
Conclusion
I personally would not make a commodity stock one of the core positions of a portfolio, because it’s a very challenging business model. It is rough for a company when they can’t really control the pricing of their own products due to lack of product differentiation, which is why the commodity industry is very boom-bust in nature. The dividend will never be as safe as it is for a company like Johnson and Johnson (JNJ)
However, I continue to think that the 2020’s decade will likely end up being the decade of commodity outperformance, after such a dismal commodity decade for the 2010’s.
For Nutrien, my favorable long-term outlook and reason for inclusion in a portfolio comes down to two main points.
The first thesis for an investment in Nutrien is that the number of arable acres in the world is relatively finite, even as global population continues to increase. In addition, as people gain wealth in emerging markets, they tend to eat higher on the food chain, which requires more farming resources per person. In other words, it takes a lot more resources to feed plants to animals and then to feed those animals to humans, compared to when humans just eat the plants. Only about 10% of the Earth’s landmass is farm-able, and it’s easier to destroy existing arable acres by over-farming than to create new arable acres, so it’s not a particularly abundant resource. Potash and other fertilizers help to renew arable acres when combined with proper crop-rotation schedules and other sustainable farming techniques to manage soil quality.
The second thesis is that Nutrien’s fundamentals are on a totally different cycle than most stocks. Most stocks follow the typical credit/business cycle, while Nutrien is on a separate agriculture cycle. For the most part, what makes Nutrien gain or lose money is very different than what makes, say, Apple (AAPL) gain or lose money. This is useful for portfolio diversification and rebalancing. In a sharp liquidity-driven drawdown like we saw in March, correlations can unfortunately go to one (stocks, bonds, and commodities all sold off together in mid-March), but over a multi-year period of time, Nutrien’s chart can look a lot different than, say, the S&P 500 chart, for better or worse.
I currently have Nutrien in the Newsletter portfolio and the Fortress Income portfolio, and plan to keep dollar-cost averaging into the stock. I have little idea what the price will do in the intermediate term but at current prices, the long-term risk reward for this company with a solid base of assets is favorable in my view.
