DKNG, CLVS & ZYME Plus 8 Additional Charts To Watch
Our Charts of the Day video today covers 11 stocks.
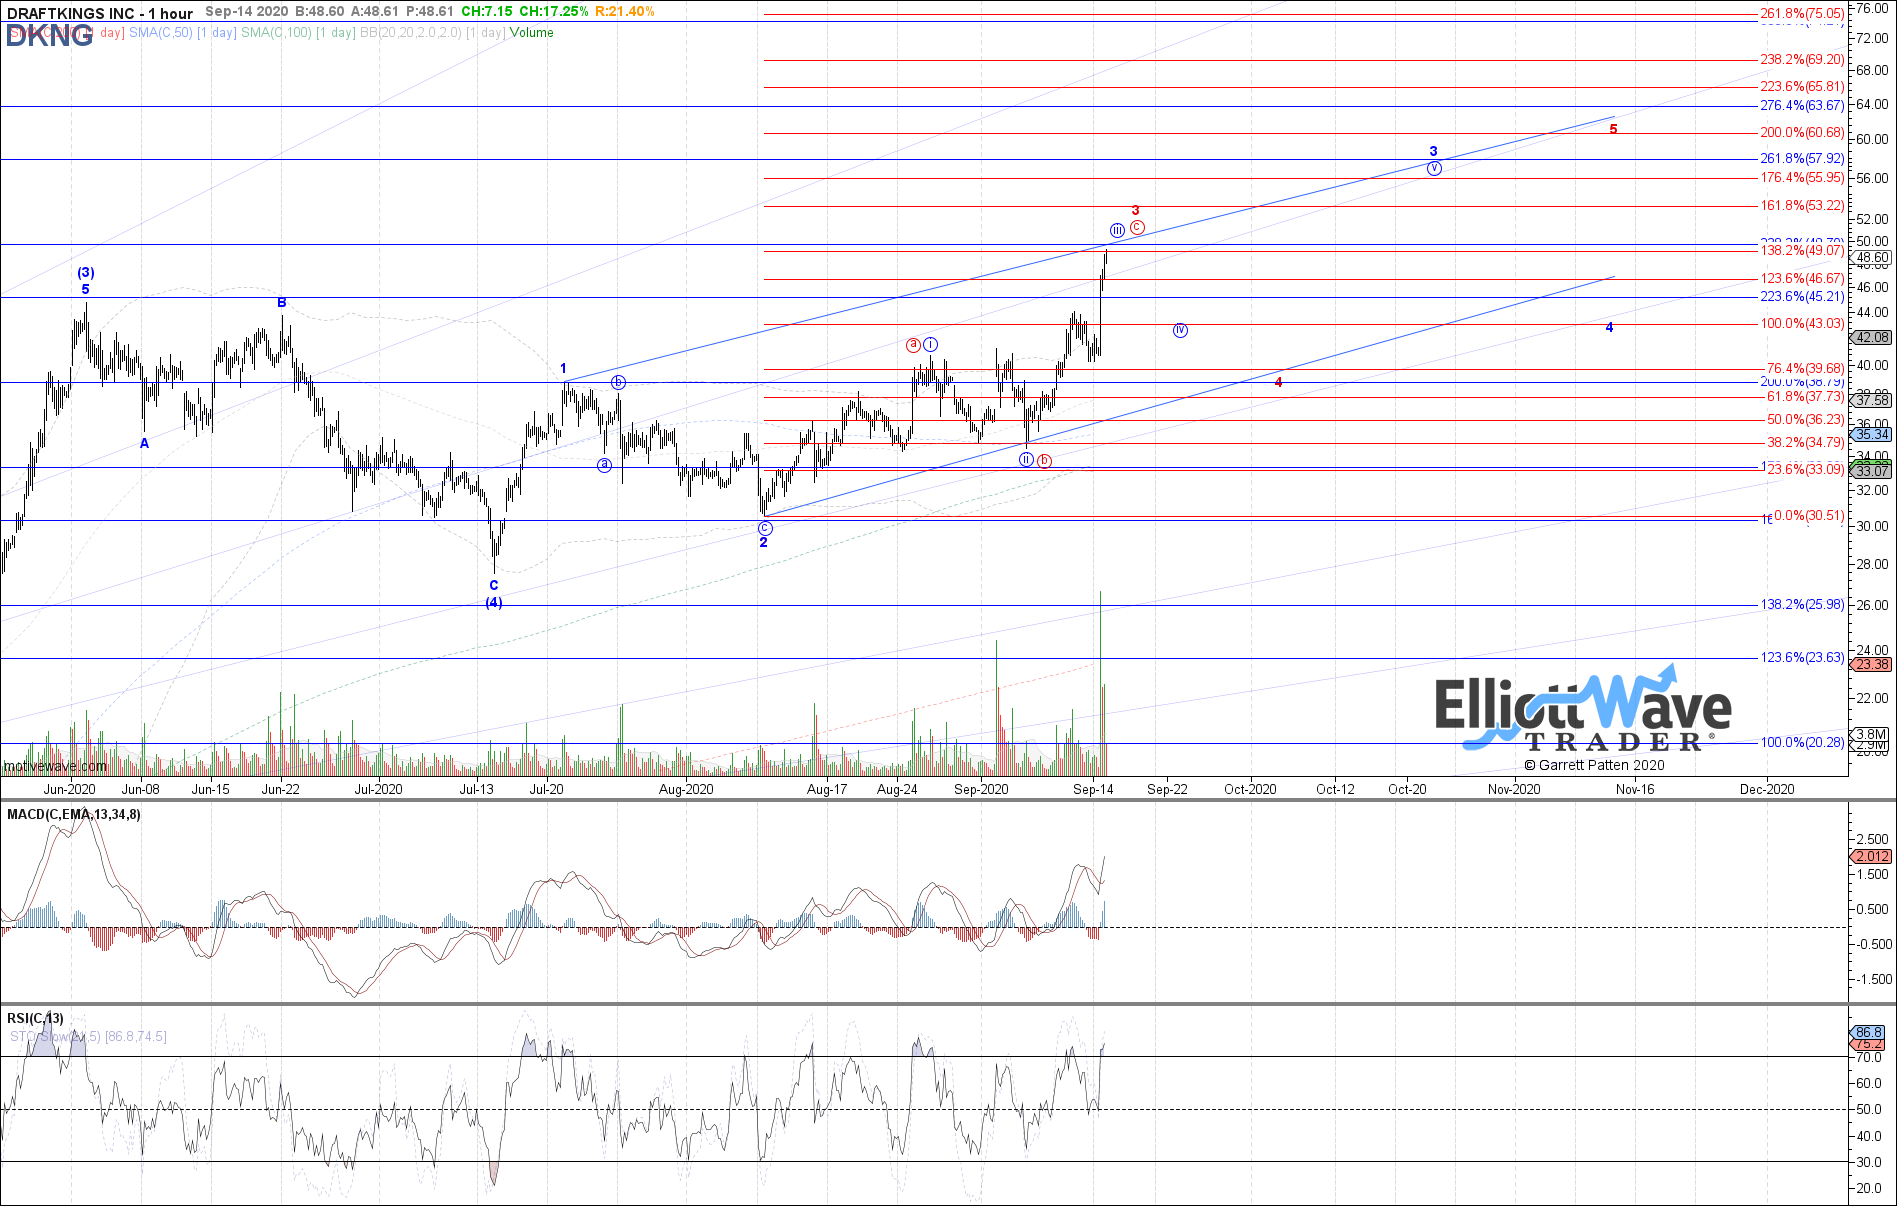
DKNG shot up higher today to now reach the next Fib extension, the 138.2%, at 49.07. This is where price potentially is going to attempt a local top as either circle wave iii of 3 on the chart (if filling out a standard impulse here for our intermediate-degree 5th wave shown in blue), or as circle wave c of 3 in red on the chart (if that 5th wave has instead morphed into an ending diagonal).
View our video providing more on DKNG.
CLVS has done a good job recovering and giving the chart some breathing room again. The stock is still holding our potential 1-2 start of our intermediate 3rd wave to the upside. What we want to see next still is a 5-wave structure (the stock has only made 3 waves so far) off the recent August low as circle wave i of 3 into the 50% or 61.8% Fib extensions between 8.06 to 9.15. More on CLVS available in our video.
ZYME had a strong spike to the upside today, giving back a little into the close. It is interesting how far price has reached. The measured move target for the circle c wave that was the minimum expected target is up at 58.59. So this looks a little big to still be wave 1 of that c.
It could instead already be in wave 3 of c, which would be the most immediately bullish interpretation of the chart, giving price room to pull back in wave 4 (down to 39.26 to 37.48), before turning back up to complete wave 5 of 3.
Other interpretations of the ZYME structure in our video here.
Also covered in our Charts of the Day video are XCUR, AMX, KOD, EHTH, IMGN, LPTX, SFM and TSLA.


