Continued Strength Expected in Coming Days
 By
By
In last weekend's update, we wrote: "It is most likely for us to have some weakness ahead in coming days. I do not know how much of a pullback we will have… but some digestion of these gains will be a good thing for the market. Our open interest curve or the razzmatazz wave also suggests some kind of pullback or sideways consolidation into the beginning of July. While I think we get some kind of pullback, I do not think this is shorting opportunity but just a pause to refresh for more gains. I think we get to somewhere around the 3000-3020 area before a more significant top forms."
What actually happened: As expected, we got weakness over the previous week with post expiration adjustment. Weakness in the initial part of the week was bought back up and we ended close to the highs by the end of the week.
What next? Usually, every weekend, I just post a excerpt of what my expectation is over the coming week in simplified form. This week, I thought we can take a look at some charts also. So you can see what we actually look at before arriving at an expectation for the week.
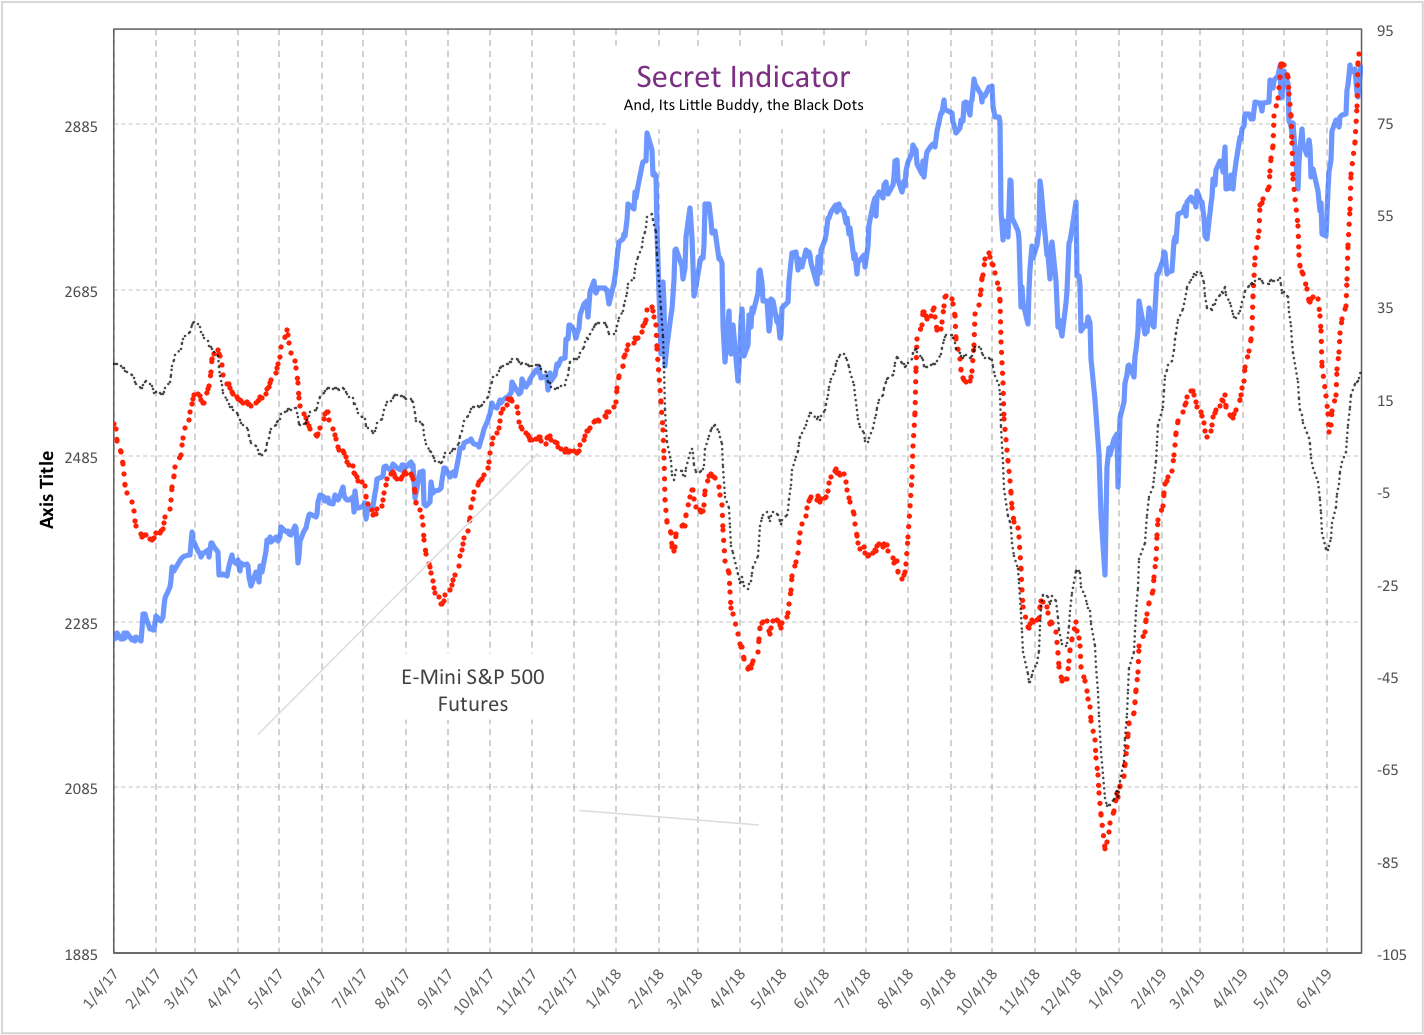
First of all the secret indicator and its buddy the black dots: This is an indicator developed by EHE, so the arithmetic behind it is secret, but the way to use it is simple. When the secret indicator is going up, we do not short and try to be long as much as possible. When both of them are going up together, I call it trend UP and this is something we track in the smart money room. For example, the combo went to trend UP on the 6th of June at 2833 on ES... we are now in the 2950s. And we are still in trend UP mode. Chart below...
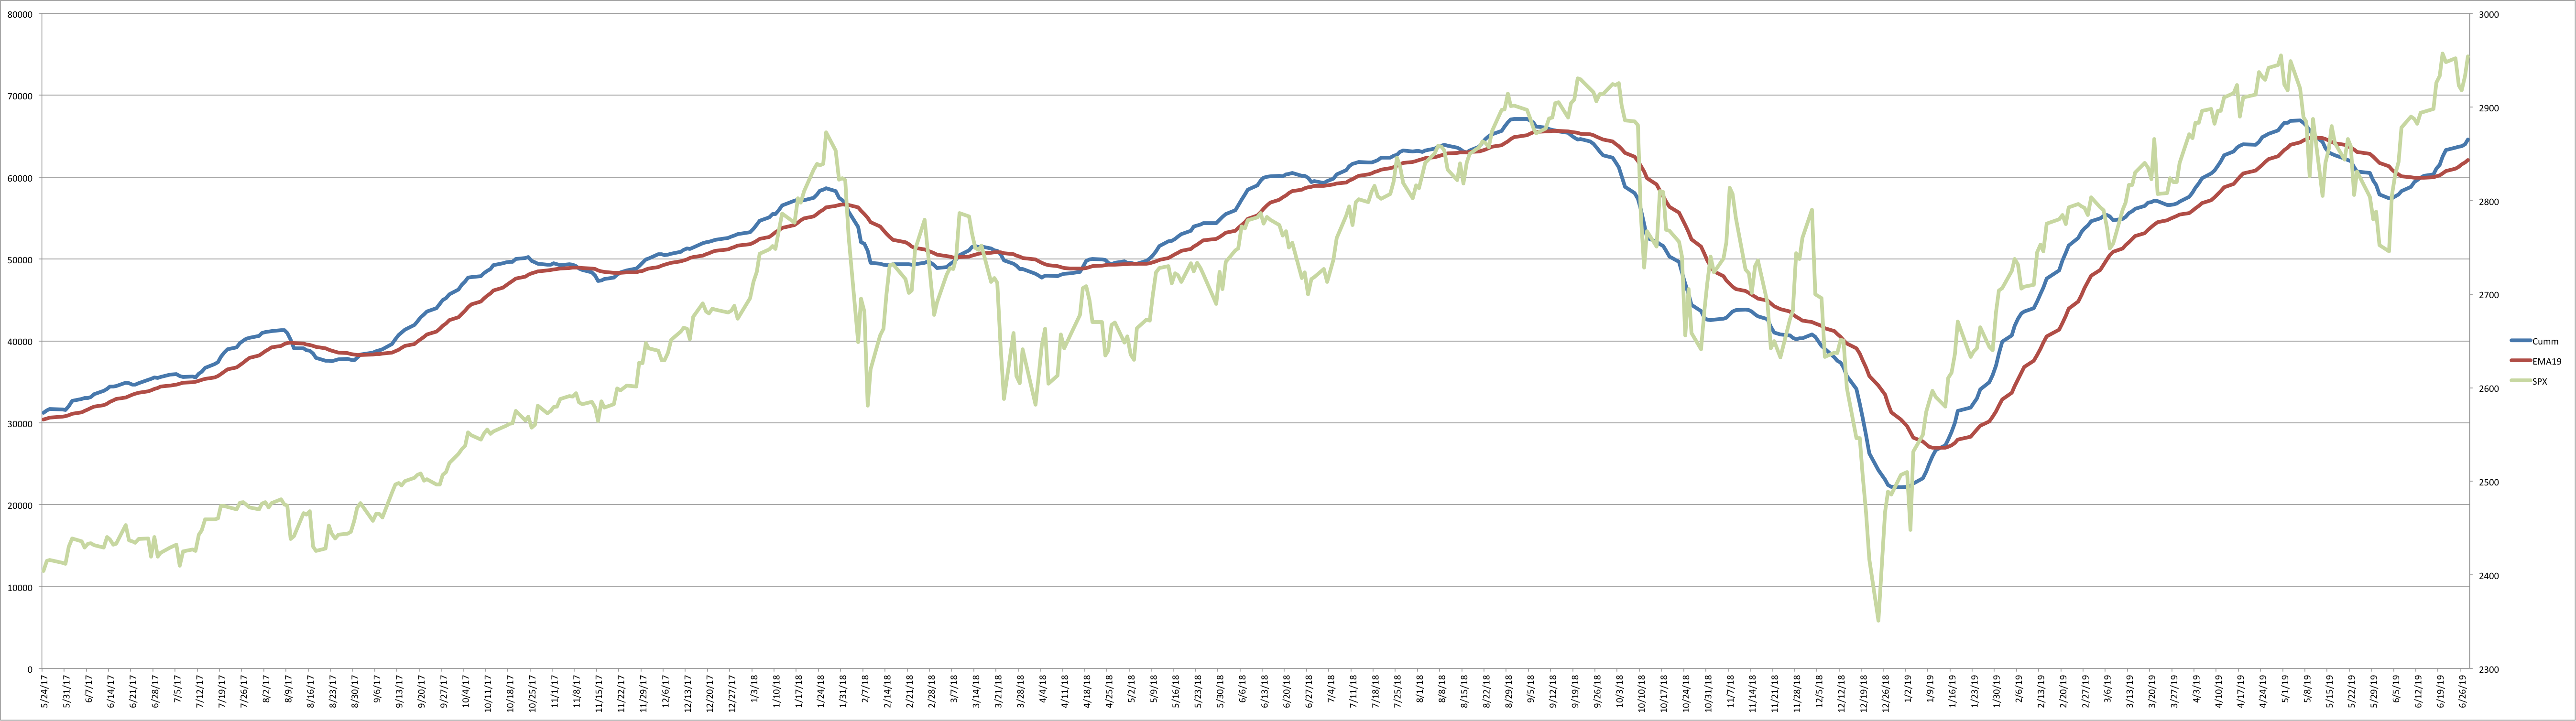
Next the NYHL1M indicator: I have written about this one extensively in the main room as well. The math behind it is not secret. It is based on internal data or breadth of the market, namely new highs and lows on the NYSE index. And from this data, I have built a trend following model which tends to keep you on the right side of the market instead of fighting the dominant trend of the market. The NYHL1M last went to trend UP mode on June 13th at 2890... a little late but joining the secret indicator combo on the long side.
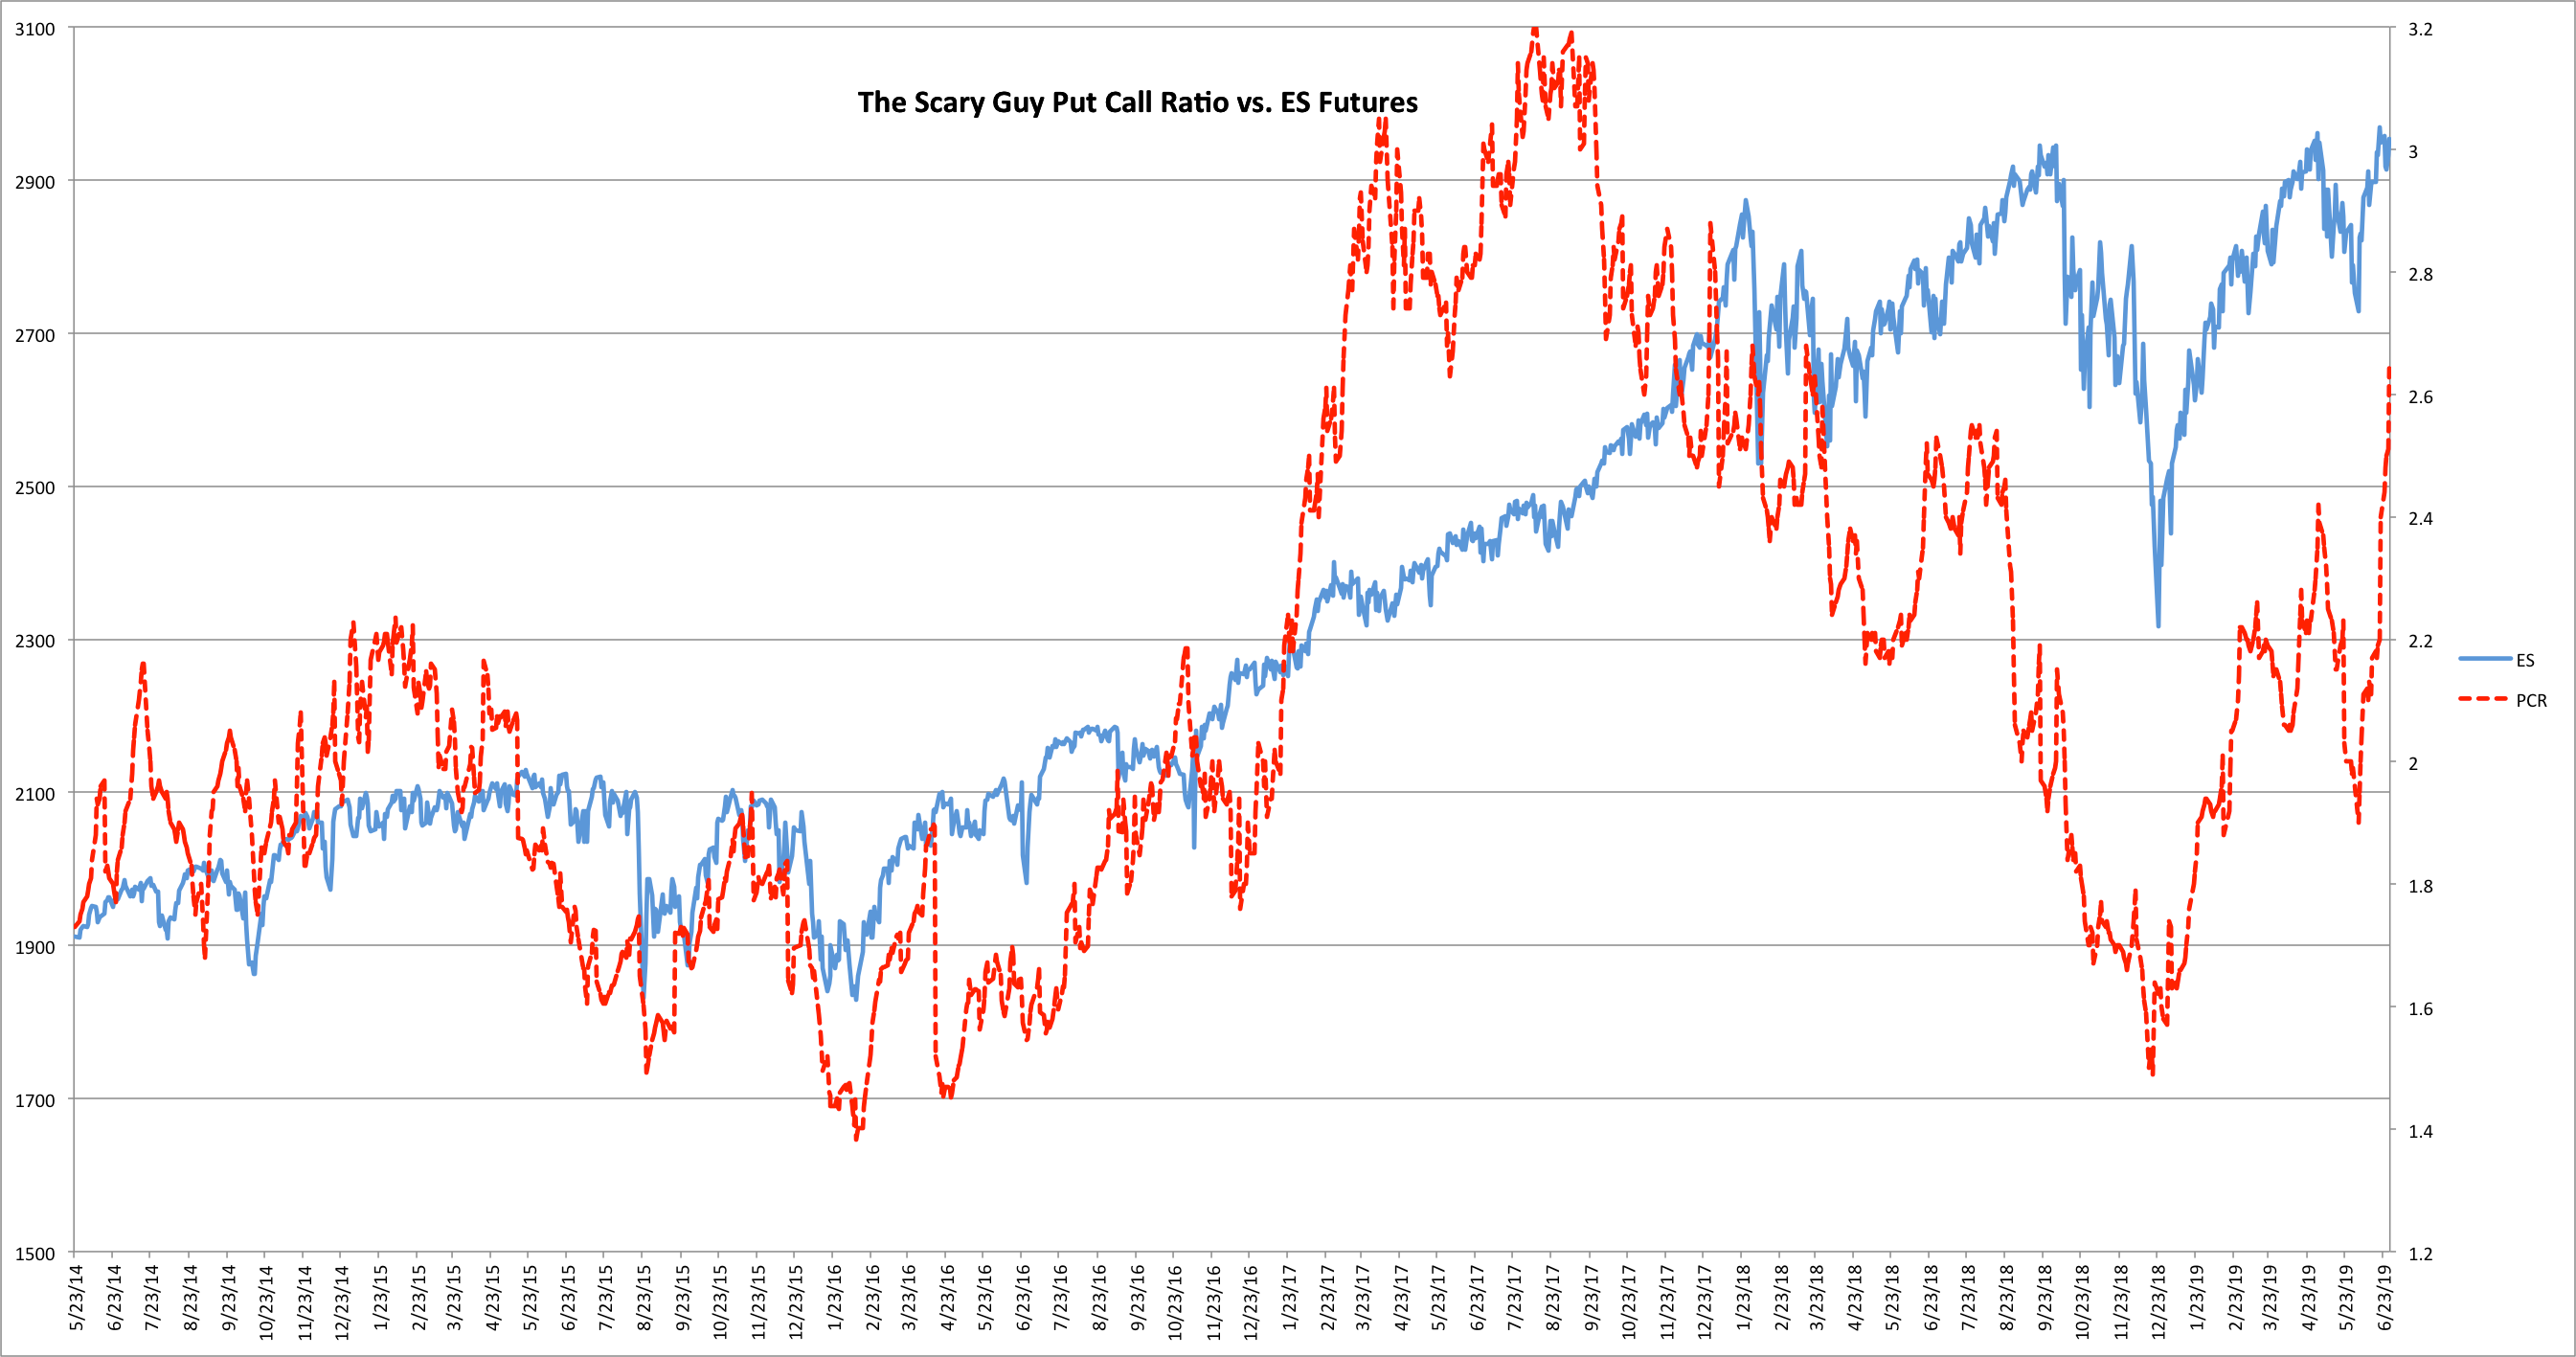
Next up is the Options data indicators: The Scary Guy Put Call Ratio which is the overall put call ratio of ES options hit 2.65 on Friday. I have noted before that the 2.2 number on the SGPCR is kind of a separator between bull moves and bear moves. The last few times we went above 2.2, it began some pretty good moves to the upside. Will it be different this time?….maybe.. but let us go with the odds. This character can be viewed on the chart below...
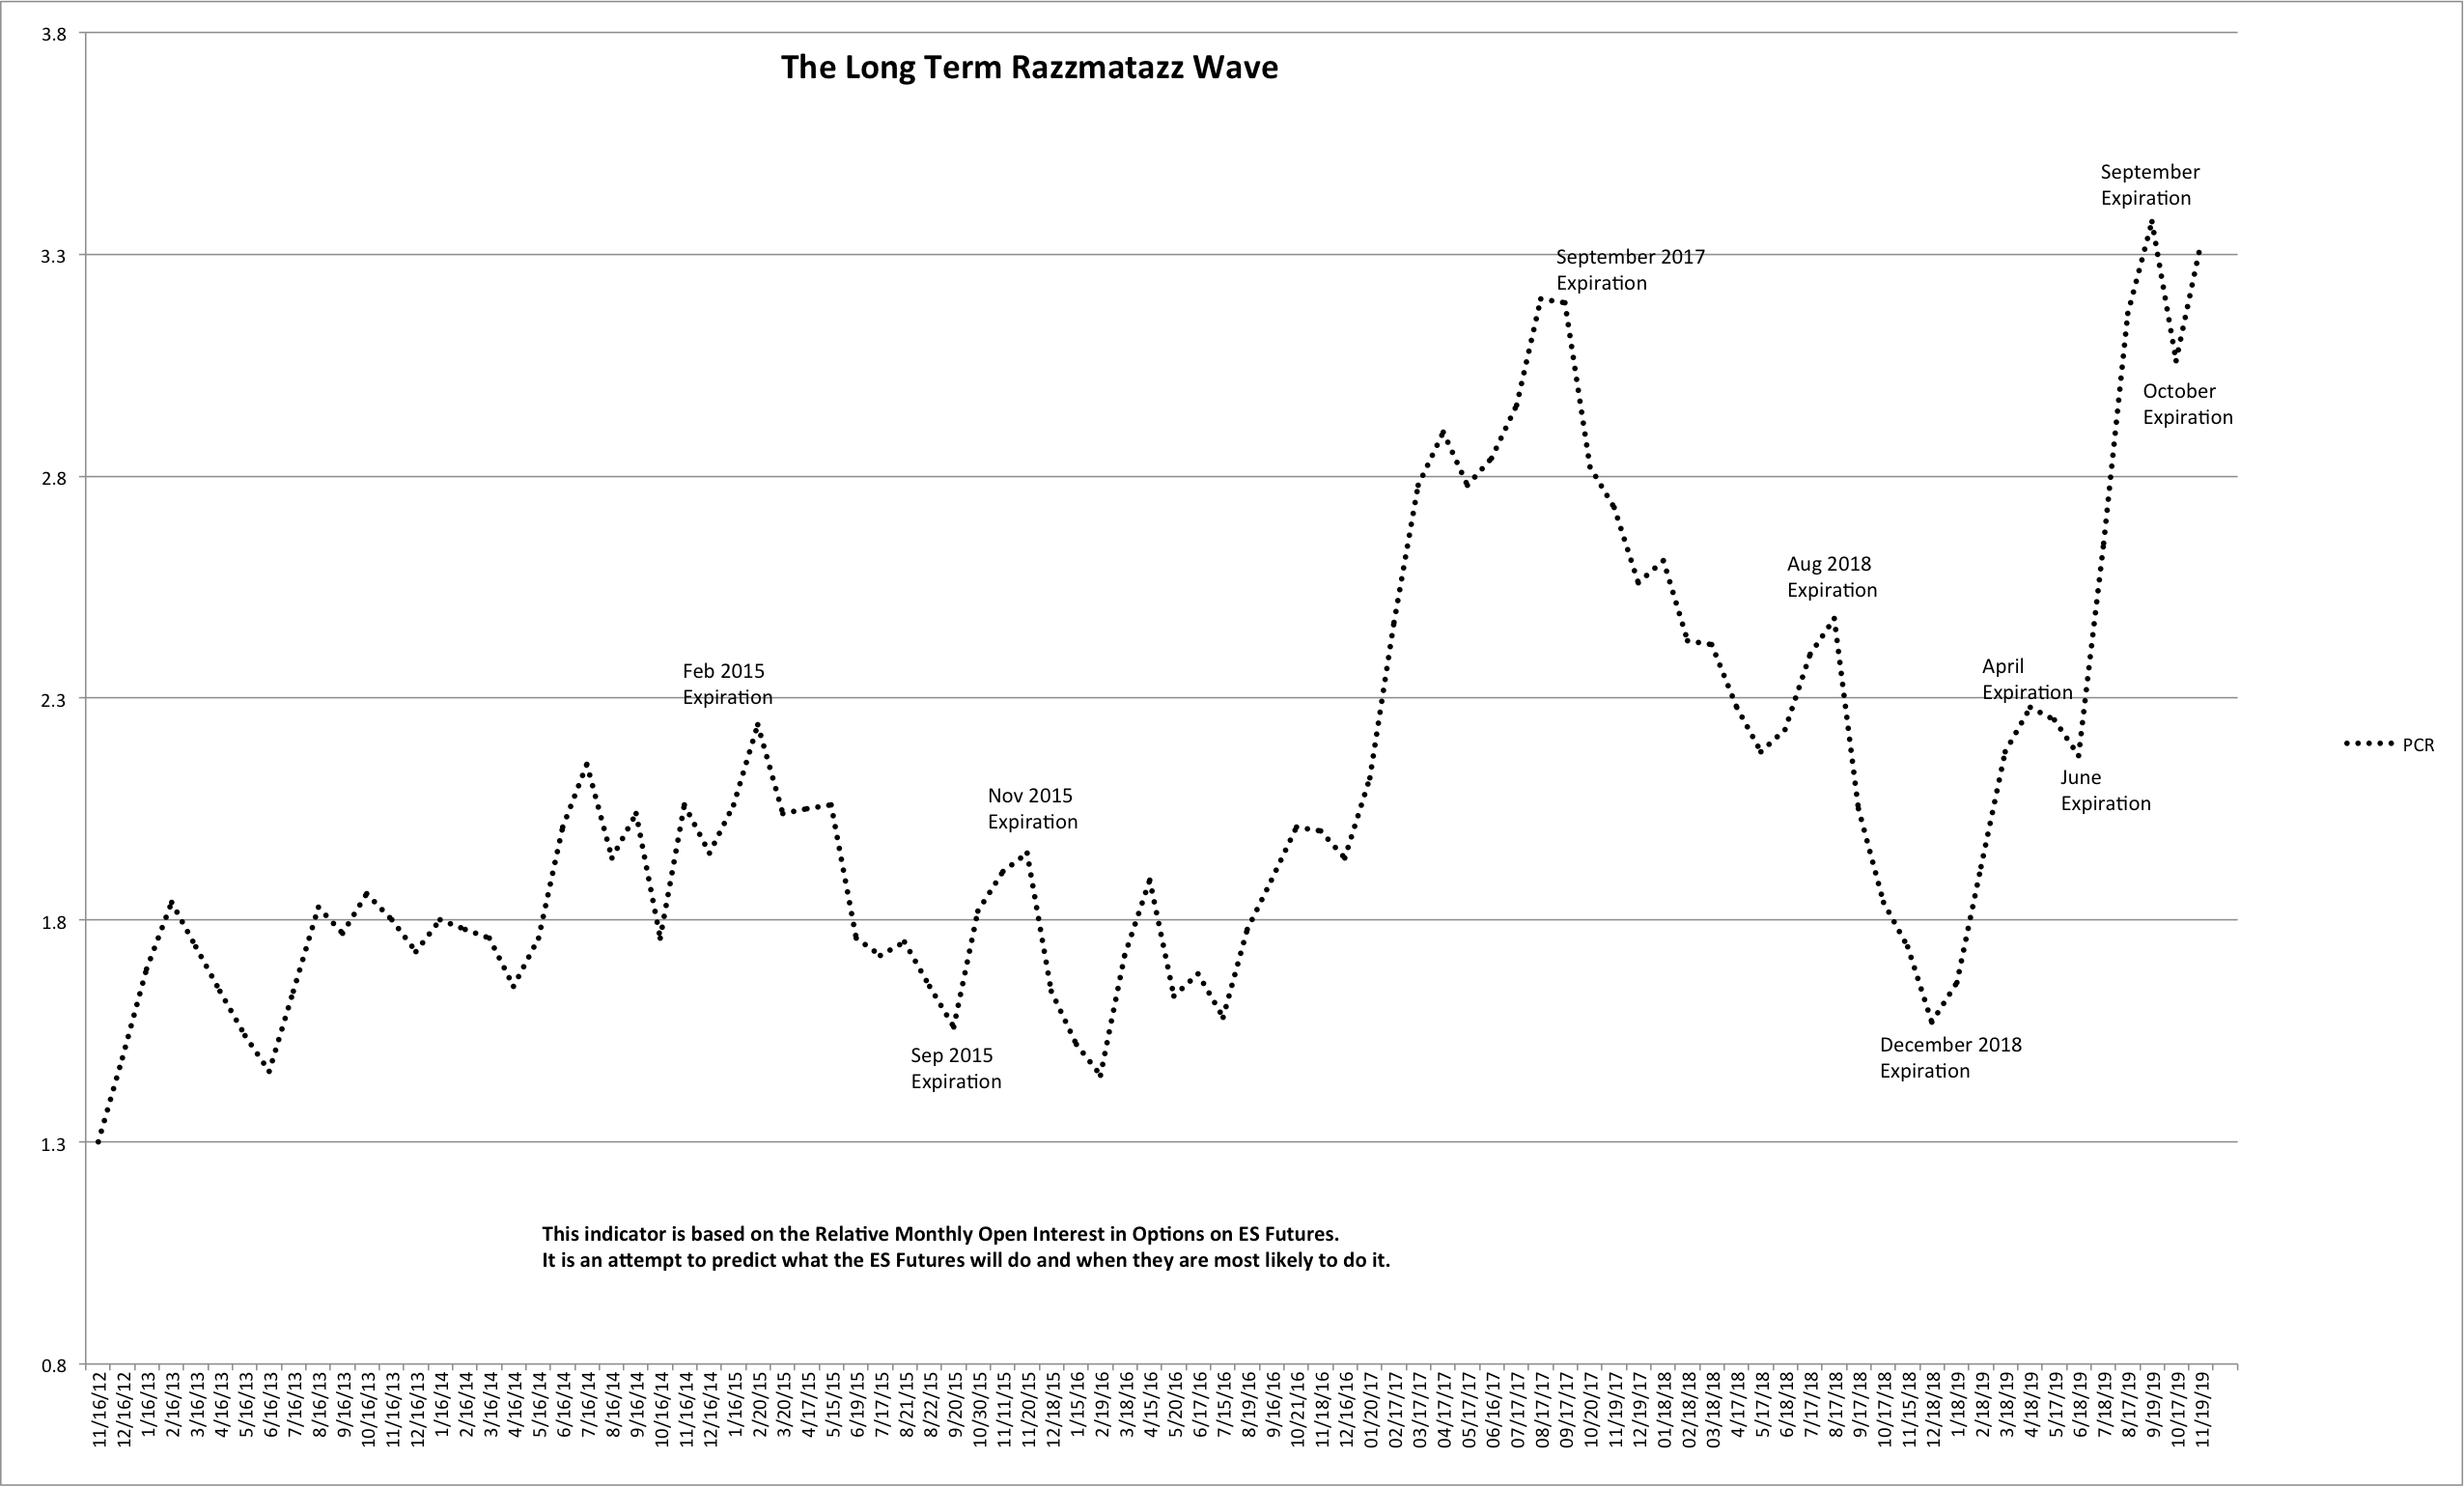
Then, we have the Long term razzmatazz wave which is a projection of how the SGPCR will look into the future: The Long Term Razzmatazz Wave is an analysis model which using Open Interest on ES futures to project how the market may move in the coming months. It is a very rough guideline and so remember when we say move up or down until expiry, it does not mean exactly until the 3rd Friday of the month - but it could have up to +or-2 weeks difference from there. Once again - rough guideline and we use other methods to arrive at more accurate turning points in the market.
The LT Razzmatazz Wave was forecasting a pullback into June expiry. So far, it is looking like the pullback was done right into the beginning of June. From the June low we are pointing higher into September expiry.. and the advance looks to have become a little more stronger over the past week.
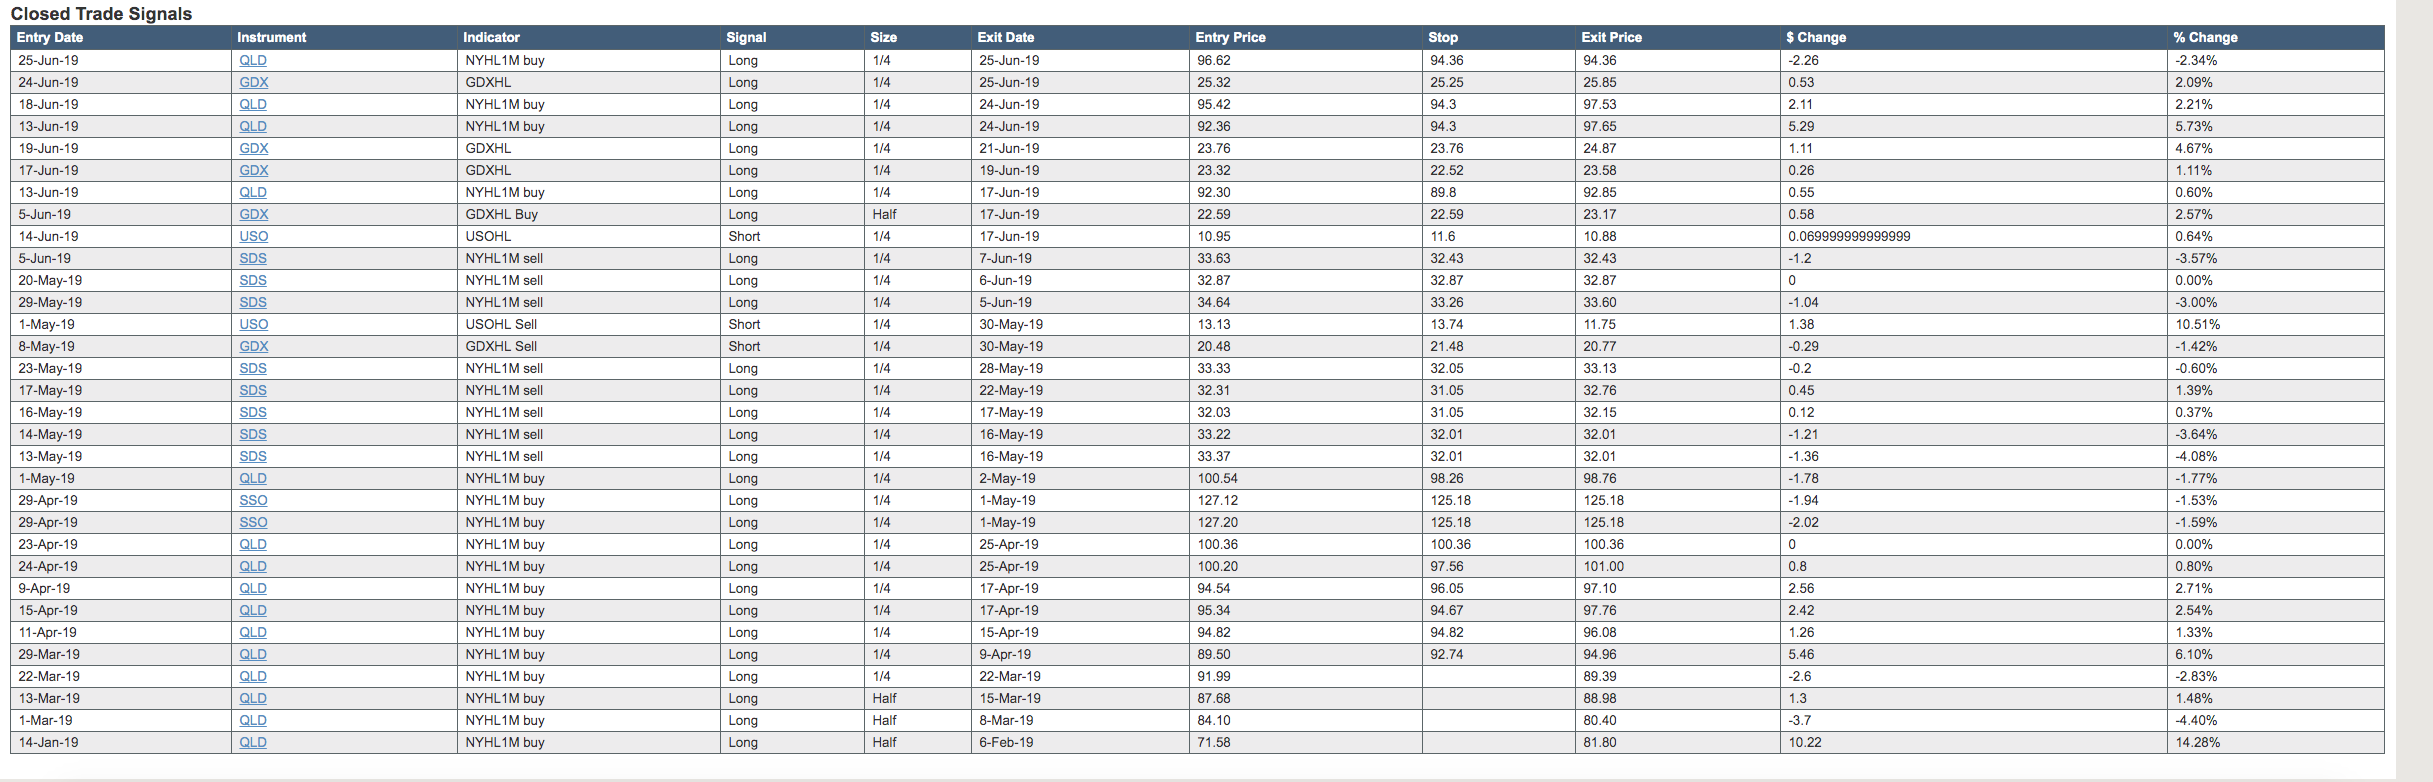
Those are some of the important charts and setups we look at every day in the Smart Money room at EWT (some of them on weekends only). There are other more short term oriented ones which we look at on a daily and intraday timeframes which help us with actual trading. Come join us in the Smart Money room for a trial and see if it is something that works for your trading style. The beauty of the room and the indicators we use is that we do not get swayed by emotion or news since we use mechanical indicators and strict rules to get in and out of trades and this shows in the results.
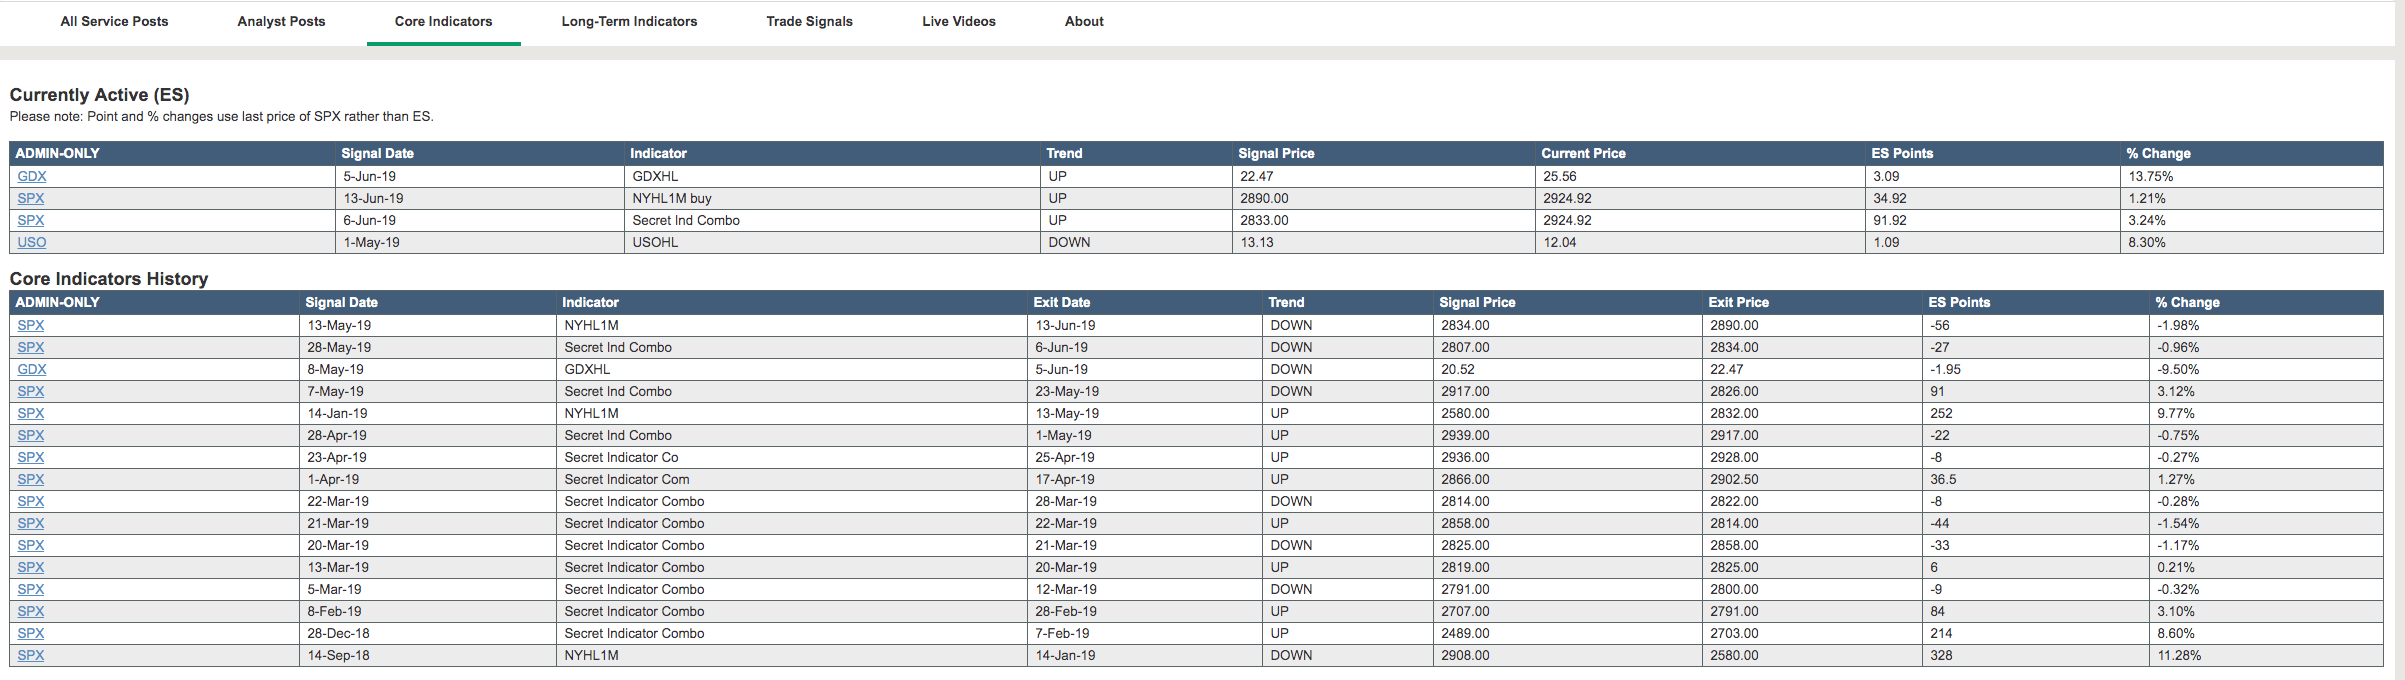
And actual trade results -
Outlook for the coming week:
With all of our Smart Money room indicators bullish, and the actual raw options data also bullish, let us continue to expect strength in the coming days and for the market to move above all time highs into the 3000 range. This 3000-3020 area would be the spot where the market may finally have a bigger reaction lower in the coming weeks - as we tend to do every 100 point round number. And this is a 1000 point round number as well. The 2914 area is support on ES and this is what bears need to break before we can entertain the idea of a top. On the upside, 2970 area needs to be taken out for us to get to the 3000-3020 range. As always though, we will use our indicators to tell us when to close off our long positions and go short - whenever they turn. Until then, we stay long.
ES Grey Zone areas: The grey zones on the ES 5 min chart below are what I draw in on a discretionary basis - they are supports and resistance areas which the market is most likely to react from. If we test a zone from below, it is likely to be rejected and fall lower to test support zones below. If we test a zone from above, it is likely to take support there and begin a move higher. So these zones can be used for intraday trading and/or as entry points for positioning for swing trades. These zones are drawn in based on what the market has done there previously both on smaller and larger timeframes.
Grey zone support now at 2935-43, then 2919-2913. Resistance zone at 2960-2967… and if we get above this, next resistance comes up at 2980 and then 3000.
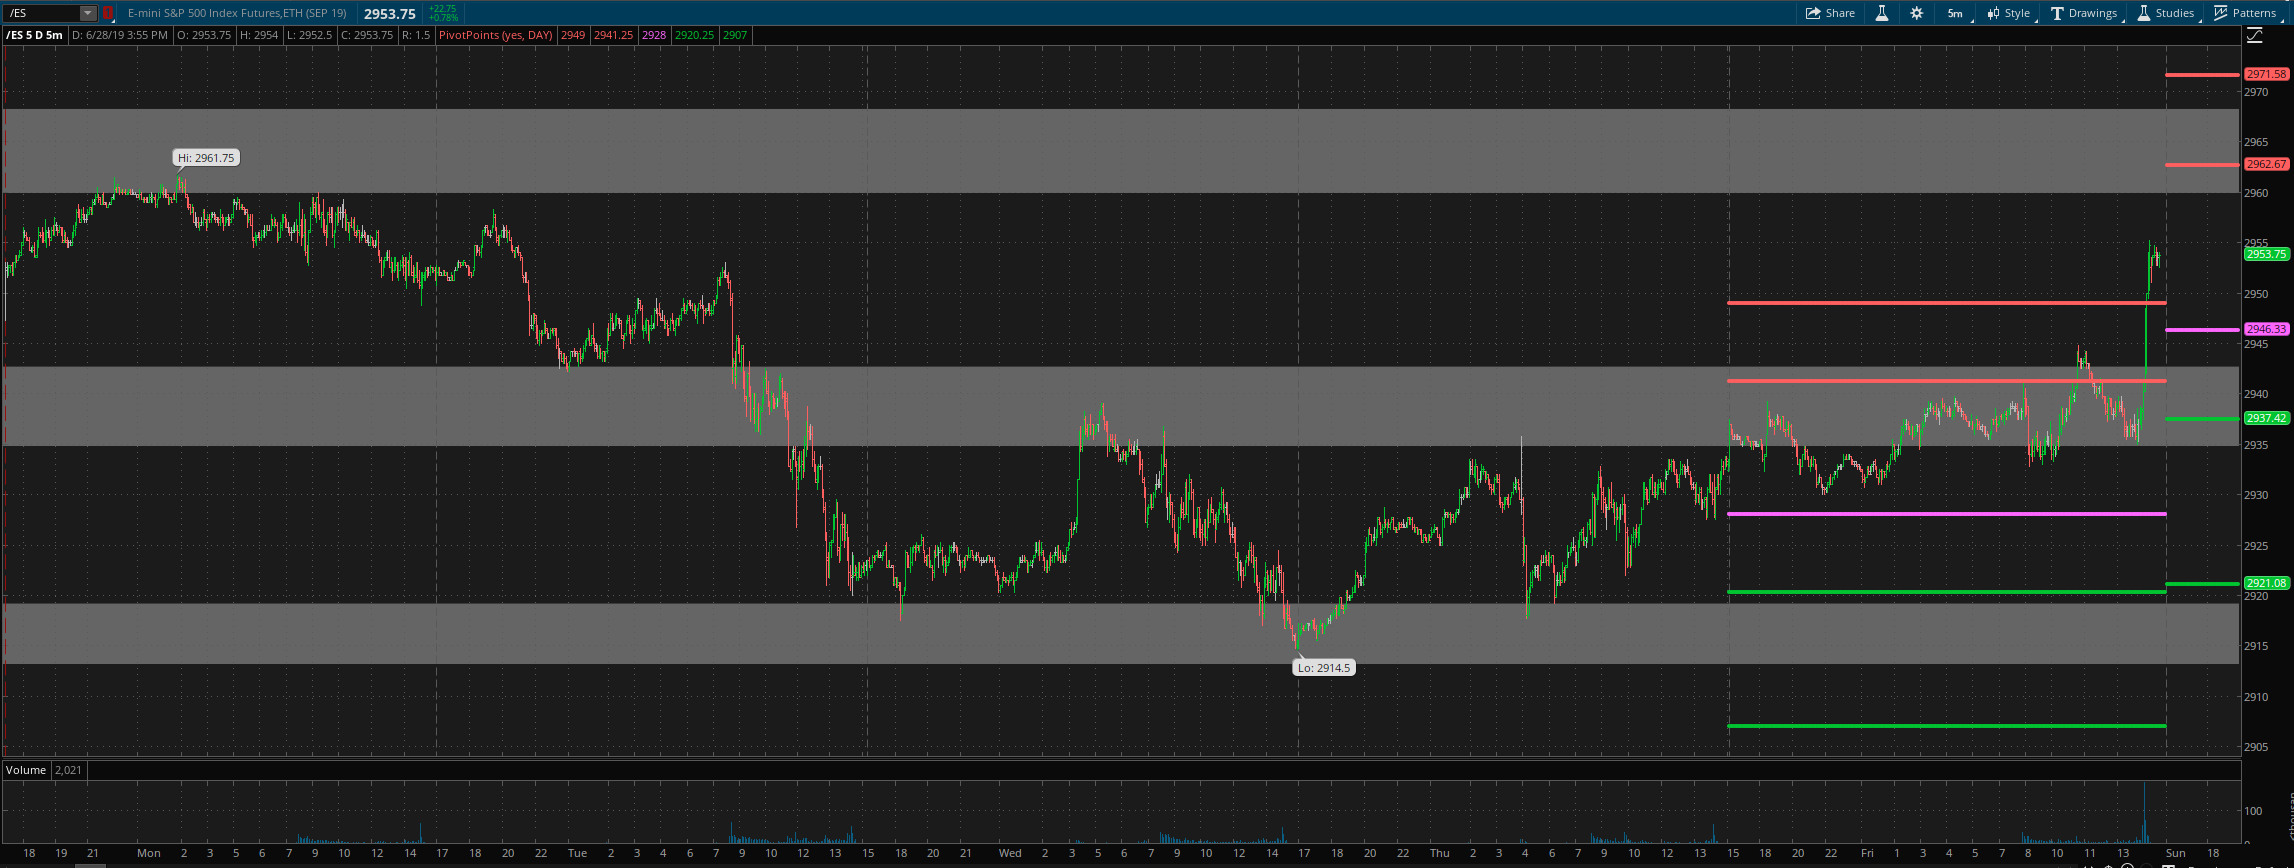
For Monday daily pivot is at 2946. Resistance R1 is at 2963 and R2 at 2971.5. Support S1 is at 2937.5 and S2 at 2921.
All the best to your trading week ahead.
