Closing In on Bigger Resistance
 By
By
in last weekend's update, we noted that we tested the first support at 2680 before the hard bounce to end the week. We wrote:
"This bounce has taken us right back up the resistance area at 2710-18 area. I want to see another leg lower begin from around here down to the 2650-25 area. But if we make it through the 2710-18 area, odds will begin to shift to us having one more high out there in the 2760-80 area - the daily razz supports the idea of one more high on Wednesday."
We did make it through the 2710-18 resistance zone and did make it to another high getting very close to 2780 to end then week.
What's next?
The S&P 500 is getting very close to the bigger timeframe resistance zone at 2809-25. As I have been saying for a while, it is tough for me to see us exceeding this without some sort of consolidation or a bigger pullback lasting for more than a few days.
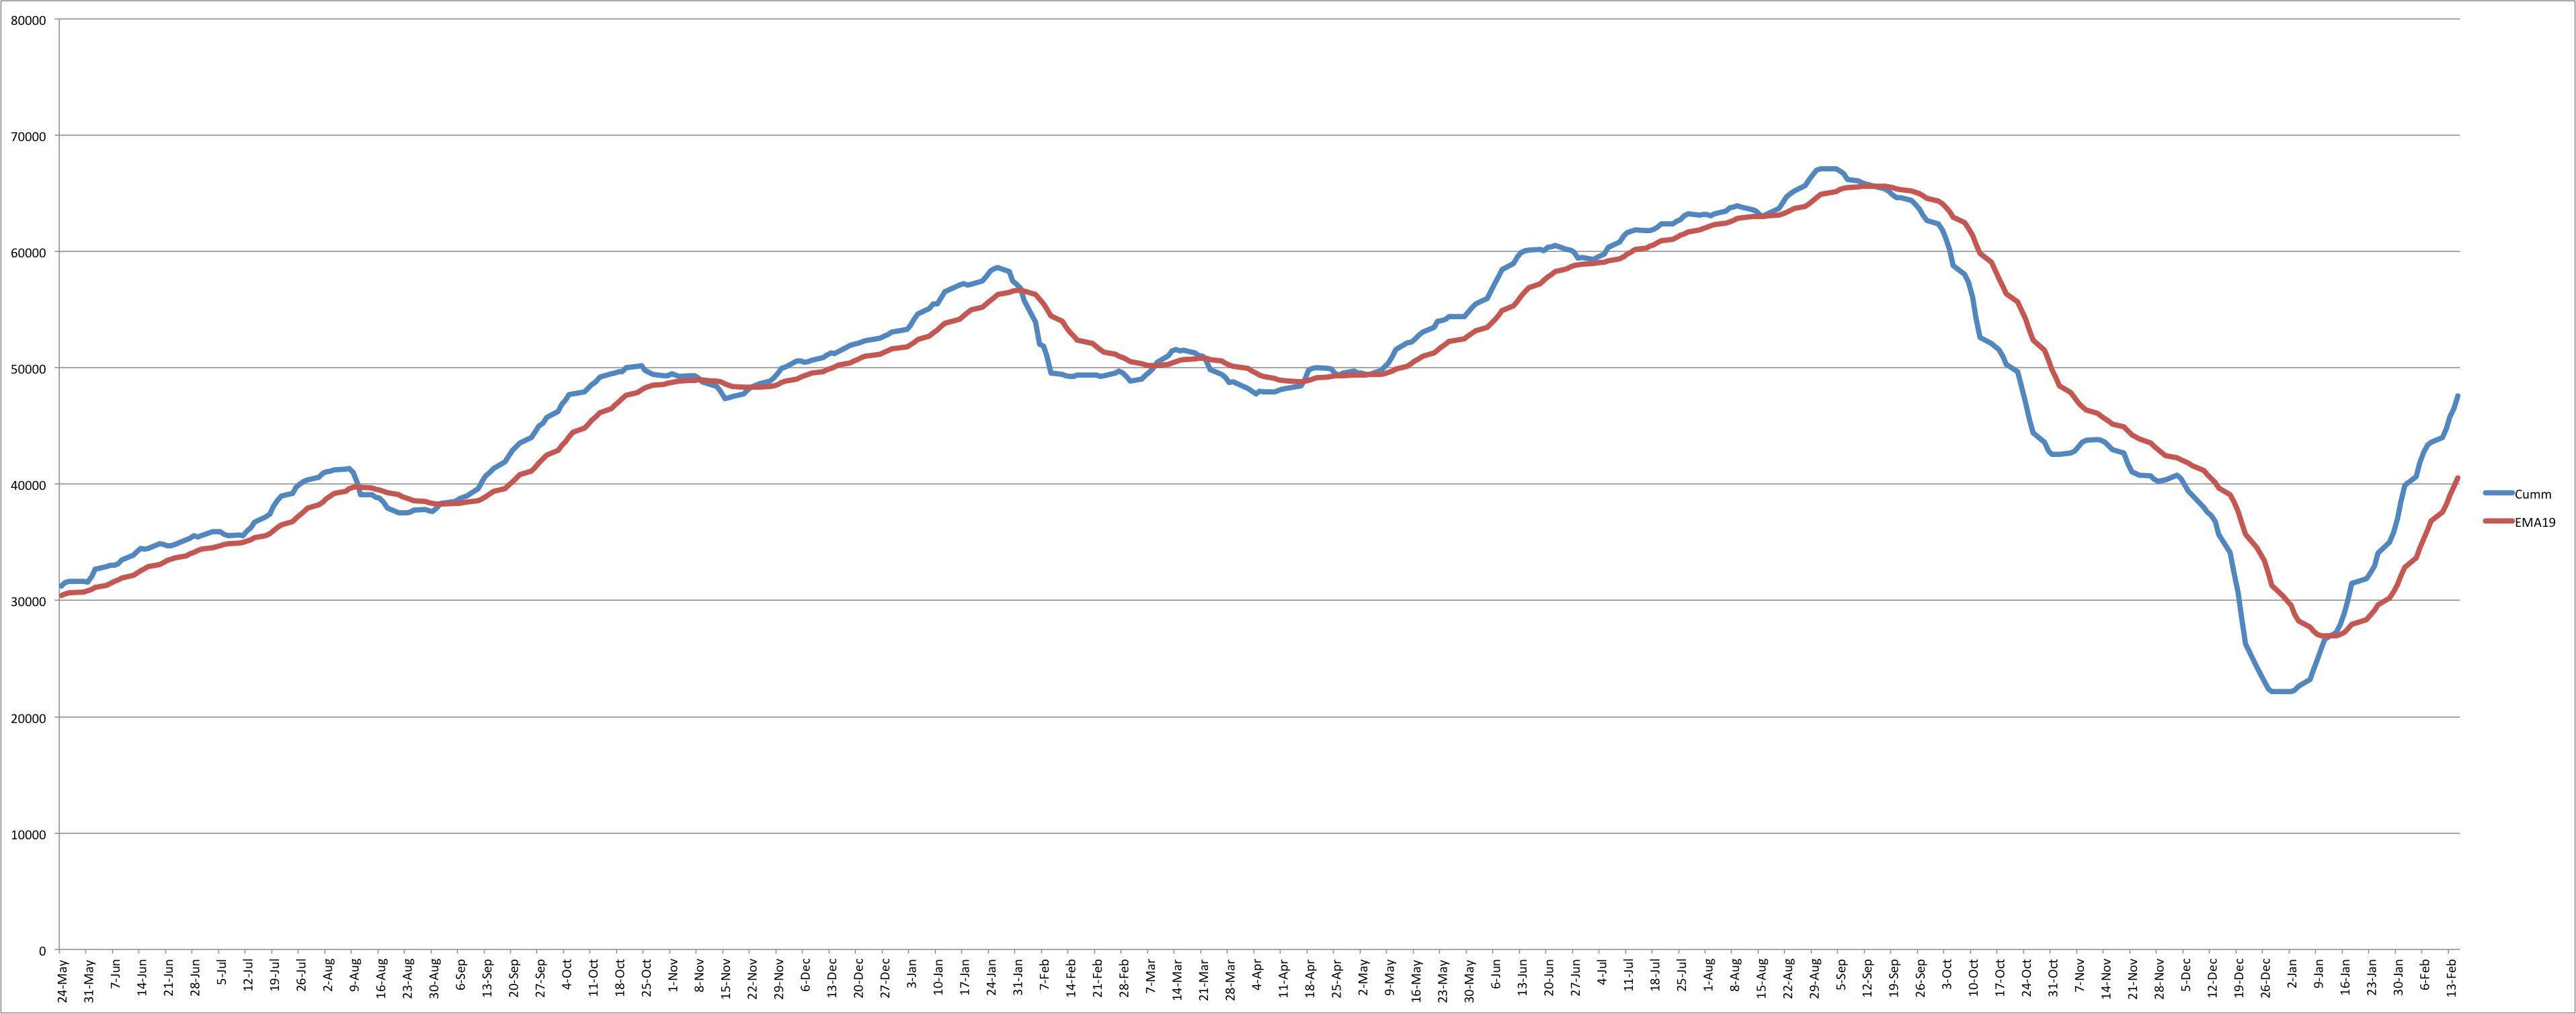
Even if we do not pullback a lot, there should at least be some consolidation in time before we can advance further. Note that all of our models we follow in the Smart Money room still remain on a buy, and I have been cautioning against shorting since Jan 14th when our "NYHL1M" signal (which is based on the cumulative value of new highs and new lows on the NYSE) went to a buy.
There is no change in this cautionary view, but I do need to see some kind of pullback materialize before committing capital back to the long side.
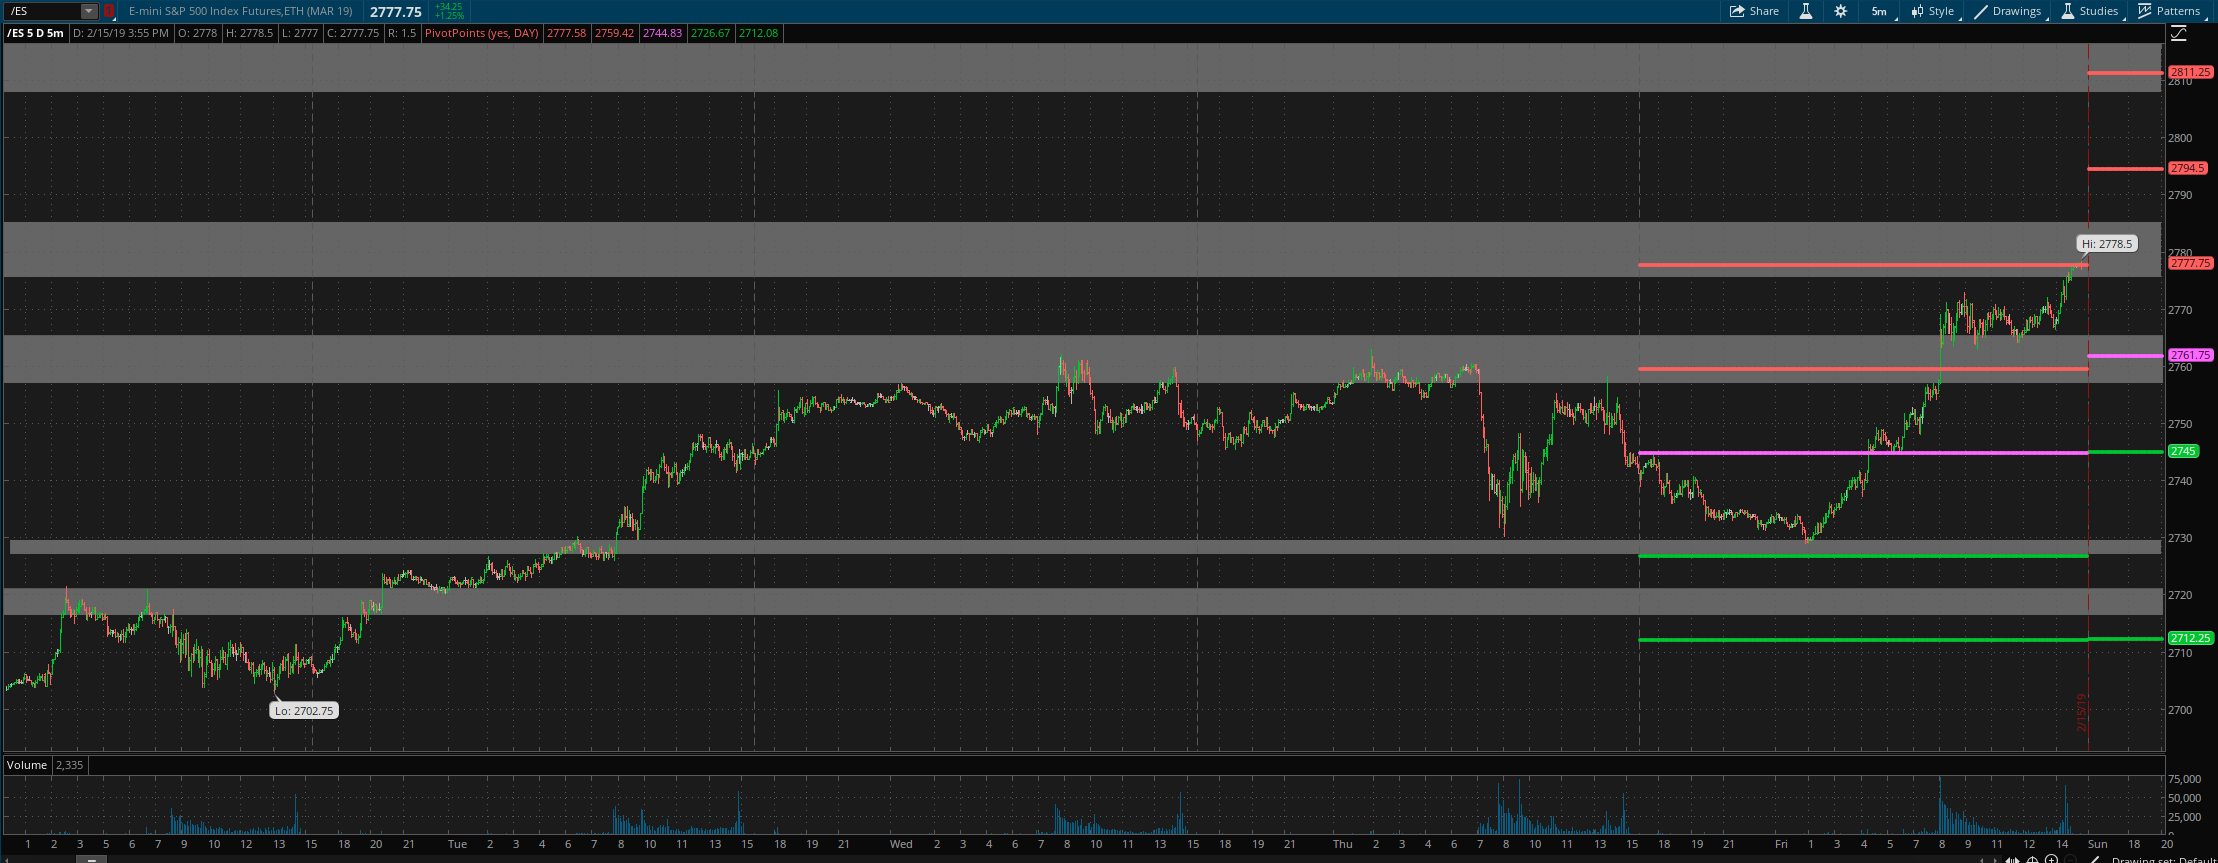
ES Grey Zone areas: We are in the first resistance area right now at 2776-84, second area up is at 2809-25. On the downside, we have support at 2765-58, then 2730-27. Below this support is present at 2721-16. Right now the 2730-27 support looks most important to me. As long as this holds, bulls have the upper hand on the intermediate term.
ES daily pivot is at 2762. Resistance R1 is at 2794.5 and R2 is at 2811. Support S1 is at 2745 and S2 is at 2712.
All the best to your trading week ahead.
