Close In Time (Though Maybe Not In Price) To A Low
 By
By
In our update last weekend we noted that "we think we have more pain ahead at least on the very short term and that we need to tag at least the 3500/3450 area before another opportunity at a short term upmove."
What actually happened is that after a pop into the middle of the week, the market sold off to end the week almost flat.
It is quite the interesting market we have here right now. In a lot of ways this is the exact opposite of how things were last year. Relentless uptrend with glimmers of a selloff showing up occasionally only to get steamrolled by the bulls within few days. Right now, we have signs of an uptrend showing up, which is very quickly sold off. Market seems to be falling more on lack of buying than outright selling, but I do not have any actual data to substantiate this, just feels that way.
While we are clearly in a downtrend, I also think we are very close in time to a low, possibility a big one similar to March 2020 -- close in time but maybe not close in price. And yet because no one will be able to pick the exact low, we have to keep taking the setups as they come. On price, we need above 3771 on the S&P 500 to signal that we may have a low in place, with confirmation above 3820. On the downside, getting below 3571 means we test the 3500 and maybe the 3450 areas next.
Price action is bearish short term, bearish medium term and bearish long term.
Grey zone resistance at 3675-94, 3729-44 and then 3810-24. Support is at 3631-14, 3586-68 and then the 3540/20 area.
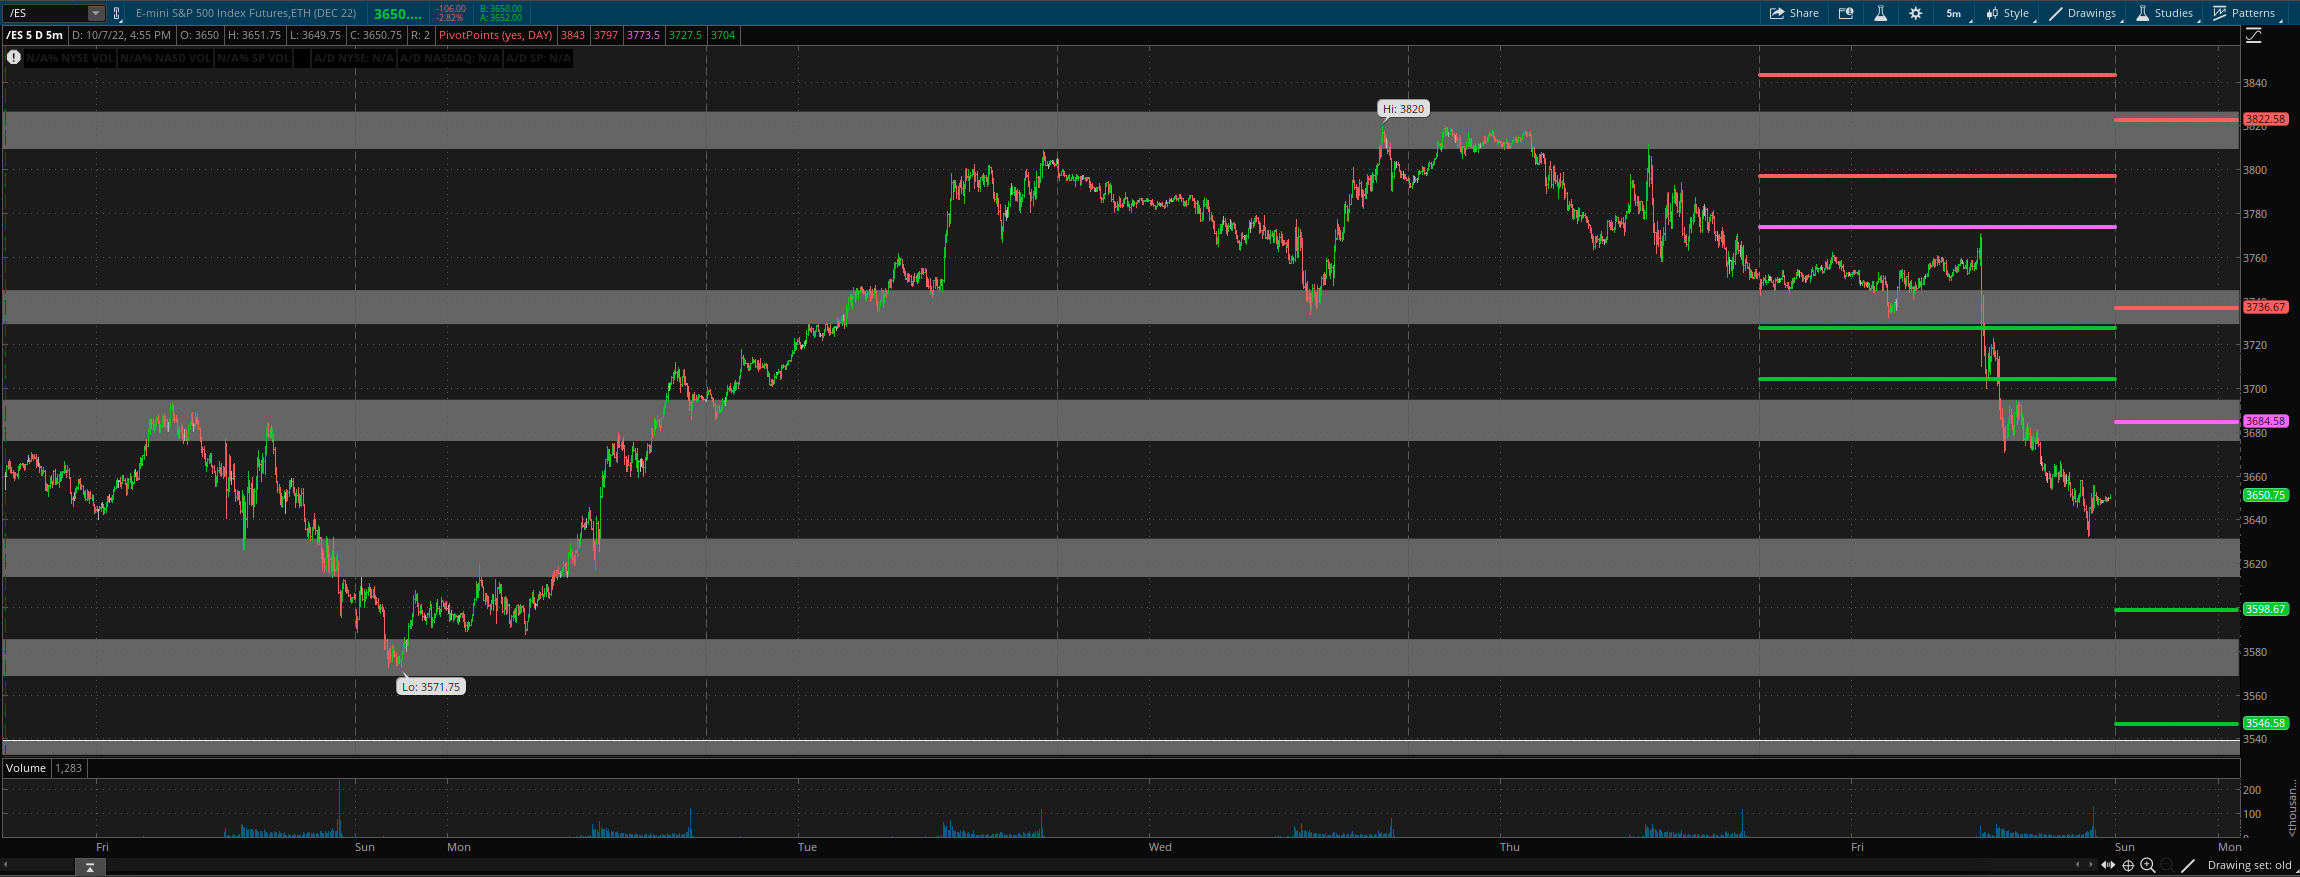
For Monday, daily pivot is at 3684.5. Resistance R1 is at 3736.5 and R2 at 3822.5. Support S1 is at 3599 and S2 at 3546.5.
All the best to your trading week ahead.
