Charts to Watch: BRK, TWTR, IRBT, MYL
 By
By
Today's Charts of the Day video covers Berkshire Hathaway Inc. (BRK-B), Twitter, Inc. (TWTR), iRobot Corporation (IRBT), and Mylan N.V. (MYL).
BRK-B, with its move up over 5% on Wednesday and nice breakout above down-trendline resistance, should be starting its wave 5 up. But price is still within the first wave of that 5th (see circle wave "i" on the chart). So don't expect a straight line to fill out all of that 5th wave, as we'll probably see a consolidation into circle wave "ii" after it fills out a little bit higher.
TWTR, which was down more Wednesday, still does not appear to have completed its 4th wave down (circle wave "iv" on the chart). A standard retracement of .382 of the prior 3rd wave points to 39. So do allow for further downside if trading the stock, with 39 being main support underneath that should hold in order to set up one more higher high of circle wave "v" of the larger 5th wave into the mid-50 region next.
IRBT, which also saw a little bit of a struggle Wednesday, has not given us the cleanest indication either that price is ready to head immediately higher. The high that was made earlier this month was only made on 3 waves (instead of 5), so it could easily be in a "b" wave within the larger flat structure, and price could come back down to 75-73 again. As long as it holds above the 200-day moving average at 71, then further upside can still be expected in that wave "v" of the larger circle wave "iii" on the chart.
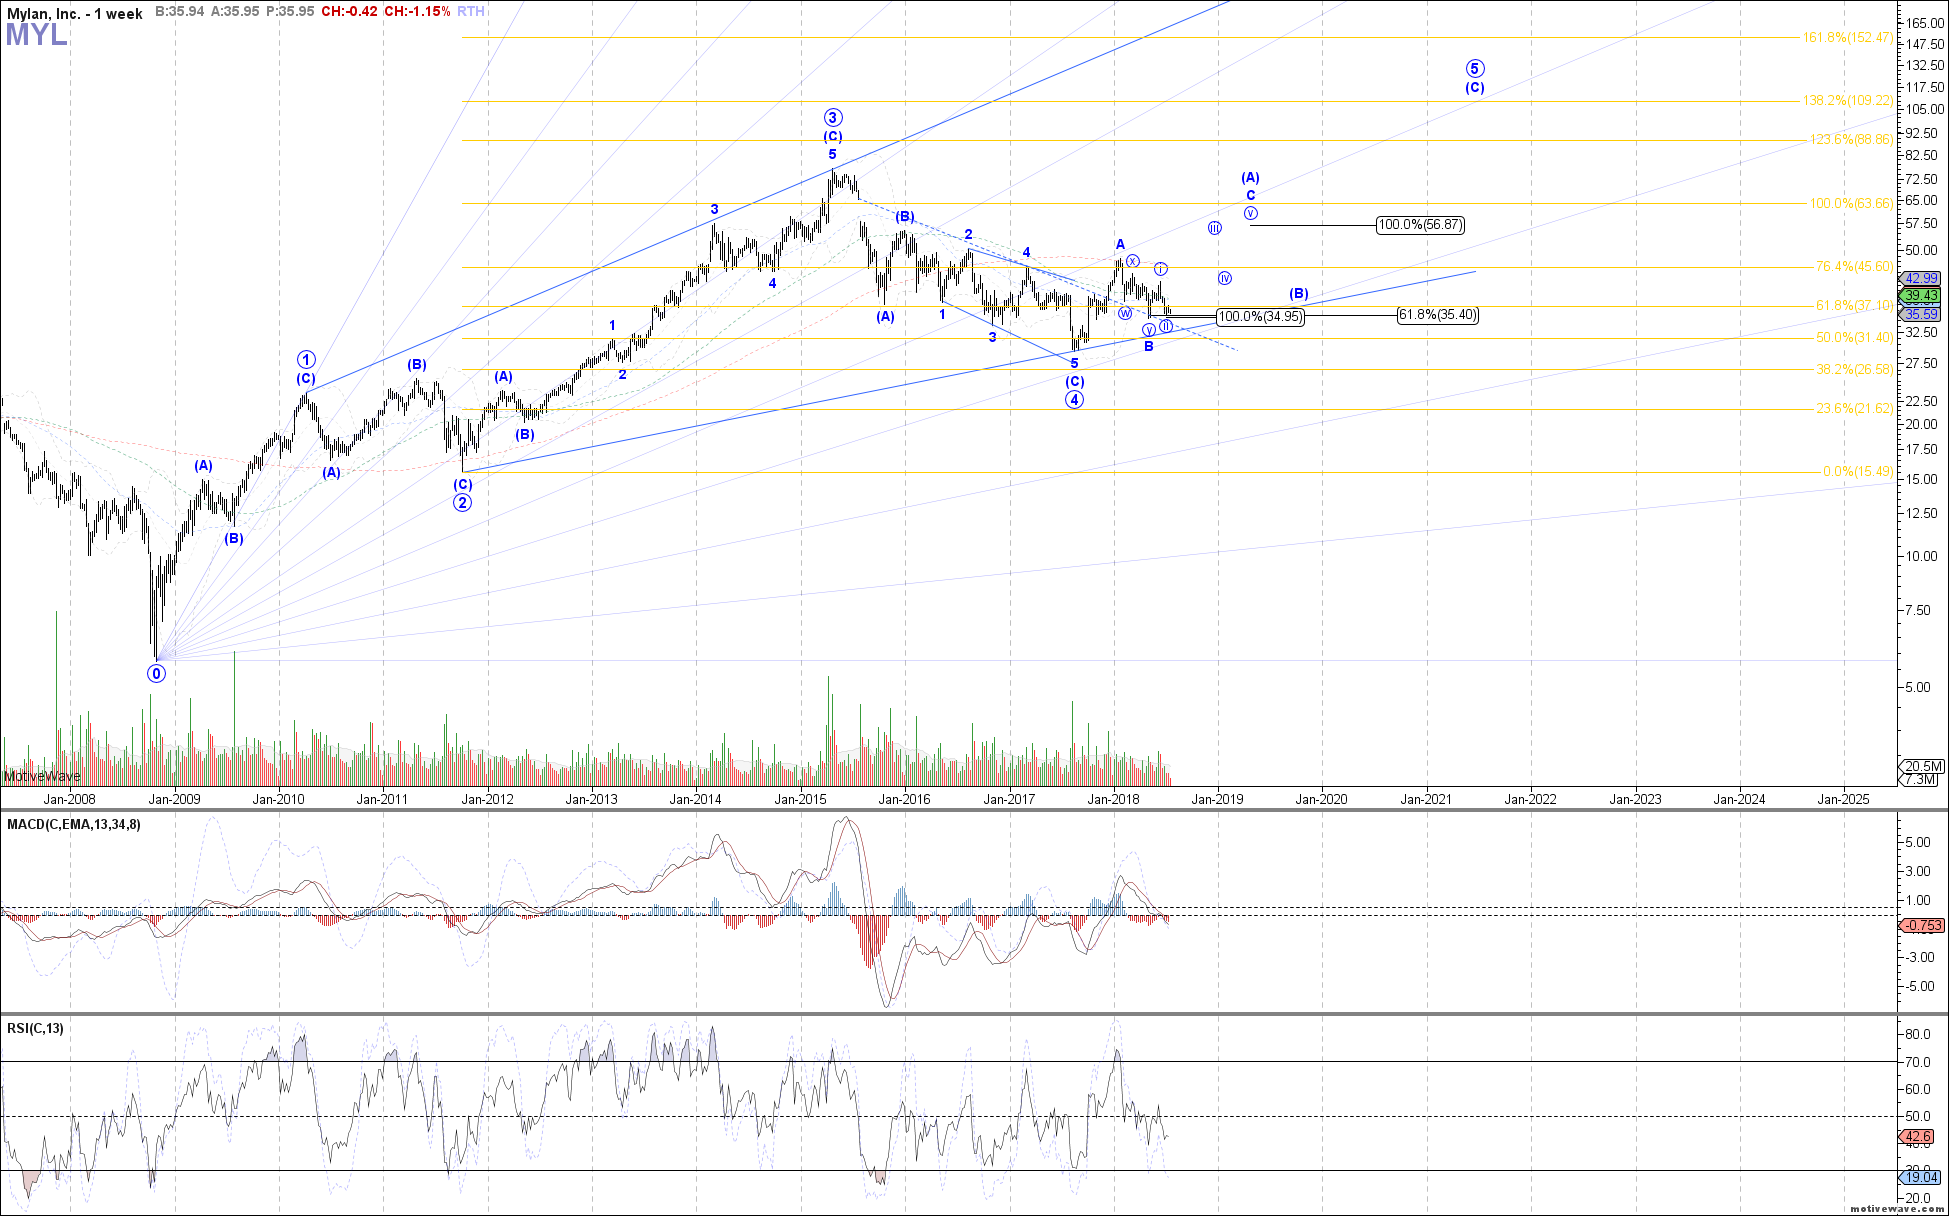
MYL, also down Wednesday, has left us with three waves in its most recent bounce off the July lows. There's not a lot of room left until it does come down to retest that prior May low, and if that breaks it would invalidate this being 5 waves up as the start of our "C" wave higher. The alternative is that maybe this "B" wave has not completed and needs one more low below. If that happens, main support would be the trend line support as well as .786 retrace at 32.62.
But looking at the weekly chart, even if we do see that lower low in the "B" wave, price is still set up strongly for at least a measured move higher in wave "C" into the low 60's.