Chart & Wave Analysis on SBLK, XBI, EEM & MCD
 By
By
Today we feature charts and wave counts by Garrett Patten on Star Bulk Carriers Corp. (SBLK), SPDR S&P Biotech ETF (XBI), iShares MSCI Emerging Markets ETF (EEM), and McDonald's Corporation (MCD), with more detail available in the video.
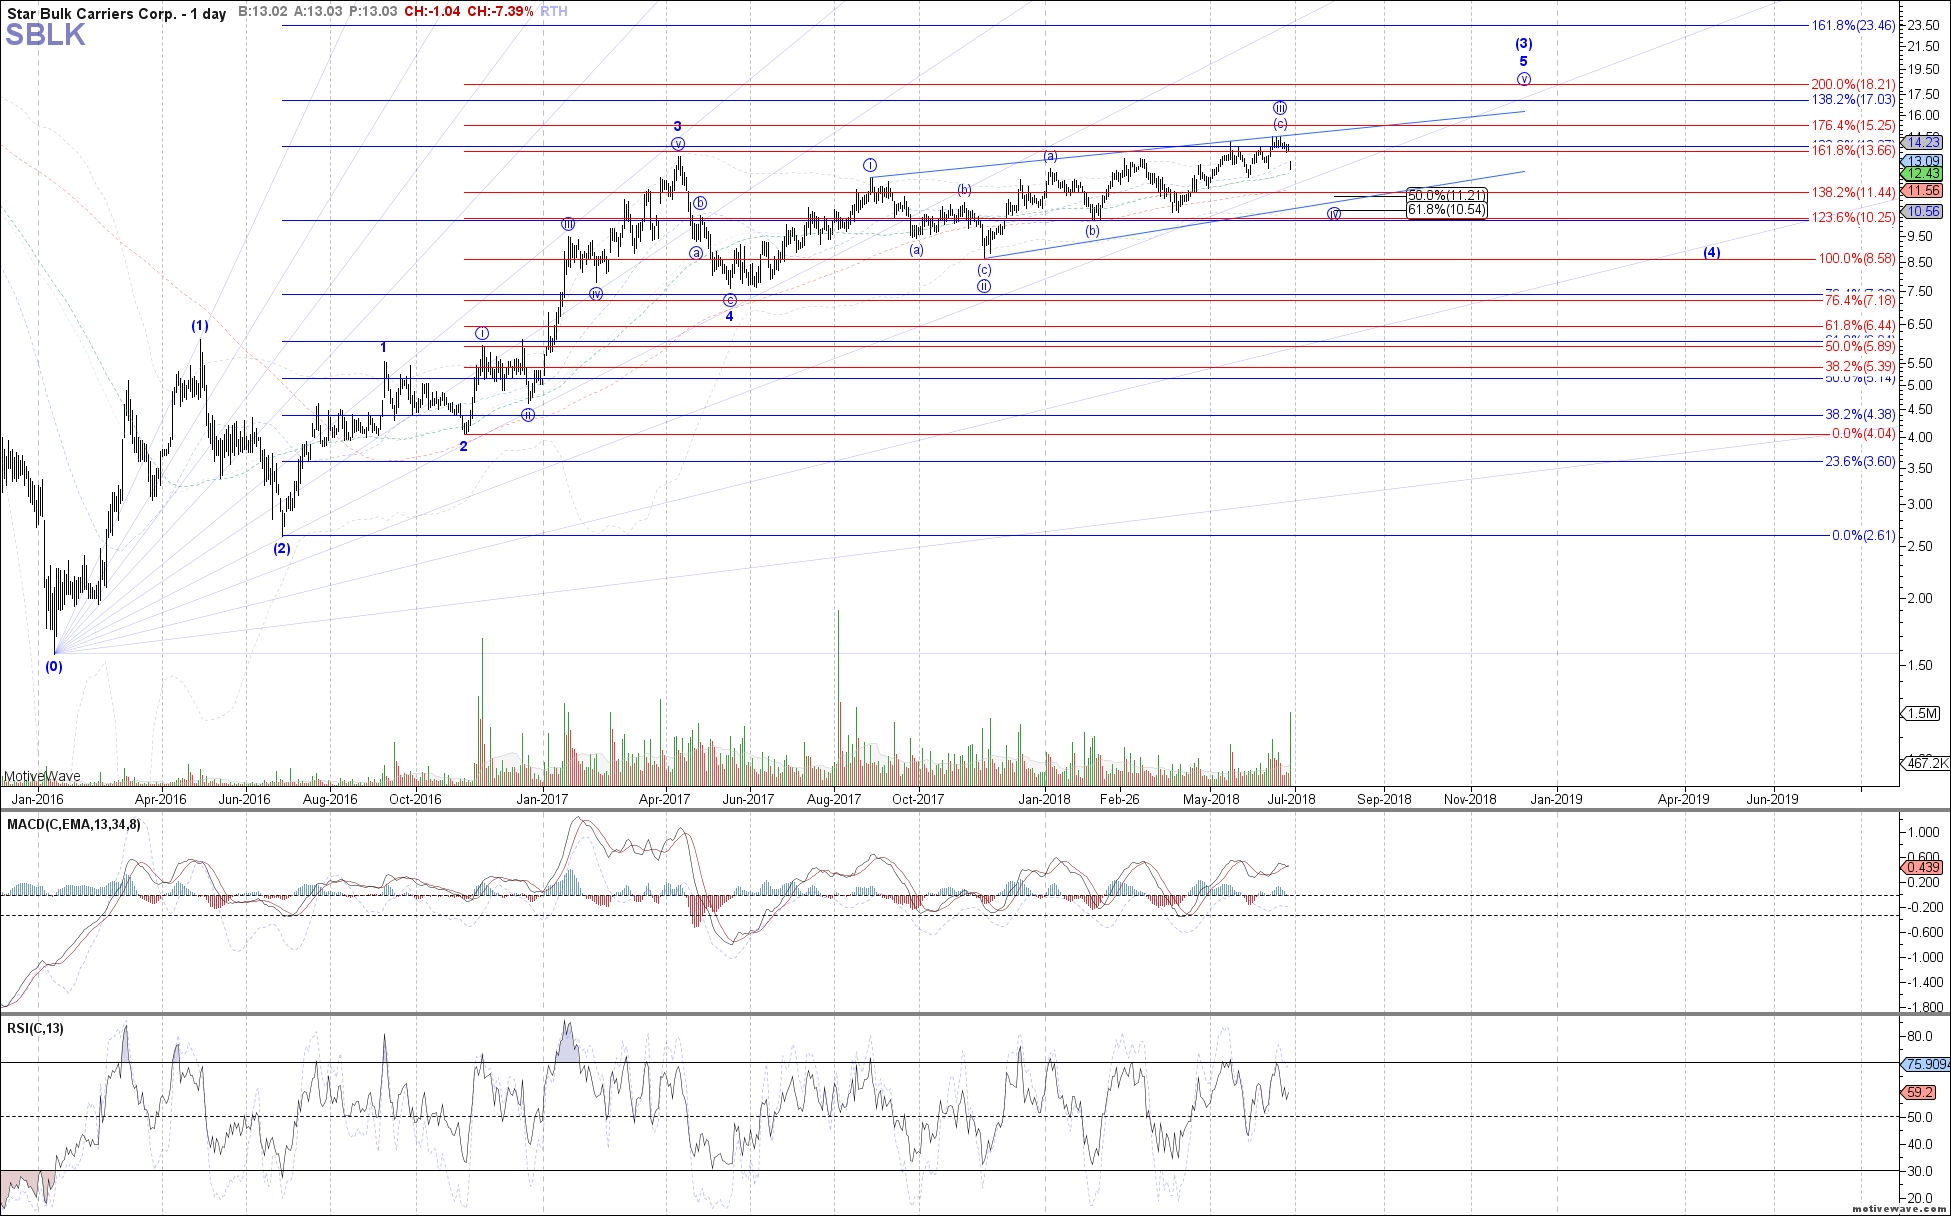
Star Bulk Carriers Corp. (SBLK) had a strong move to the downside Wednesday, falling $1.18 to $12.79 on 3.6 million shares, nearly 10x its average volume. With that drop, it is looking likely that price has completed its 3rd wave up (labeled "iii" on the chart), albeit a little bit shy of the ideal $15.60 target, and is now retracing in the 4th wave (labeled "iv").
A break below $12.19 would be the next step towards confirming that it's heading down in that wave iv, with the target in that downwave being $11.21 down to $10.54 support.
SPDR S&P Biotech ETF (XBI) also had a notable downmove on Wednesday, falling $3.11 to $93.62, that appears to have completed the wave up off the April low. The stock now appears to be in the next wave (labeled "b" on the chart) down in its larger rising pattern. XBI has reached the minimum expected .382 retrace in this wave at $93.74 with room down to the .618 retracement level at $89.22.
Price would have to get above the high from Wednesday morning at $97.10 to start suggestng a low already in place.
Next up, iShares MSCI Emerging Markets ETF (EEM) continues to stretch to the downside, and is now approachng the next Fibonacci retracement level at $41.53. With the way the pullback is beginning to fill out, the count seems to fit a little bit better as a 4th wave down on the chart. There no indication yet this down-wave has completed, and could continue lower to test the .618 retracement at $41.50 next before turning up in a 5th wave, which is expected to surpass the high from January.
The final chart we're reviewing today, McDonald's Corporation (MCD), has continued down and broken below the prior lows from May and the beginning of June. The pattern appears to be a 3-wave move to the upside from the lows back in March. Price is approaching the .618 retrace at $154.50 that ideally will hold as wave (c) of ii on the chart and turn back up in wave iii towards $183 next.