Buying The Dips - Market Analysis for Sep 15th, 2019
 By
By
In last weekend’s update we noted that "bulls have the upper hand right now." We wrote: "All our models are also positive this week ... Options data is also bullish long term, but short term is suggesting a possible small pullback which is why we are out and looking for re-entry at better prices. As long as price holds the 2947-40 support zone on pullbacks, the trend is up at the moment and pullbacks should be bought. Below 2940, situation becomes very iffy again and bears will take back full control below the 2890-2900 zone. Until this happens though, bulls have control."
What actually happened: As expected, there was a small pullback to start the week. The market held support into Tuesday above 2950 and then ramped higher to end the week very near the highs at 3010 on the Emini S&P 500 (ES).
What next? We used the pullback in the beginning of the week to re-establish long positions as planned and booked all of them for good profits toward the end of the week. Right now, we are flat and looking for a re-entry to the long side again.
Once again, all models are on buys again on review this weekend. The only model suggesting some short-term weakness on the horizon is the razzmatazz wave. A pullback is being forecasted by it into the beginning of October from here or from one more high. But with other models remaining on buys, this is likely to be just another pullback which can be bought. As always, we will continue to use our models and the razz waves to guide our trade entries. Right now, the razzmatazz wave is suggesting a dip into mid-week which can be bought OR a dip into the fourth week which can be bought for an end of month pop. We will have to see how market reacts in real time to make a judgement on a trade entry. Since all our core indicators remain on buys, let us continue to expect the path of least resistance to be upward and this dip we are seeing is likely just another pause to refresh.
ES Grey Zone areas: The grey zones on the ES 5 min chart below are what I draw in on a discretionary basis - they are supports and resistance areas which the market is most likely to react from. If we test a zone from below, it is likely to be rejected and fall lower to test support zones below. If we test a zone from above, it is likely to take support there and begin a move higher. So these zones can be used for intraday trading and/or as entry points for positioning for swing trades. These zones are drawn in based on what the market has done there previously both on smaller and larger timeframes.
Grey zone support now at 2992-84 and then 2964-2957. Resistance zones at 3001-07 and then higher we have 3021-3028.
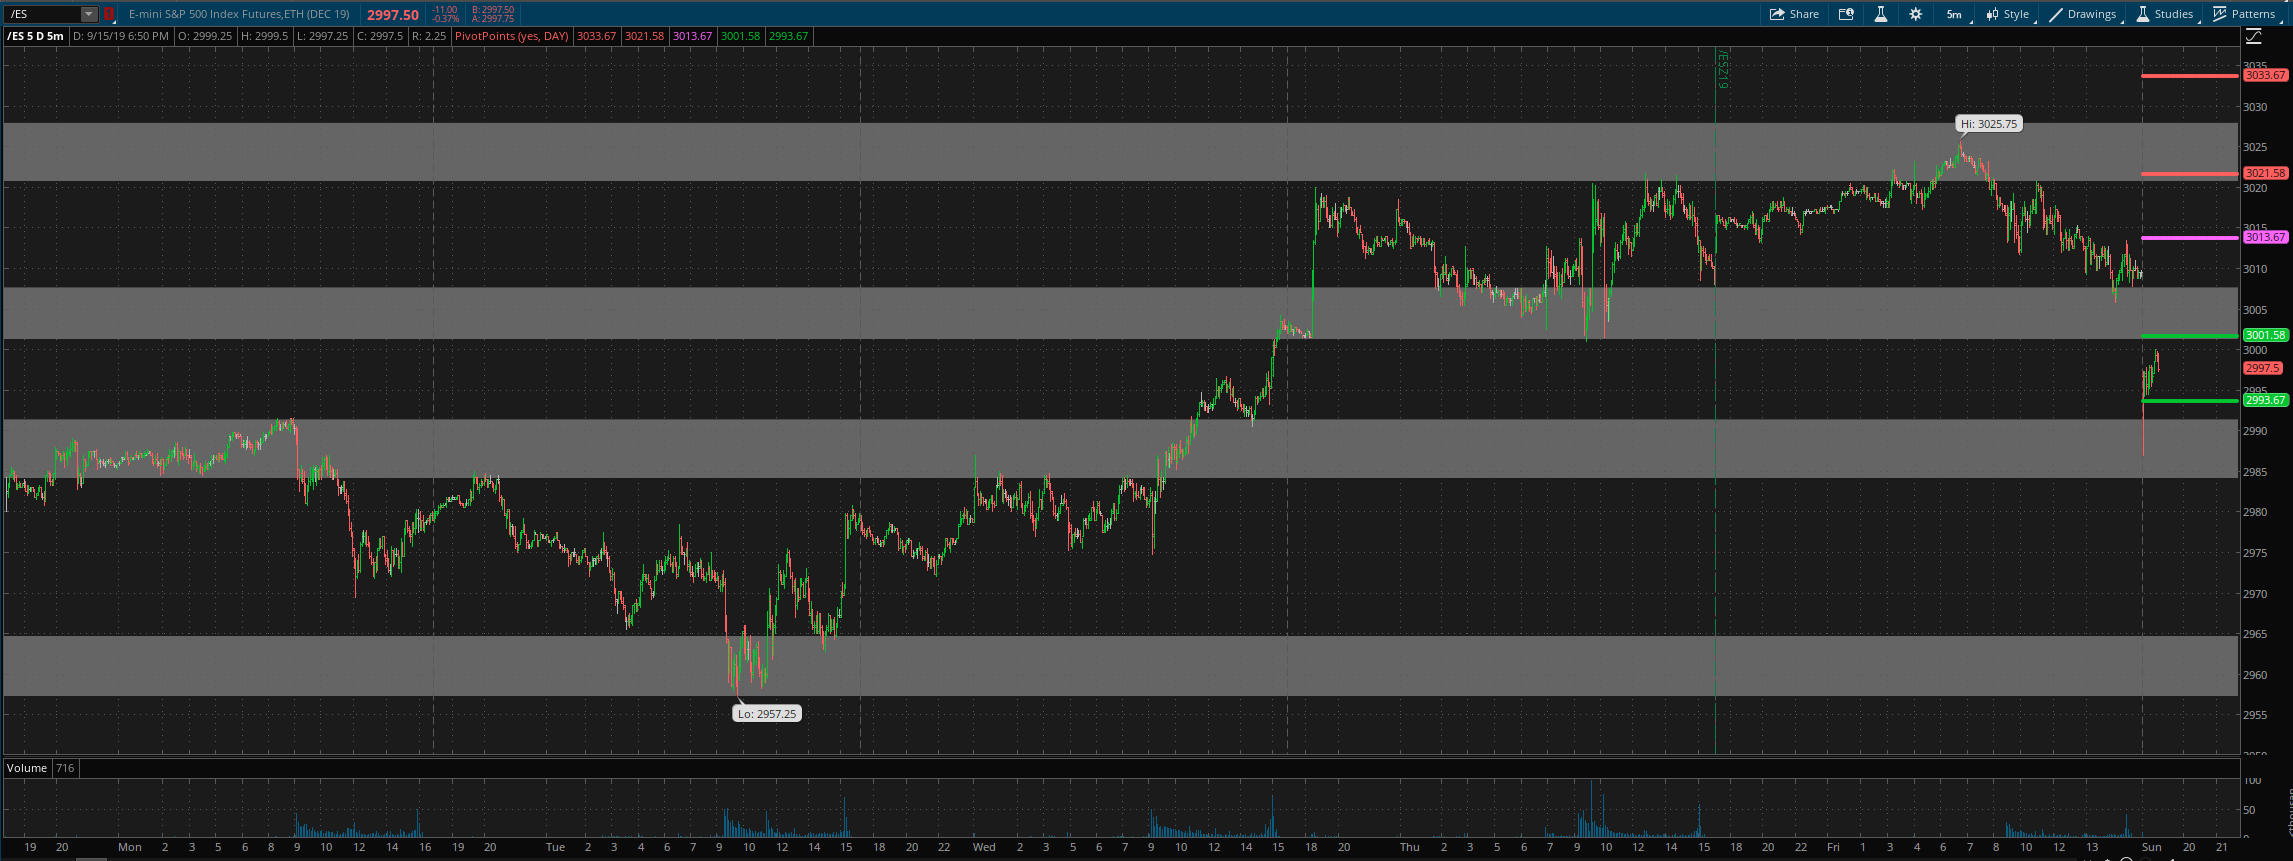
Daily pivot is at 3013.5. Resistance R1 is at 3021.5 and R2 at 3034. Support S1 is at 3001.5 and S2 at 2994.
All the best to your trading week ahead.
