Buy Signals Still Intact Though Not Very Strong
 By
By
In last weekend’s update I noted, "Most of our models are back on the bullish side this weekend. But bulls are hardly out of the woods right now and they need immediate follow through in the coming week. 2955/50 is support and below this 2930/25 is must hold support for the bulls....I am inclined to give the bullish breakout scenario higher odds this weekend. Above 2990/95 would indicate a breakout to all-time highs and beyond."
What actually happened is that after a retest of the 2955/50 support on the Emini S&P 500 (ES) Monday early morning, we moved higher over the week to hit a high above 3000 but ended the week back at the 2990 area.
What next?
Most of our models continue to be on buy signals, although not a very strong posture from any of them. On price, 2955/50 is the most important support area to watch out for right now. Below this and the bears will take back control with confirmation below the 2940/35 area.
On the upside, bulls need above the 3000/3003 area for a move to test all time highs. The razzmatazz model does suggest some weakness in the coming week, so a little bit more of back and fill is possible over the next 2 days before we make another attempt to test the all time highs. We will continue to use the NYHL1M model and the micro signals to guide our trading.
ES Grey Zone areas: The grey zones on the ES 5 min chart below are what I draw in on a discretionary basis - they are supports and resistance areas which the market is most likely to react from. If we test a zone from below, it is likely to be rejected and fall lower to test support zones below. If we test a zone from above, it is likely to take support there and begin a move higher. So these zones can be used for intraday trading and/or as entry points for positioning for swing trades. These zones are drawn in based on what the market has done there previously both on smaller and larger timeframes.
Grey zone resistance at 3021-27 and we are within one zone now at 2994-85. Below this support is there at 2960-53, 2935-28 and then 2889-82.
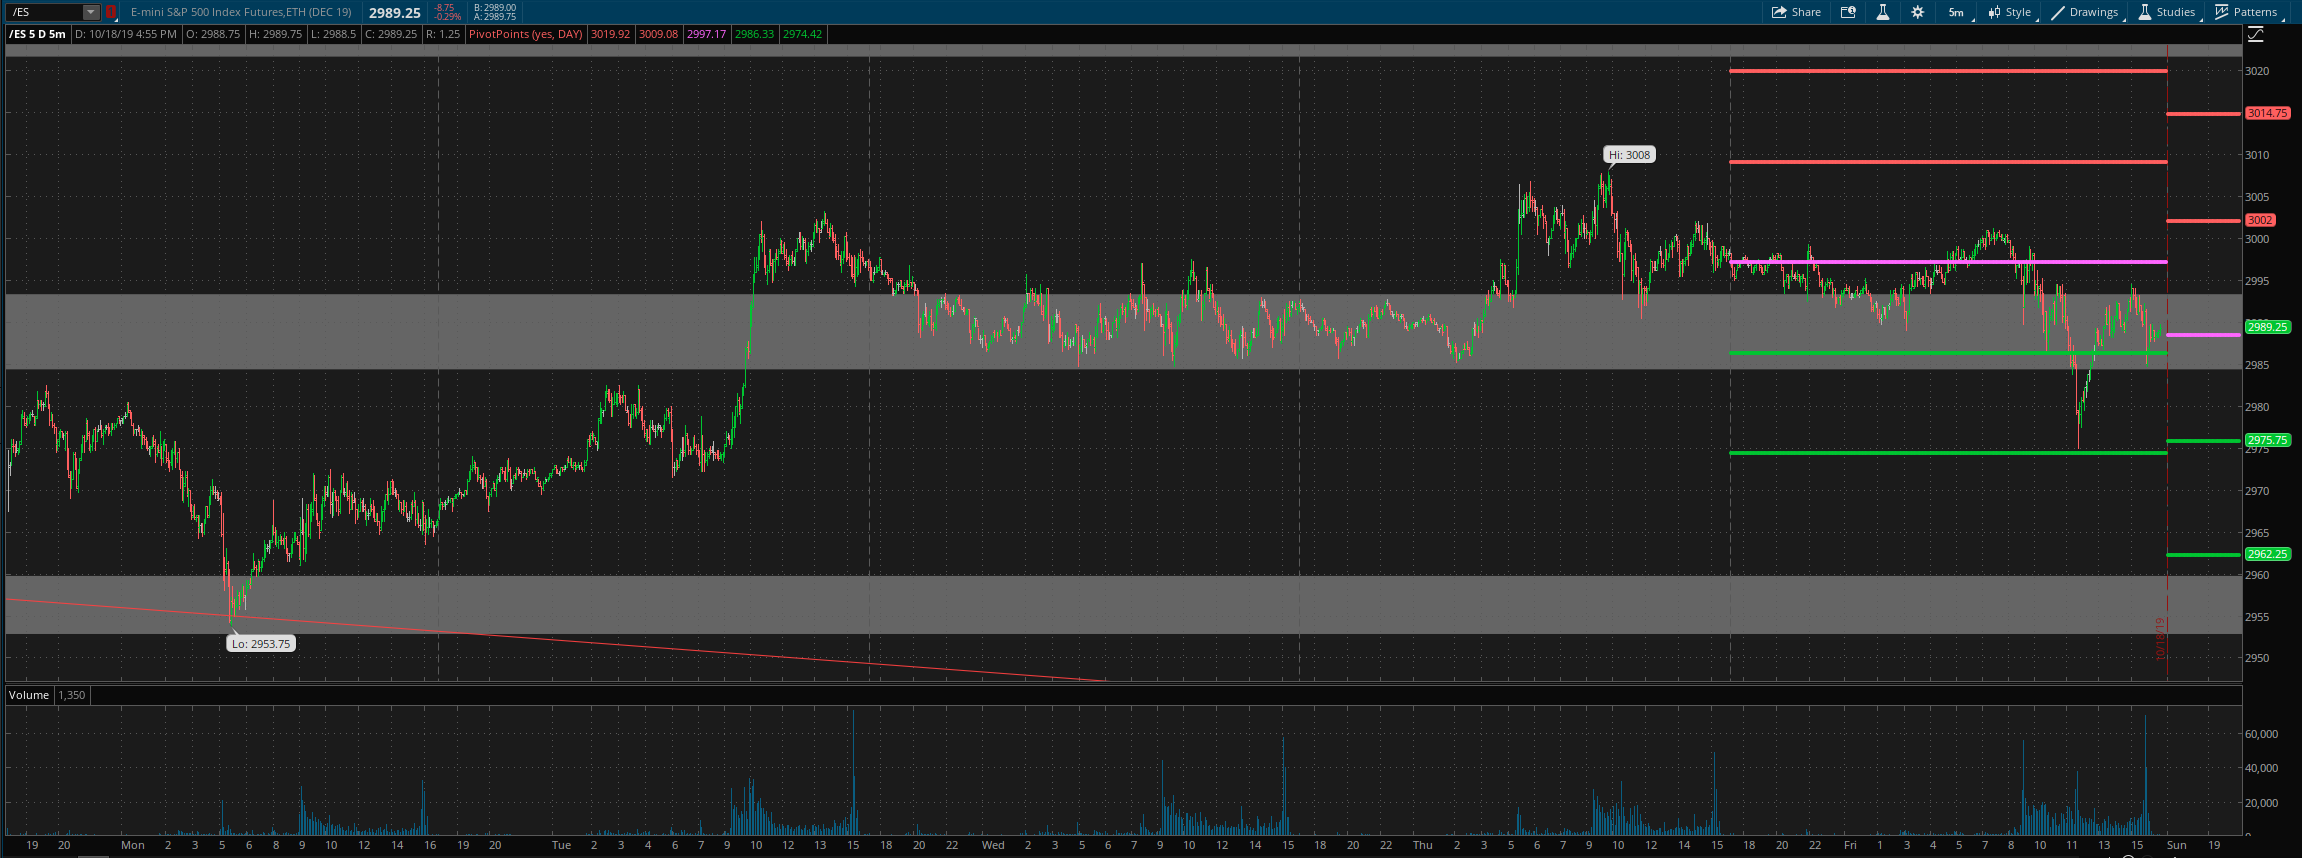
Daily pivot is at 2988.5. Resistance R1 is at 3002 and R2 at 3015. Support S1 is at 2976 and S2 at 2962.
All the best to your trading week ahead.
