Bull Market Continues to Surprise
 By
By
In last weekend’s update, we noted: We are beginning to see some mild signs of bearishness in the data but nothing that suggests shorting except for intraday pullbacks is a good idea yet. Some of our models are neutral and others are bullish. With this kind of posture in the indicators we track, let us continue to expect the market to grind higher - at least until the data suggests more bearish interpretation are mandated. As I noted last week, 3040-50 area is the next area of resistance on the upside and possibly where a bigger pullback can materialize but let us see how the data looks like when we get there.
What actually happened is we hit the highs of the week overnight Monday at 3023.5 on the Emini S&P 500 (ES) and then went sideways for a couple days before bearish action kicked in, taking us to the lows of the week on Friday.
What next? Price action during the week suggests that a top of some significance may have been hit very early last week. However this bull market has continued to surprise on the upside, so it's not very clear to me what next. 2955/50 area is support at the moment, which the bulls need to defend if they want to maintain the uptrend in the intermediate term. Lose this and I think we have a more sustained downtrend in the making.
But as I noted above, this week is a tough call right now and we need to see more price action before making a call on what next. Regardless, we will continue to use our indicators to position ourselves along with the dominant trend in the market.
We had another great week of trading in the Smart Money room. Four trades were closed during the week, the results of which are shown below.

ES Grey Zone areas: The grey zones on the ES 5 min chart below are what I draw in on a discretionary basis. They are support and resistance areas which the market is most likely to react from. If we test a zone from below, it is likely to be rejected and fall lower to test support zones below. If we test a zone from above, it is likely to take support there and begin a move higher. So these zones can be used for intraday trading and/or as entry points for positioning for swing trades. These zones are drawn in based on what the market has done there previously both on smaller and larger timeframes.
Grey zone support now at 2963-55, then 2936-30. Resistance zone at 2971-75 and then 2988-93 followed by 3003-3008.
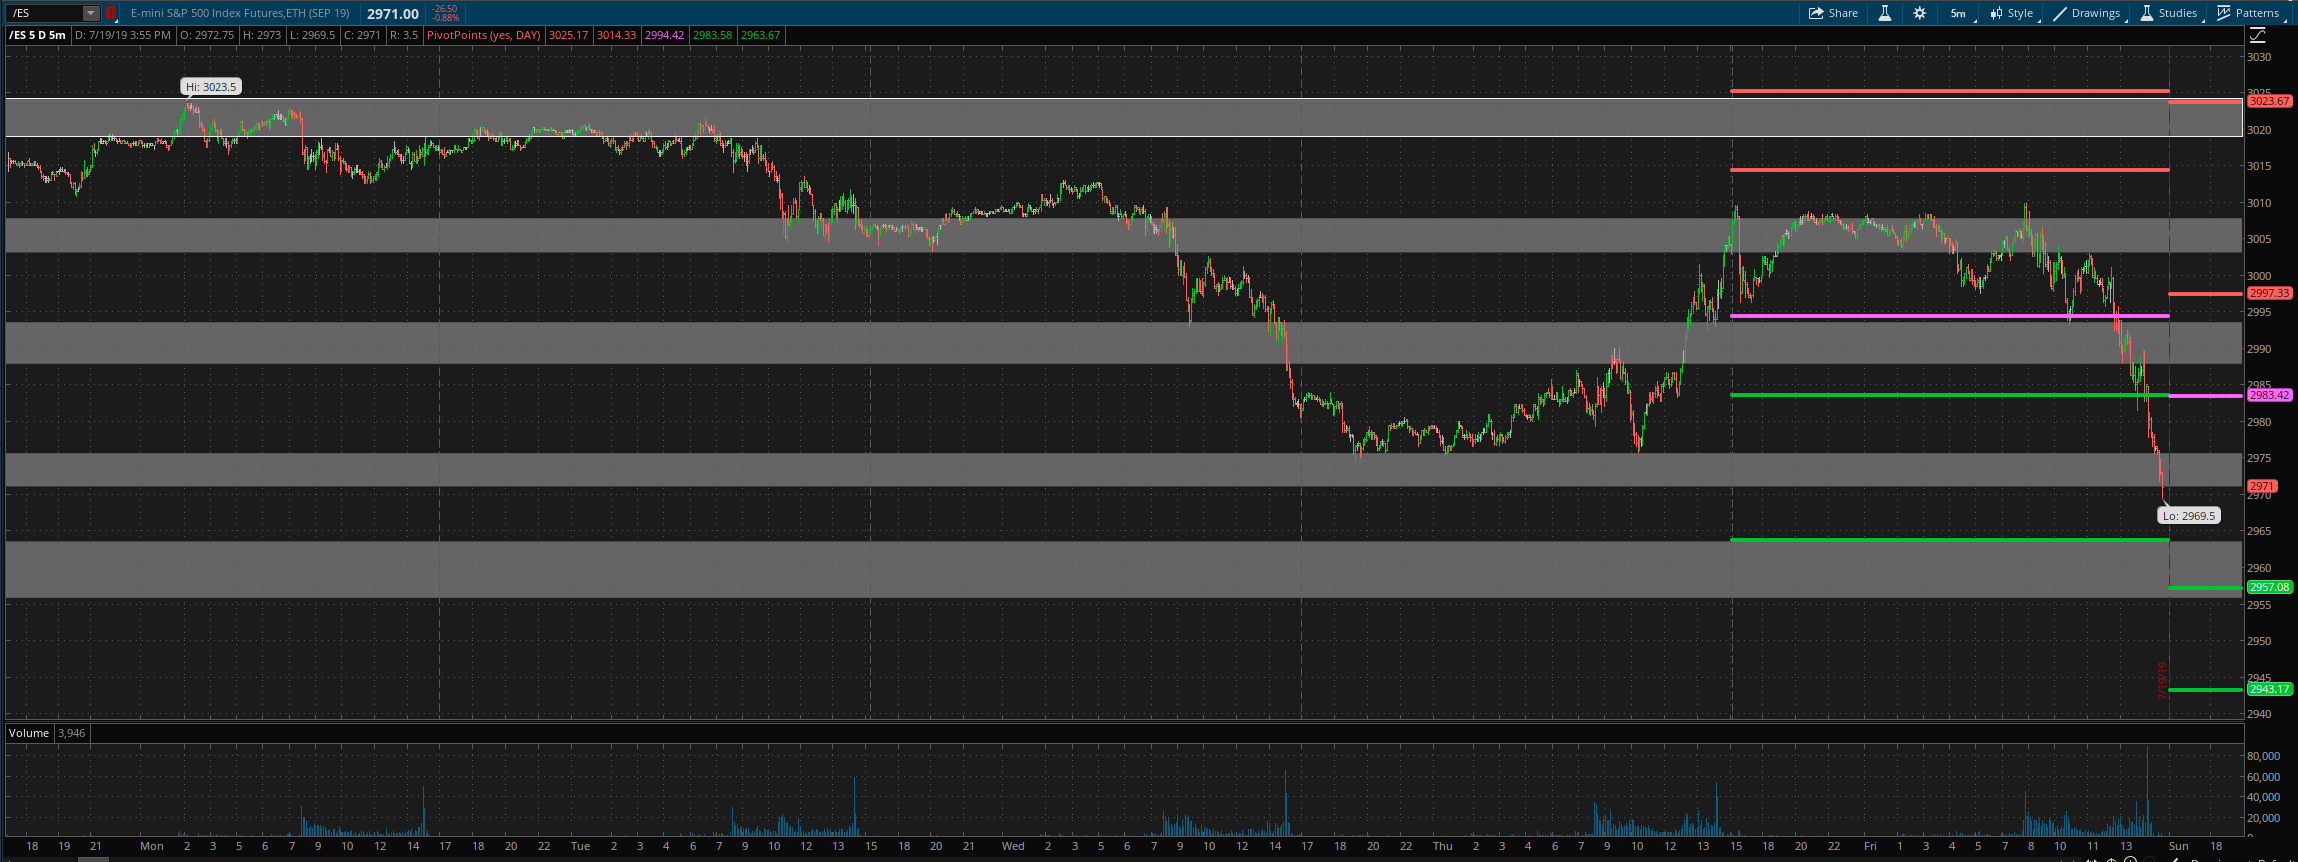
For Monday daily pivot is at 2983. Resistance R1 is at 2997 and R2 at 3024. Support S1 is at 2957 and S2 at 2943.
All the best to your trading week ahead.
