Bitcoin: Where On The Map?
 By
Jason Appel
By
Jason Appel
Bitcoin: Where on the map?
Considering we are at almost the exact same price as last week's update it's safe to say that price has not "traveled" very far along the roadmap. As such, I'm going to keep this week's article quite brief to describe how the past week's micro action fits into the roadmap.
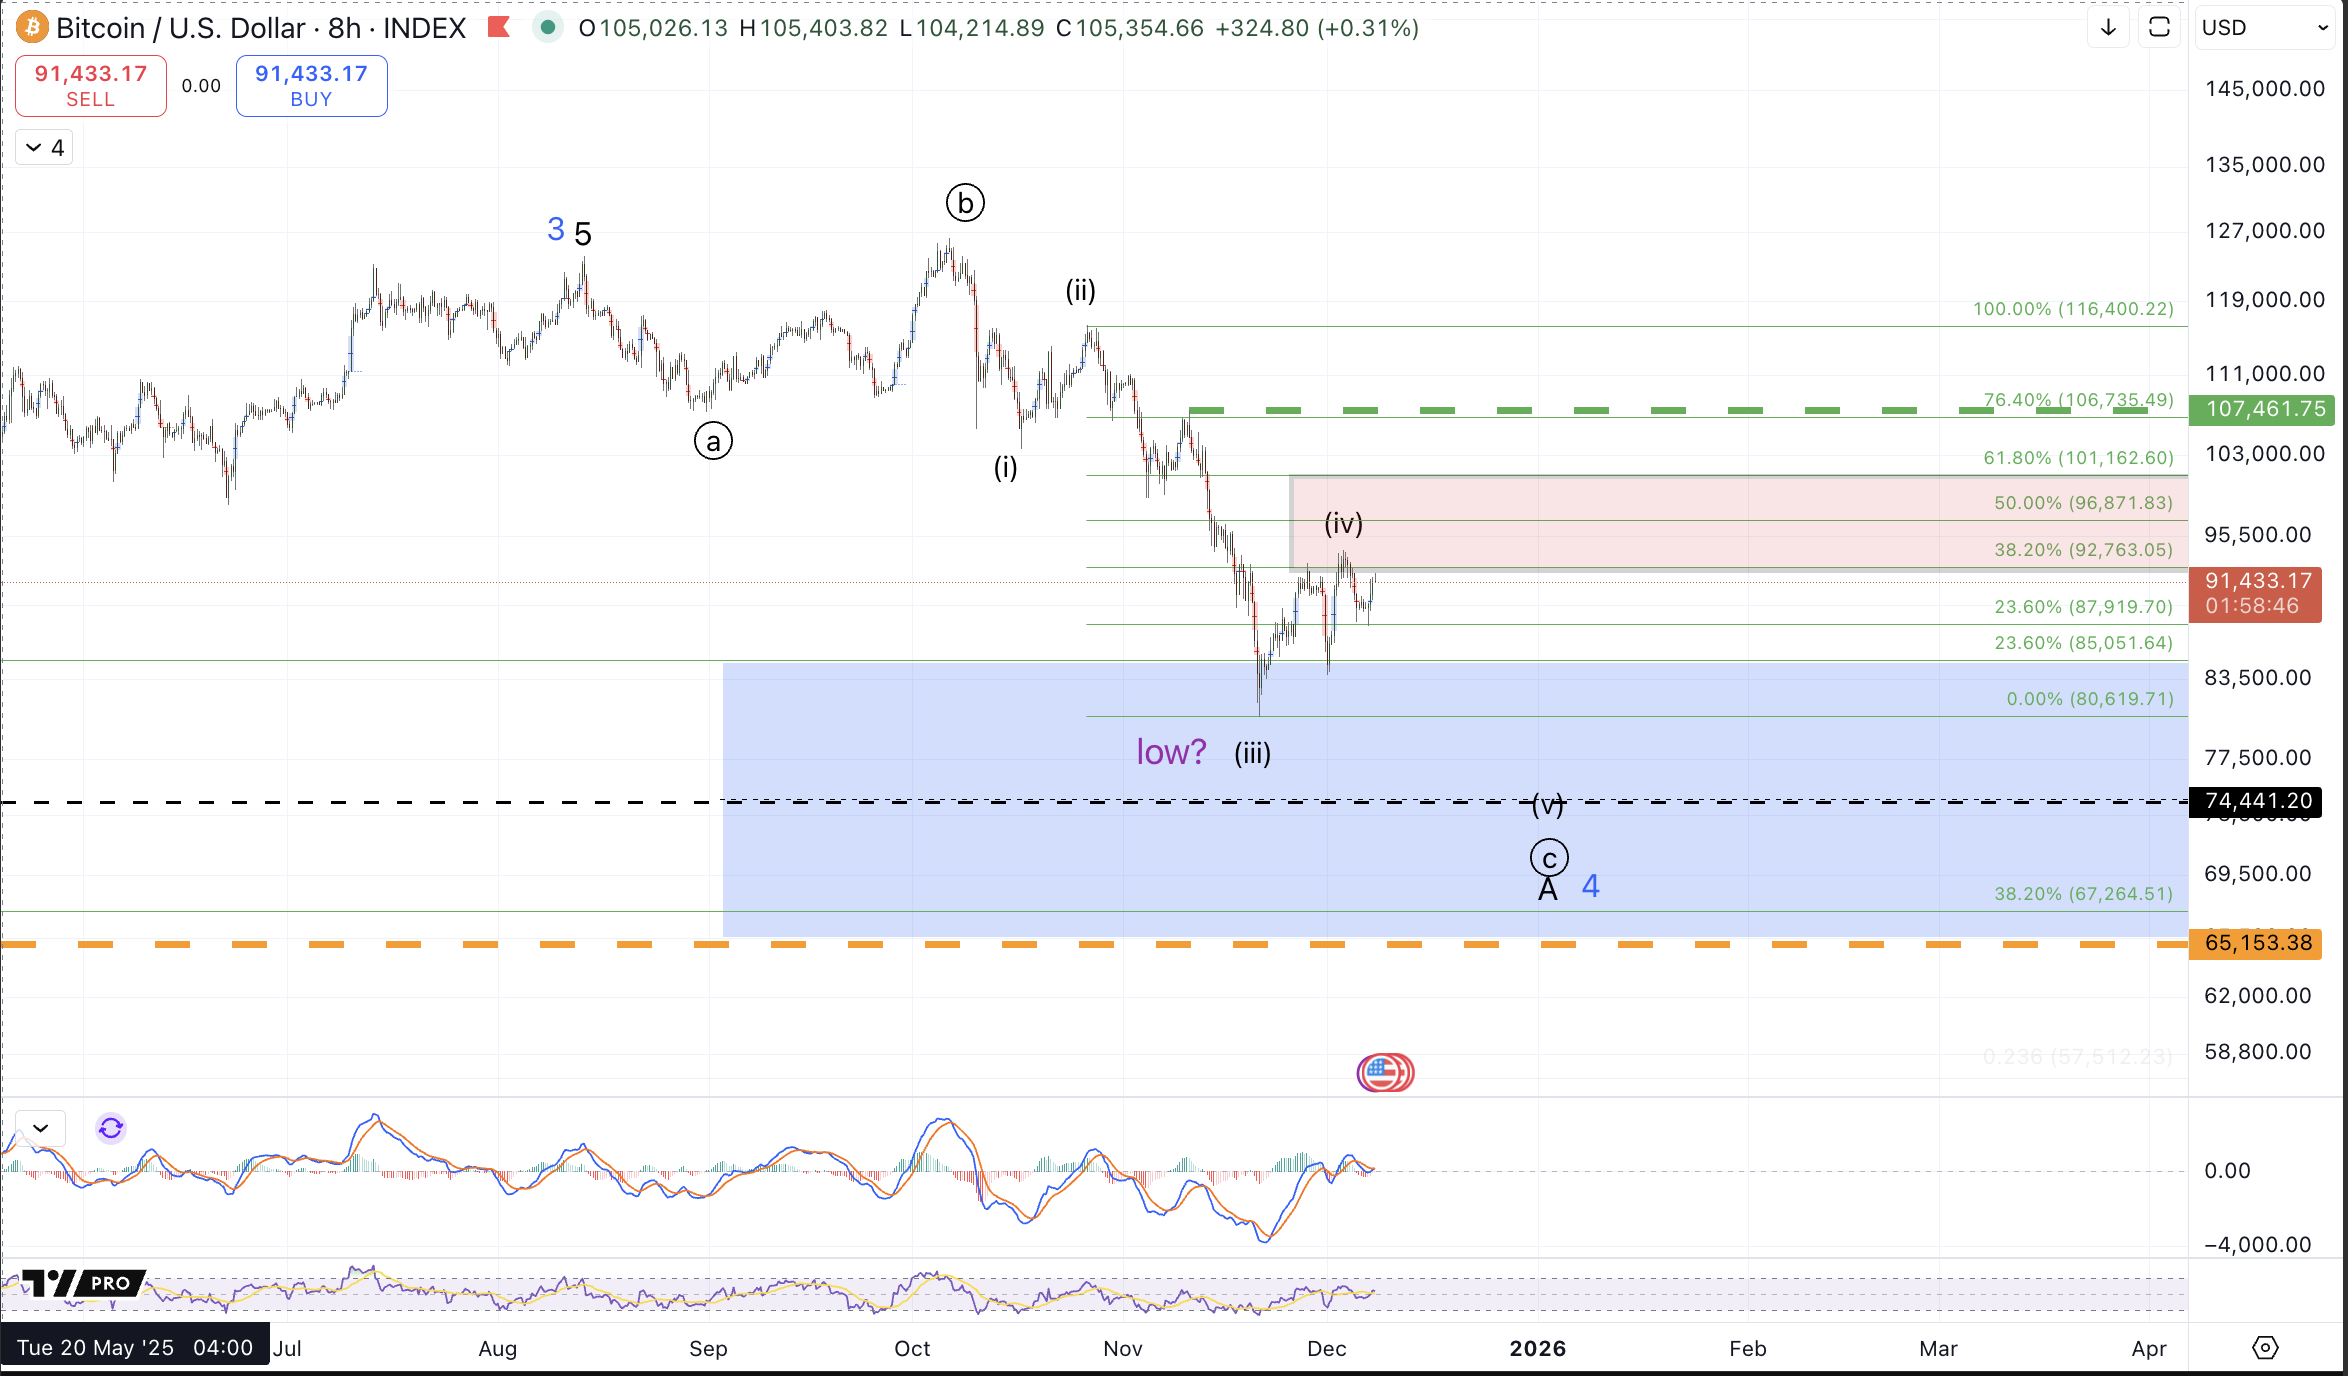
Upon writing last week's article, price had established a bottom of sorts at the November 21st low around $80.6k. The bounce up to $91.7k last weekend was sufficient for all of a wave (iv) into standard resistance which portends a wave (v) down to come.
From Last week:
As for the micro structure: While price has broken initial upside resistance to at least provide a good signal of a wave (iii) in place, the structure down from the October high appears rather odd for completion, even considering Bitcoin's penchant for exotic corrective structures. As such, I'd really prefer one more low, which should minimally target $78.4k, but more ideal would entail a hit of the $70k-$75k region to complete 5 down from the all-time high either as a circle c of A or blue wave 4. Micro resistance for the lower low is $91.2k-$100.2k. So long as this region is containing upside advances, a lower low is still preferred. However, should a sustained break above $100.2k develop, I'm neutral on the prospects of immediately lower lows unless $107.5k, the 11/10 high is breached. Should price make a sustained break above $107.5k, I must consider a low of sorts in place but this will be treated as a bear market rally, ie, a B wave unless we see a clear impulsive structure develop off the 11/21 low.
While all the above is still quite applicable, the past week has filled in a more complex structure up from the 11/21 low. Without the larger context, I could consider a lot of different reasonable outcomes but we must always strive to narrow the field to a smaller set of possibilities to define market potentials while being prepared in our trading for anything.
To keep things simple, I'm going to treat the high of wave (iv) in place as my primary perspective. As such, this is valid unless the 12/3 high breaks, ie, price moves through $94.2k~ Considering a wave (iv) high in place entails new lows to come in more imminent fashion and as described last week, the minimal target for a new low will be $78.4k with more ideal targets in the $70k-$75k region, and I'll note explicitly, an outside possibility of a capitulatory reaction through $70k by a few thousand dollars per Bitcoin. In order for this more immediate downside to remain favored, price should remain below $92.7k and start heading lower pretty quickly this week.
If price moves back through the 12/3 high, a lot of different prospects open up, ranging from (next) most immediately bearish (in relation to the current primary) to most bullish
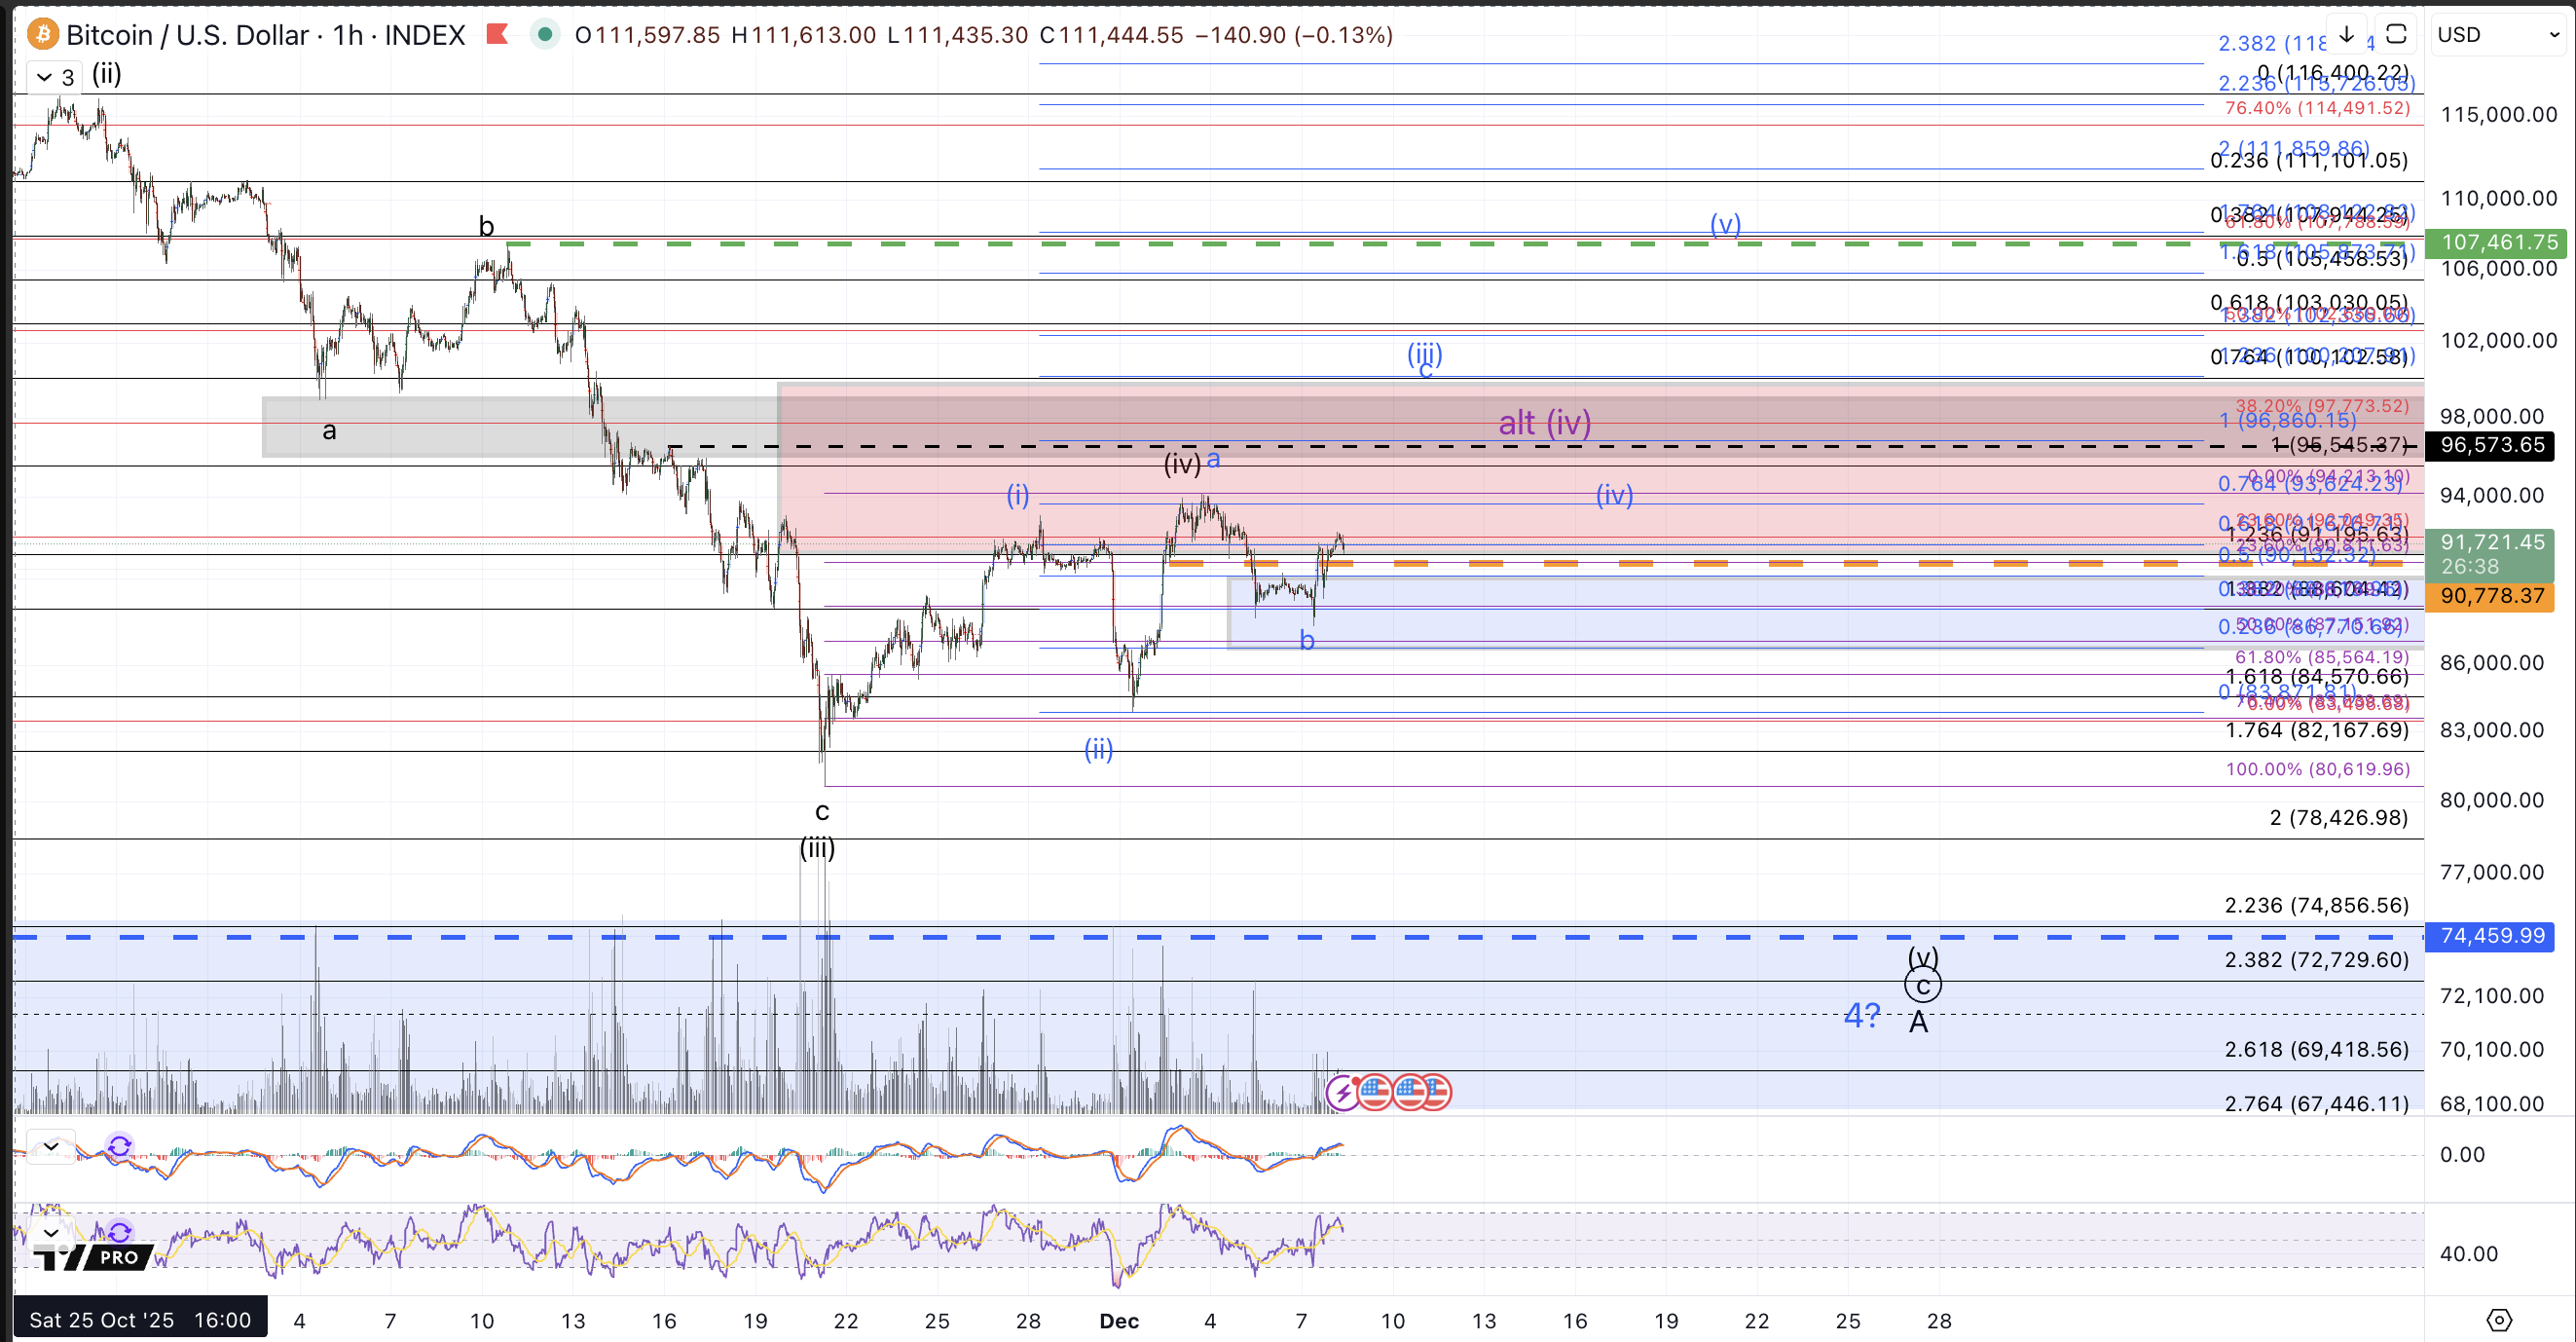
As shown in purple, a wider wave (iv) is a reasonable possibility but would likely need to fill in as a complex w-x-y structure to remain within resistance parameters for this wave degree.
Next, should price start breaking through resistance, as stated last week, rallies will still be treated as corrective bounces until proven otherwise. So, though not shown explicitly labeled, should price move back above $100k, we may consider all of A in place (within the larger degree black count) or perhaps even a circle a-b developing for a bigger A. Should price move back above $107.5k, while still maintaining a corrective structure, this unlabeled potential becomes the primary and price can reasonably extend up to $111k within this corrective bounce thesis.
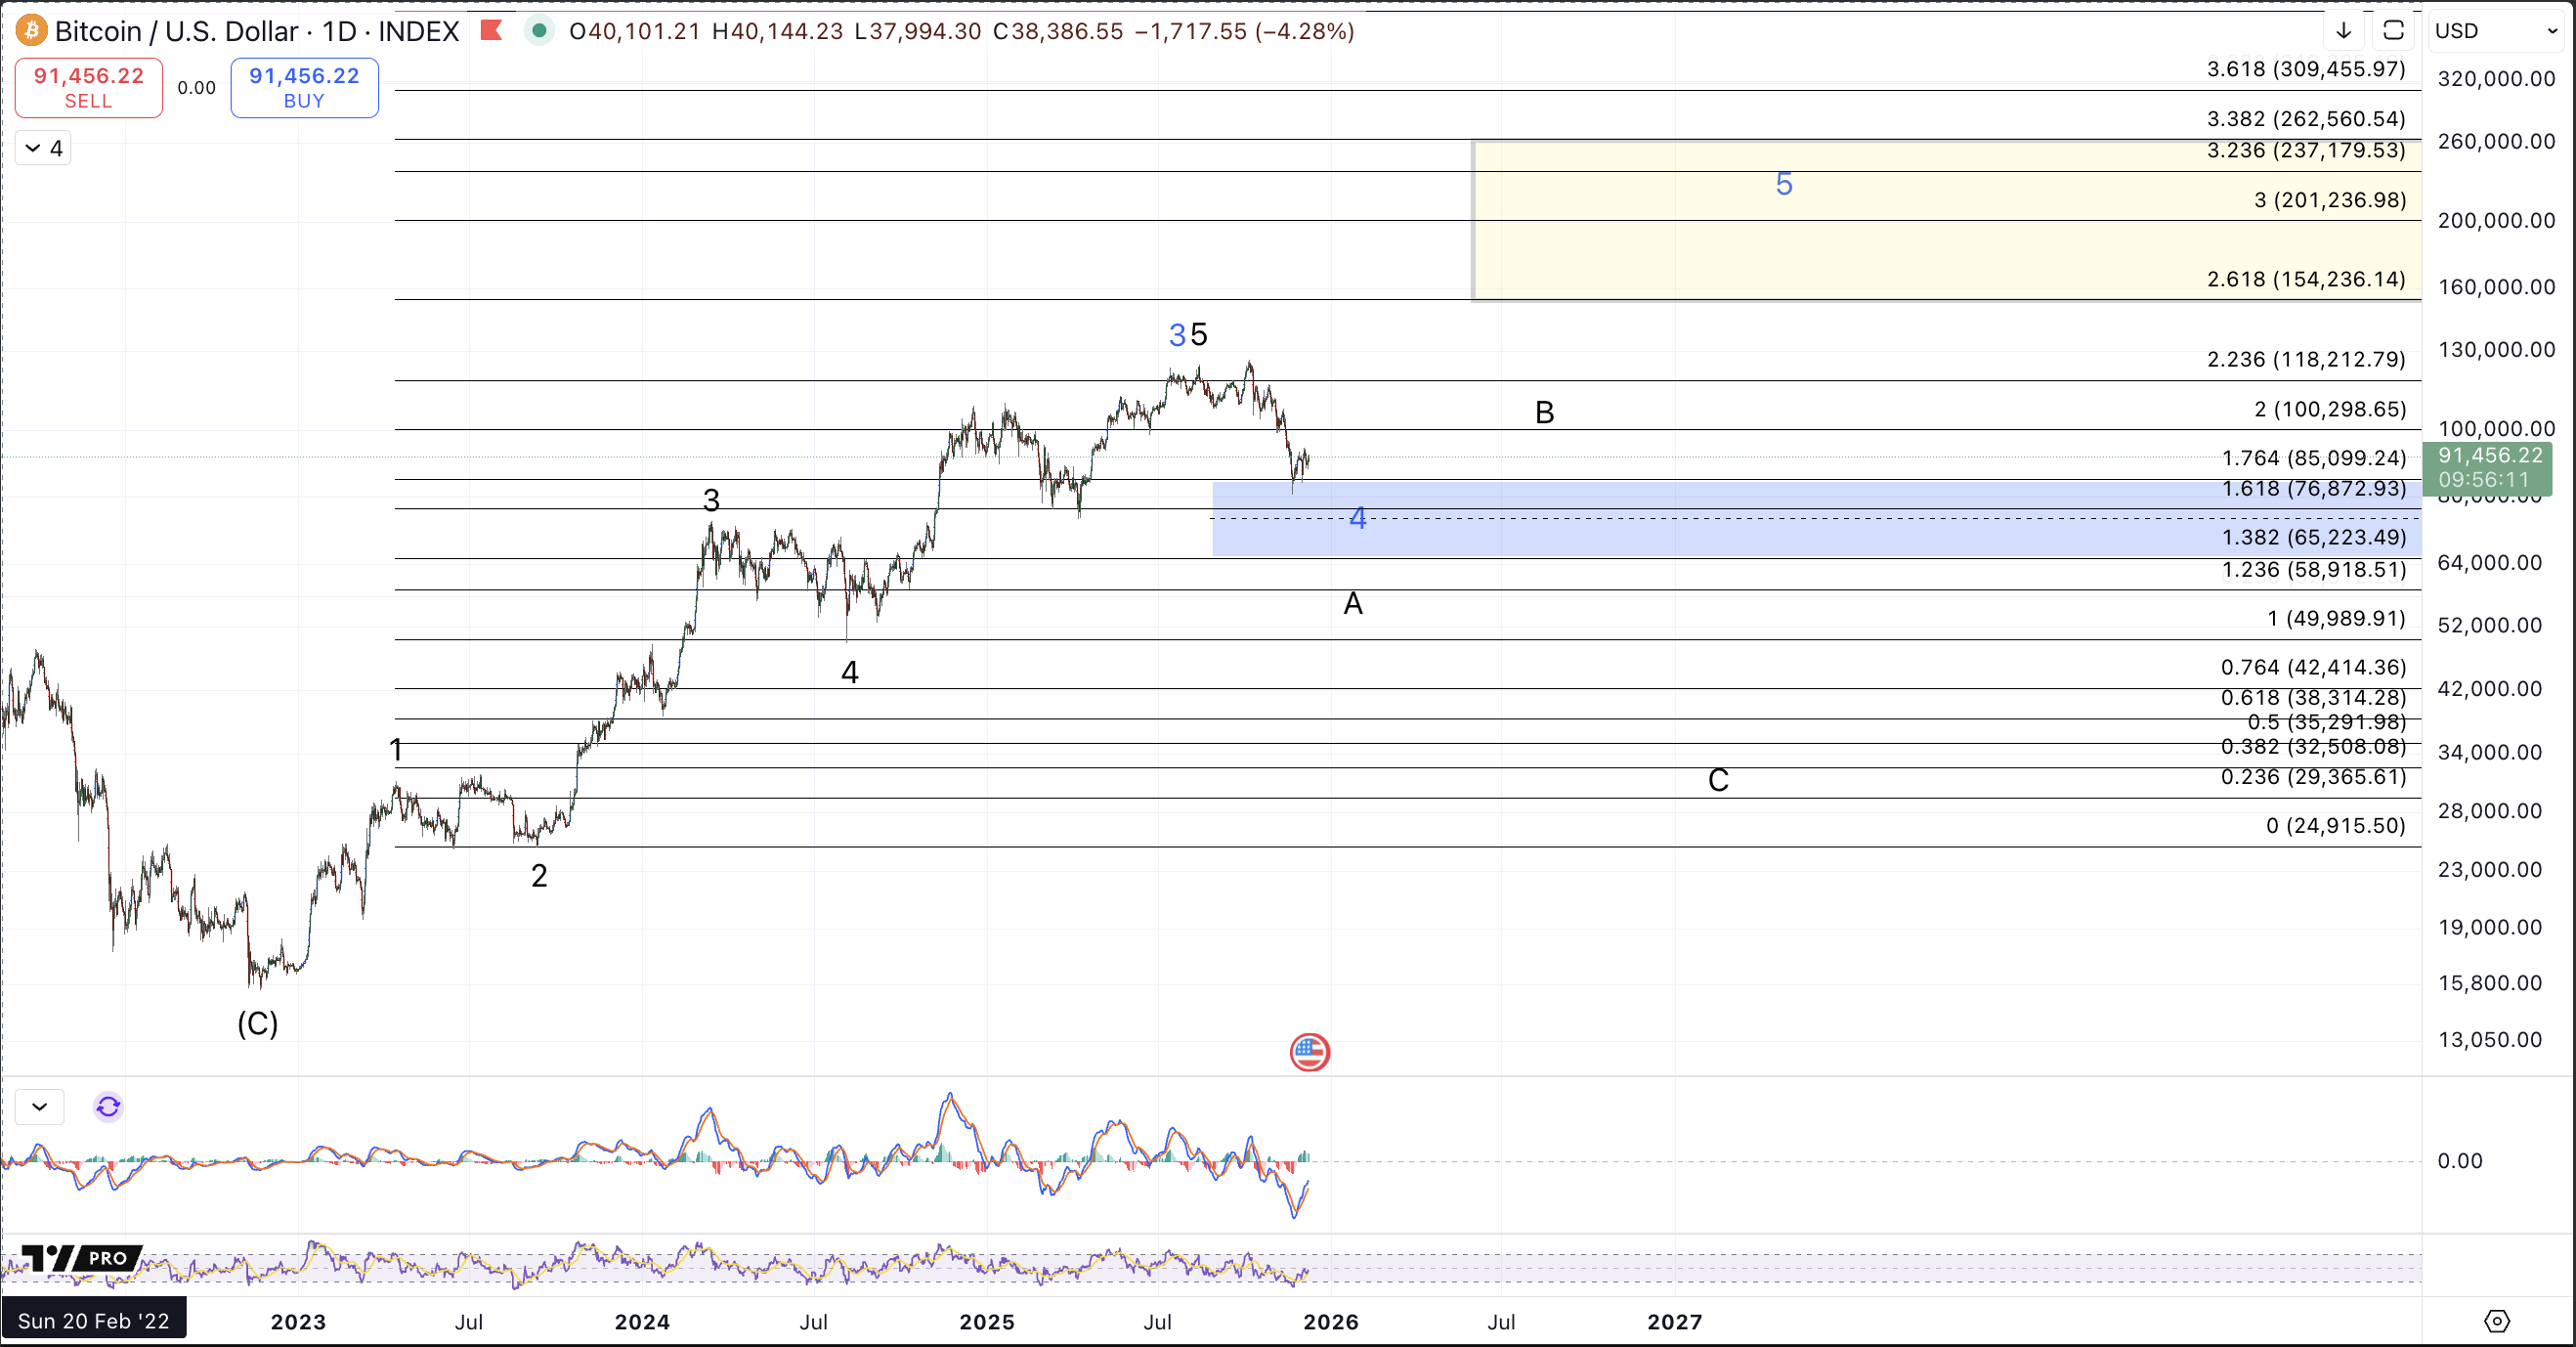
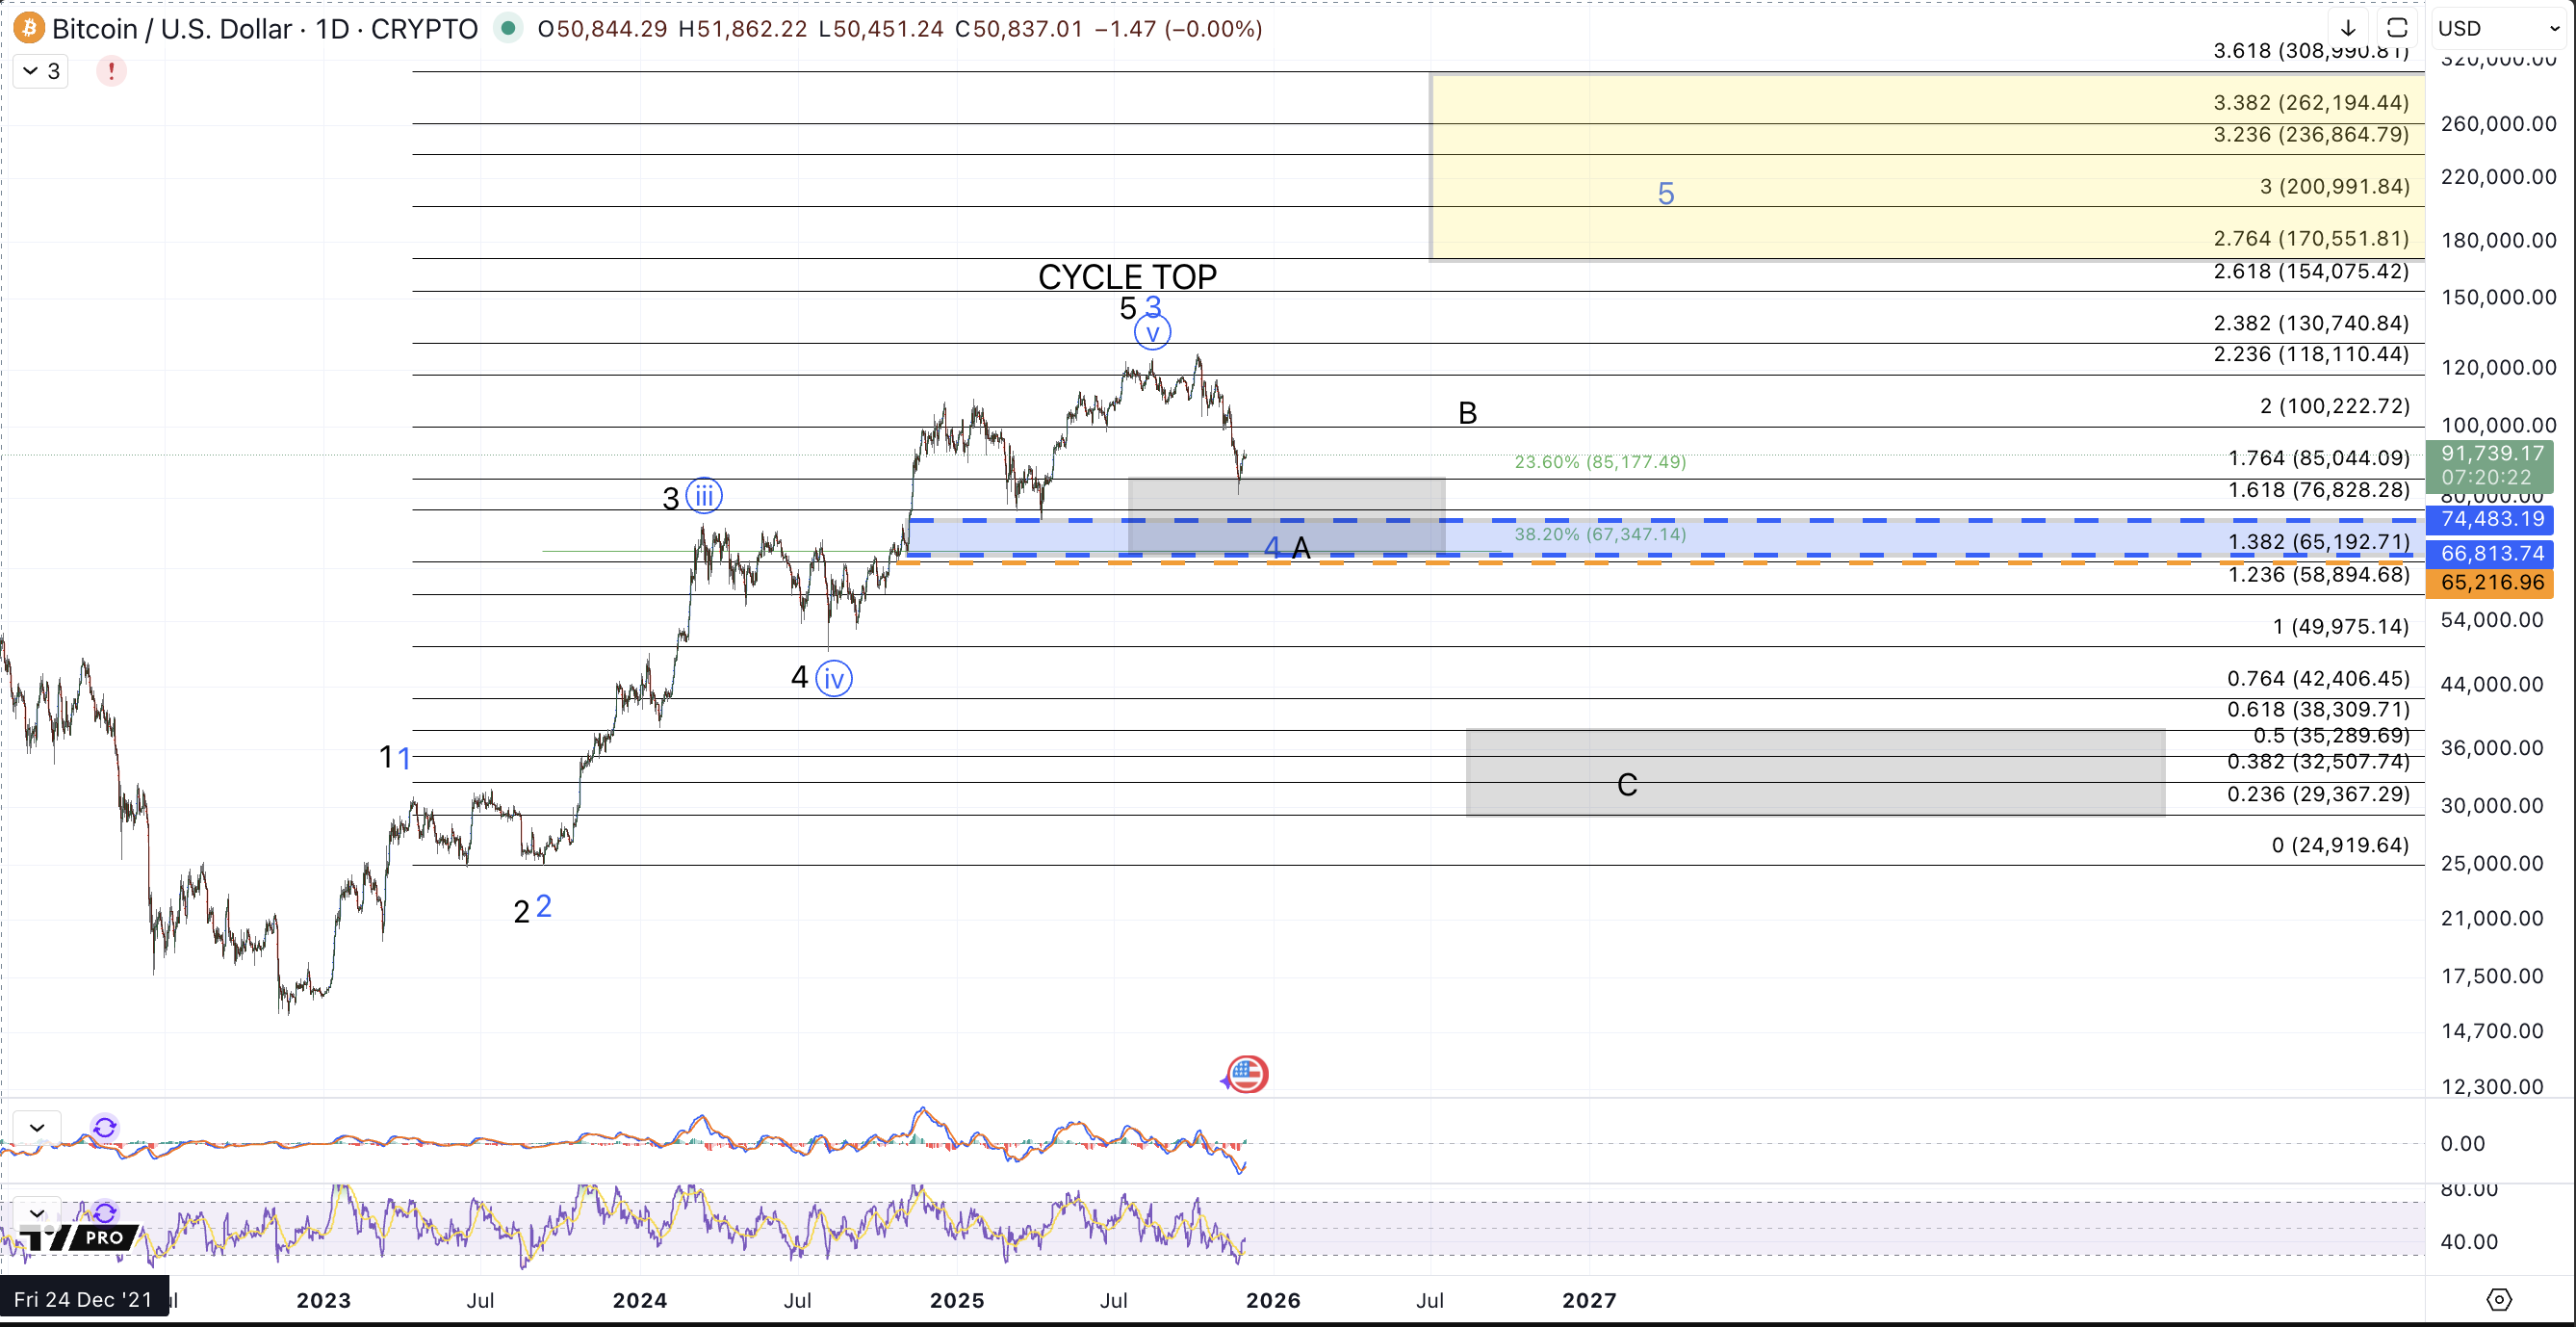
Lastly, while it's possible that all of the larger Minor wave 4 in blue has bottomed, this count will need to prove itself with a 5 wave move through $107.5k. Should such a move develop, roughly as shown on the BTCUSD 1h chart, I'll shift my perspective back into a bullish bias with a significant bottom in place at the 11/21 low
