Bitcoin: Waiting - Market Analysis for Aug 31st, 2025
 By
Jason Appel
By
Jason Appel
Bitcoin: Waiting
In the last two weeks I've introduced the prospect of a top in place but as asked in last week's title, a top to what?
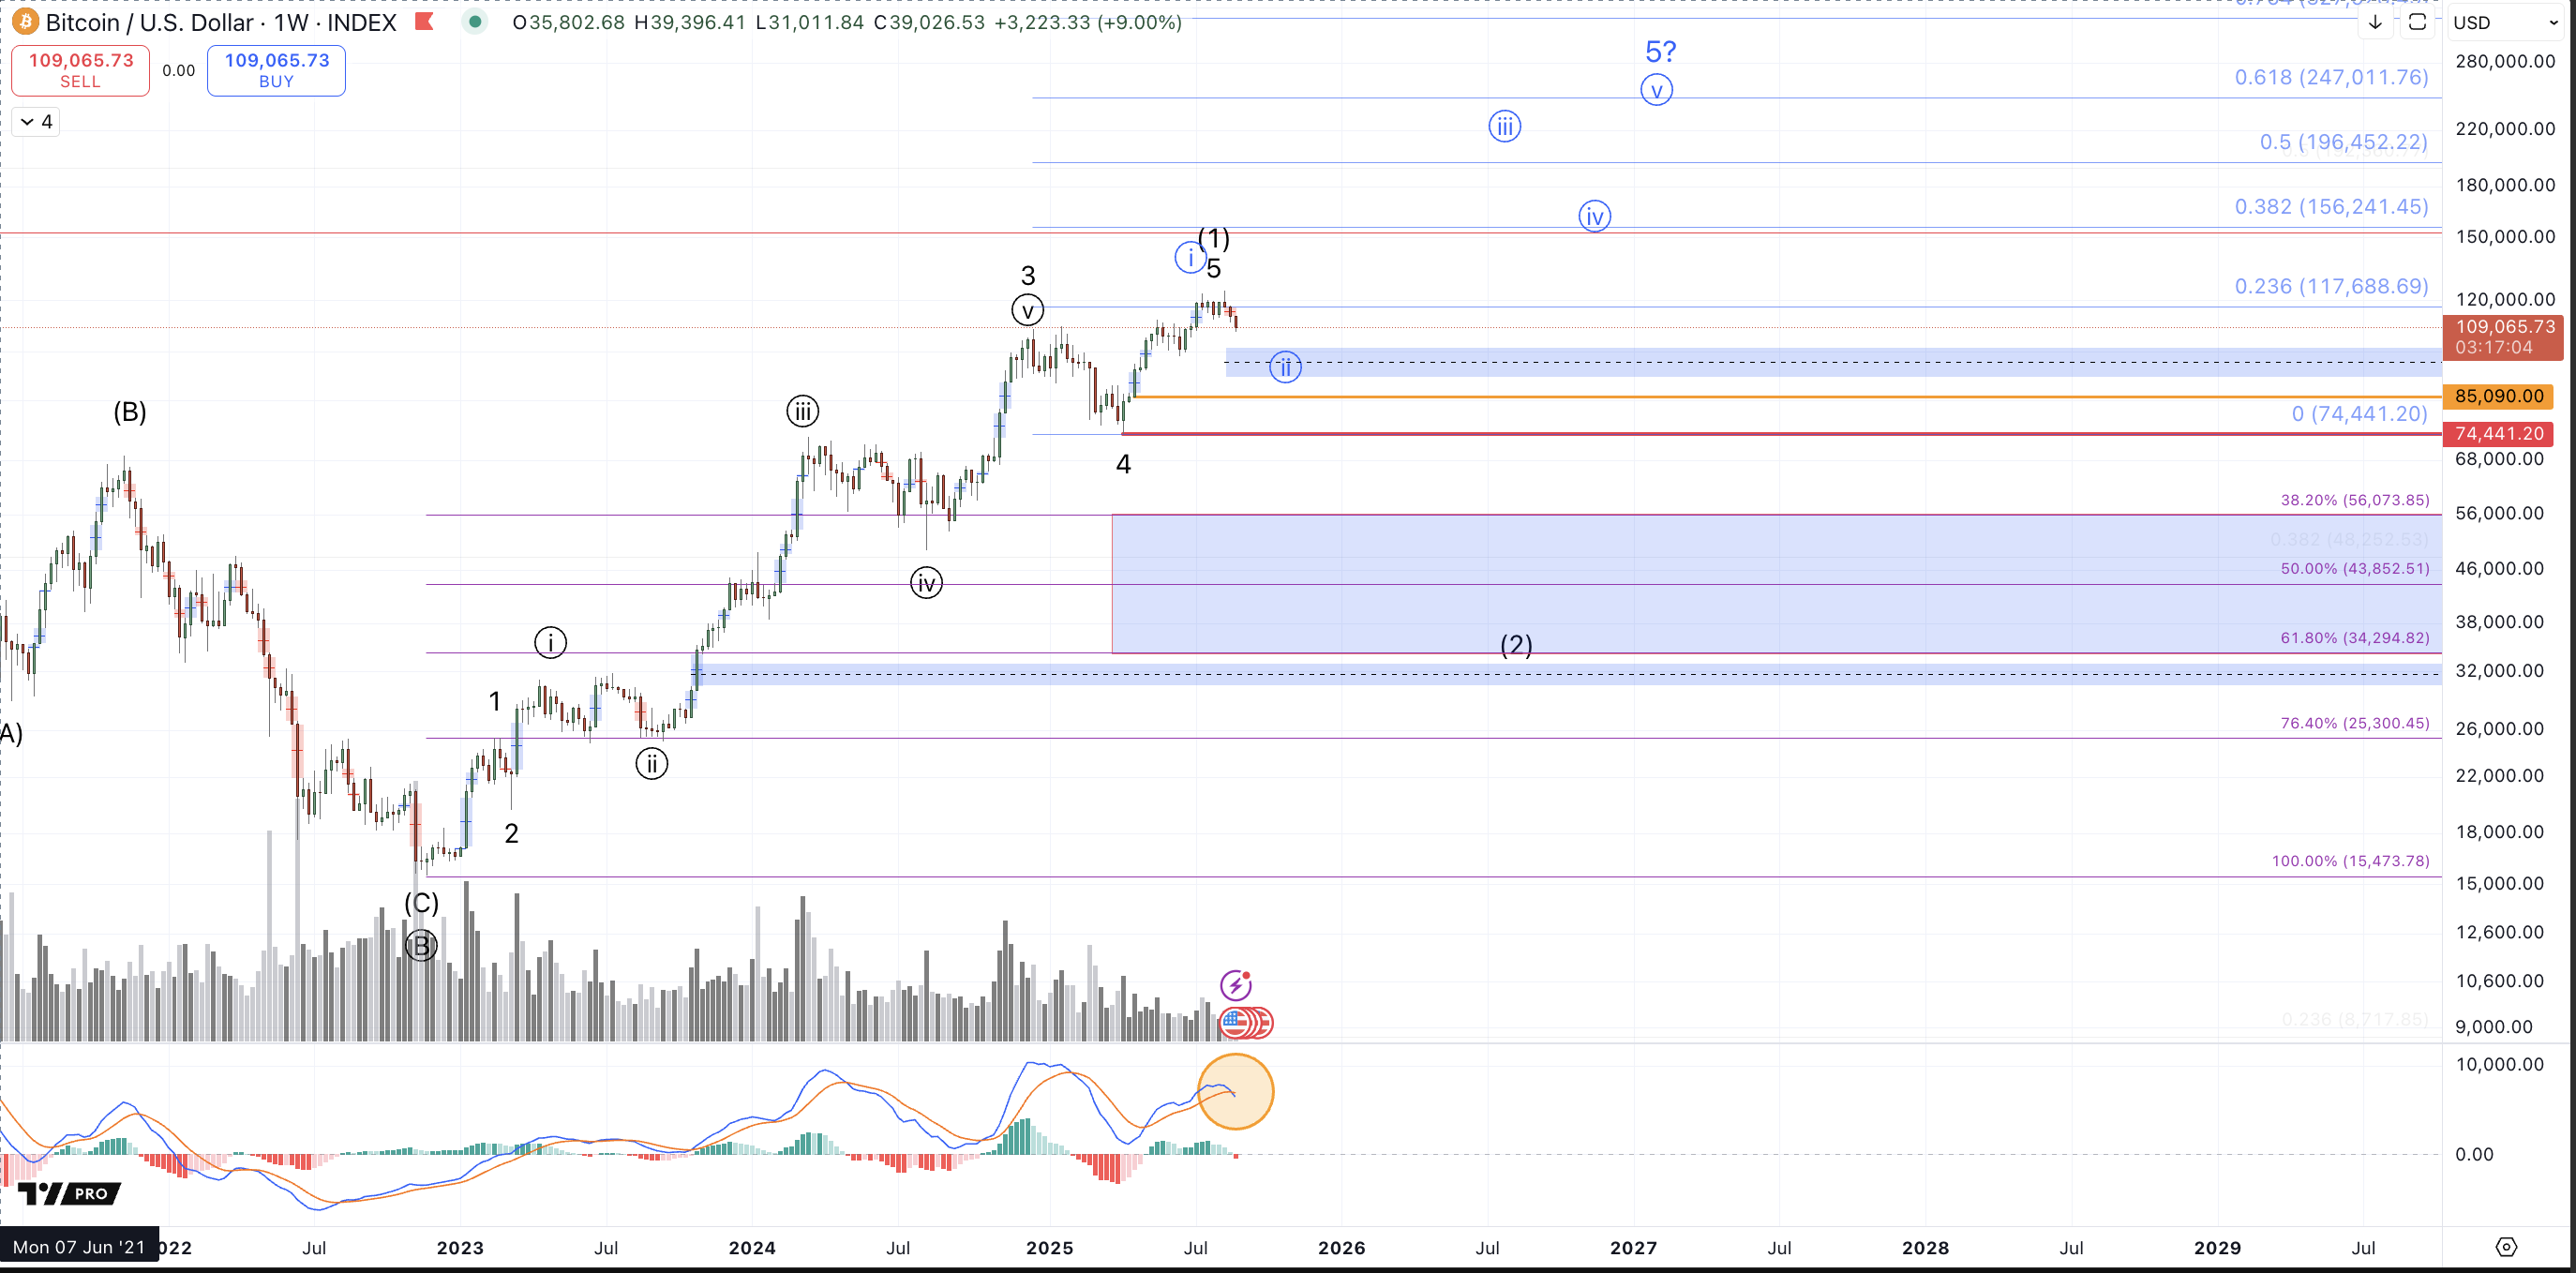
That question still remains unanswered in what's been a mostly uneventful week in Bitcoin. To that effect, I have little to update from last week's post on the larger degree so I would suggest re-reading the article as it lays out a few different reasonable roadmaps for the upcoming weeks and months.
What's worthy of novel discussion this week is the shorter timeframe action and how we have a change in character within the market.
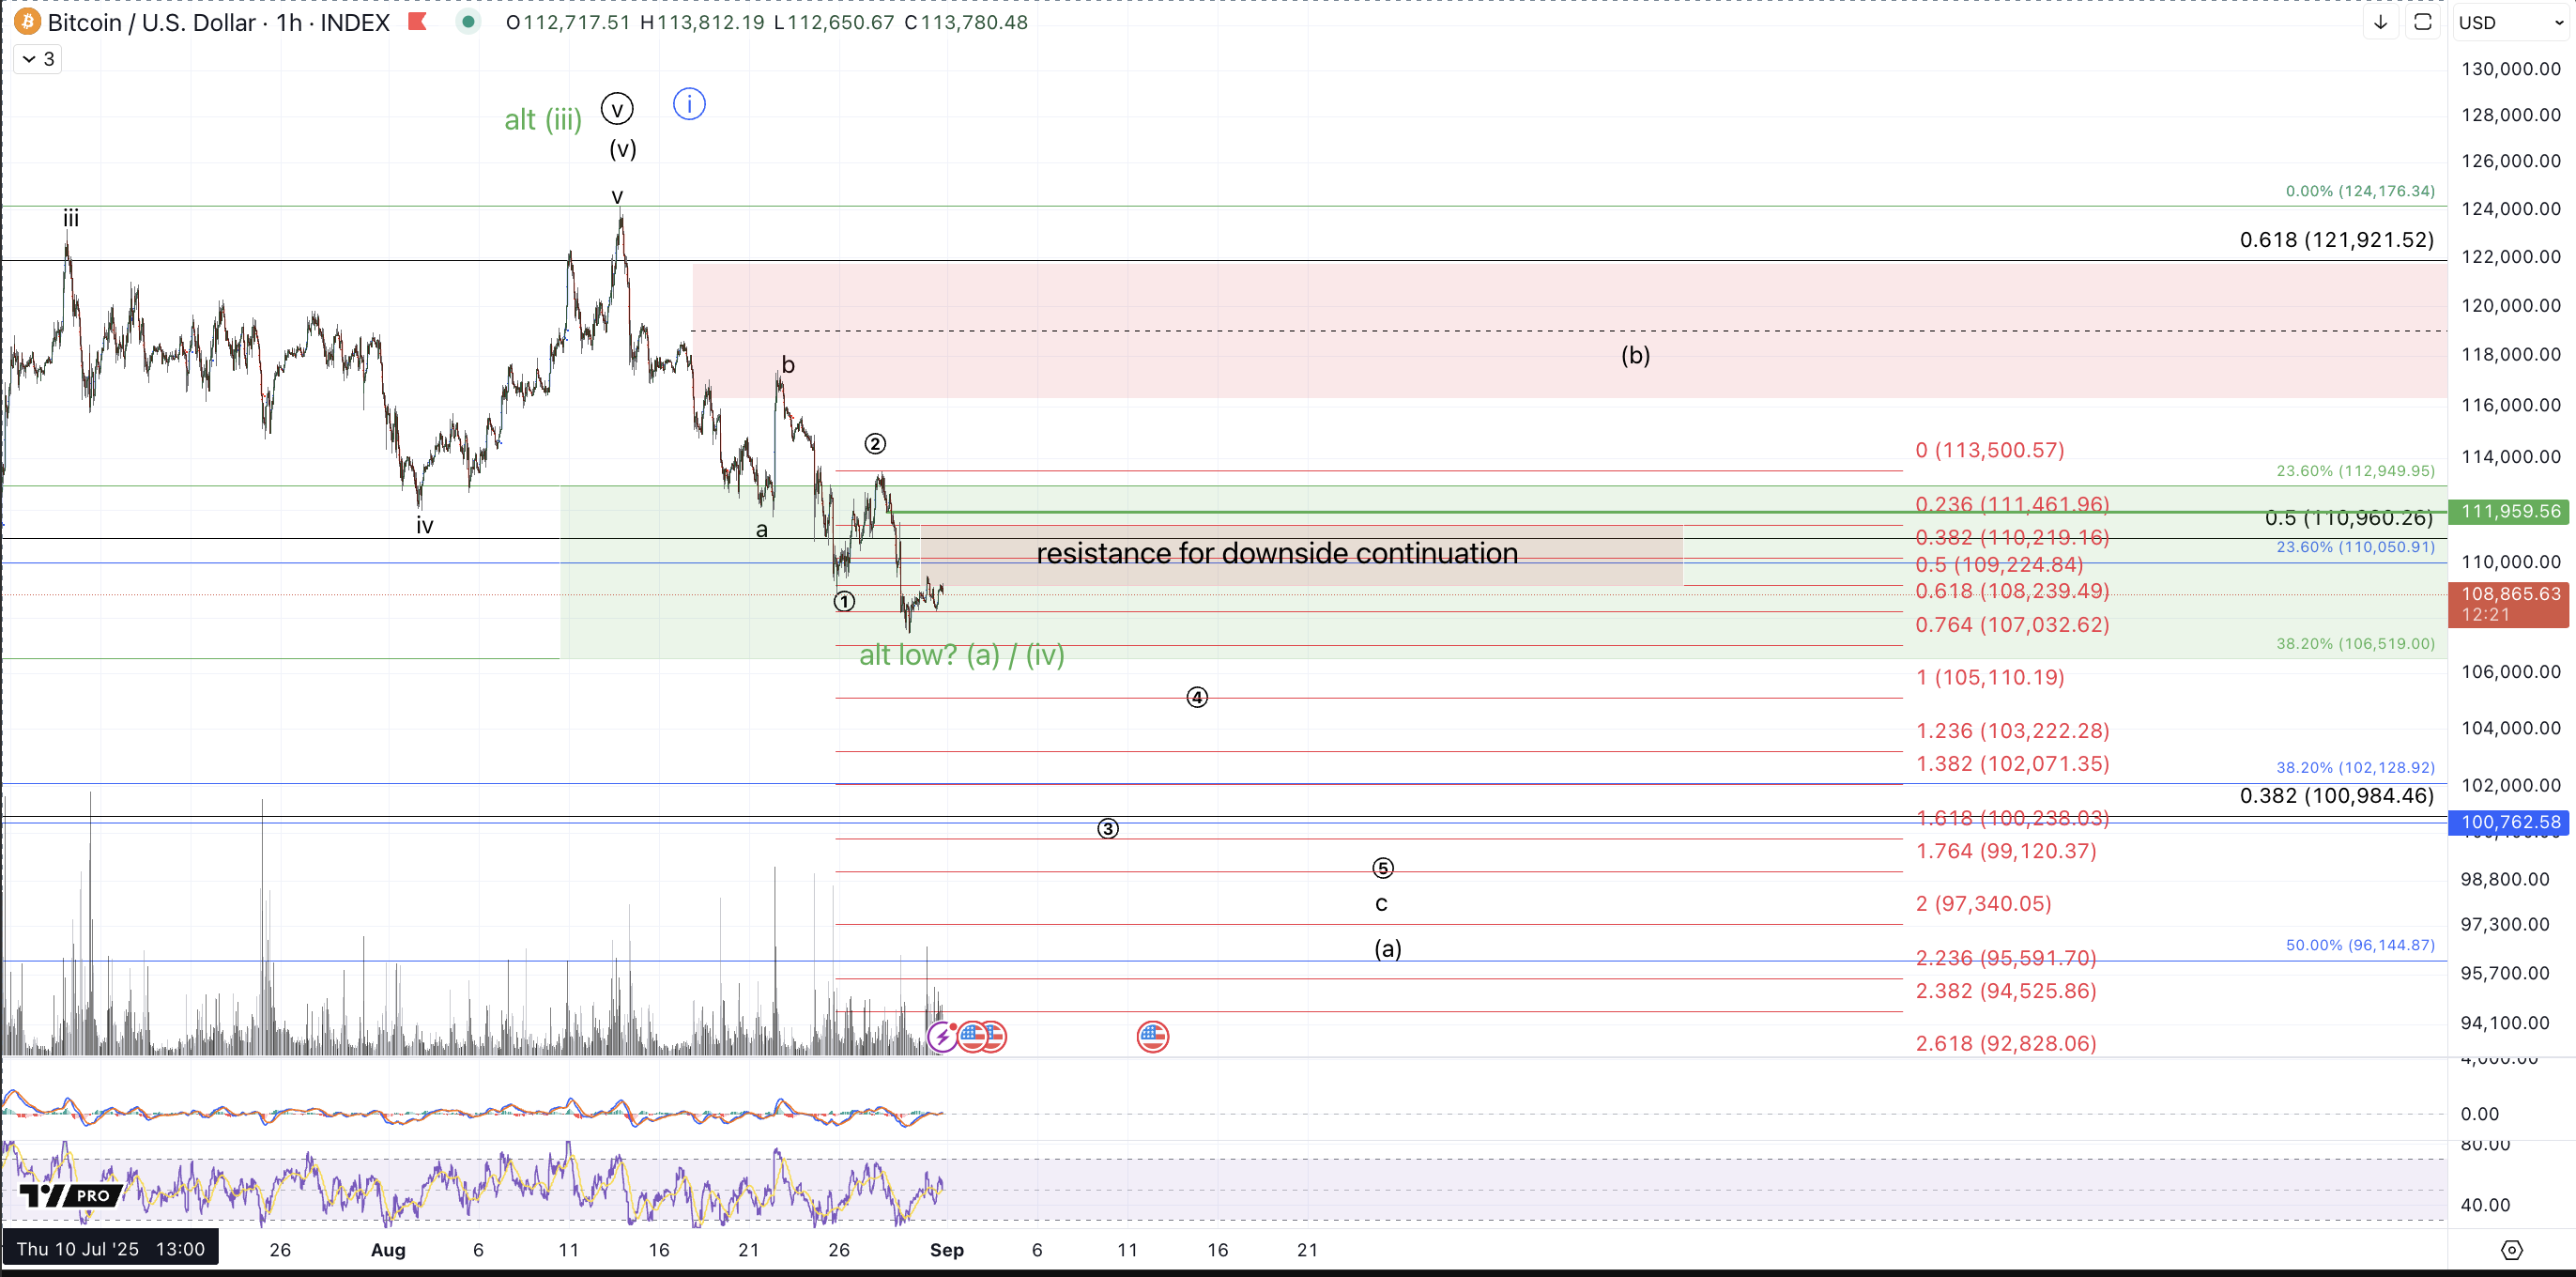
While price is still maintaining support for the immediate higher high in green, thus leaving the door open to all of the counts presented on the 4h chart from last week, Bitcoin is now maintaining back under the May highs, $111.9k, the level that was tested from above in the early August lows. For now, this serves to be a pivot point of sorts. That suggests upside continuation above and downside continuation below.
Specifically the wave count interpretation is between a bottom forming at the weekend lows, around $107.4k as either an (a) wave or potentially a wave (iv) in the alternative green count vs. more direct downside for a deeper (a) wave which would ideally target the $96k-$99k region. The latter scenario is presented in black on the micro chart and is suggestive of a 1-2, (1)-(2) downside formation setting up for a steep decline in wave (3) of circle 3. Should we see price break back below the current weekend low on a sustained basis, this count becomes strongly favored.
However, if price makes a sustained break back above $111.9k it risks invalidating the immediate bearish setup which would actualize with a break above $113.5k. While such a move would certainly keep alive the green count for a potential immediate run to new all-time highs, a break above $113.5k more likely signals a (b) wave rally scenario where price already bottomed in the initial decline off the all-time high. Resistance for further downside continuation in this scenario is $116k-$122k. So, in order for me to get serious about the green count, price should really hold the current weekend low and then provide a rally through $113.5k in impulsive fashion. Should price satisfy all those conditions, I'll consider bullish mode back on (at least temporarily) for a run to $130k-$140k. However, should price satisfy the aforementioned conditions with the exception of forming a corrective type rally, the (b) wave bounce count will remain favored.
As mentioned above, the action this week has been relatively uneventful, but what's notable is that micro resistances have been respected and bounces have been relatively short-lived and corrective. This represents a change in character in the action since the June low and for the most part from the April low. While in and of itself this does not give us a ton of information, it adds some weight to a thesis considering a more lasting top in place at least as per the blue count. Also, as has been noted in the room, we have a downside crossover on the weekly MACD, which can technically reverse and not actualize should we see a huge move up in the next few hours. Assuming the crossover officially occurs though, this will be another signal that price is unlikely to get a more immediate new all-time high. In the past several years, most MACD downside crossovers on the weekly chart have been followed by more downside. That is not to say that this signal suggests immediate breakdown but it does suggest that after a bounce of sorts (or not) that Bitcoin is likely to get more downside at least to test the support for the blue circle ii in that count, $90.5k-$102.2k
I'll conclude with noting that while I'm not bearish on Bitcoin, I do consider oversized and medium term long positions to be at greatly increased risk here, and I'd be much more comfortable looking to potentially re-accumulate below $92k.