Bitcoin: Rangebound Action Continues
 By
Jason Appel
By
Jason Appel
Bitcoin: Rangebound action continues
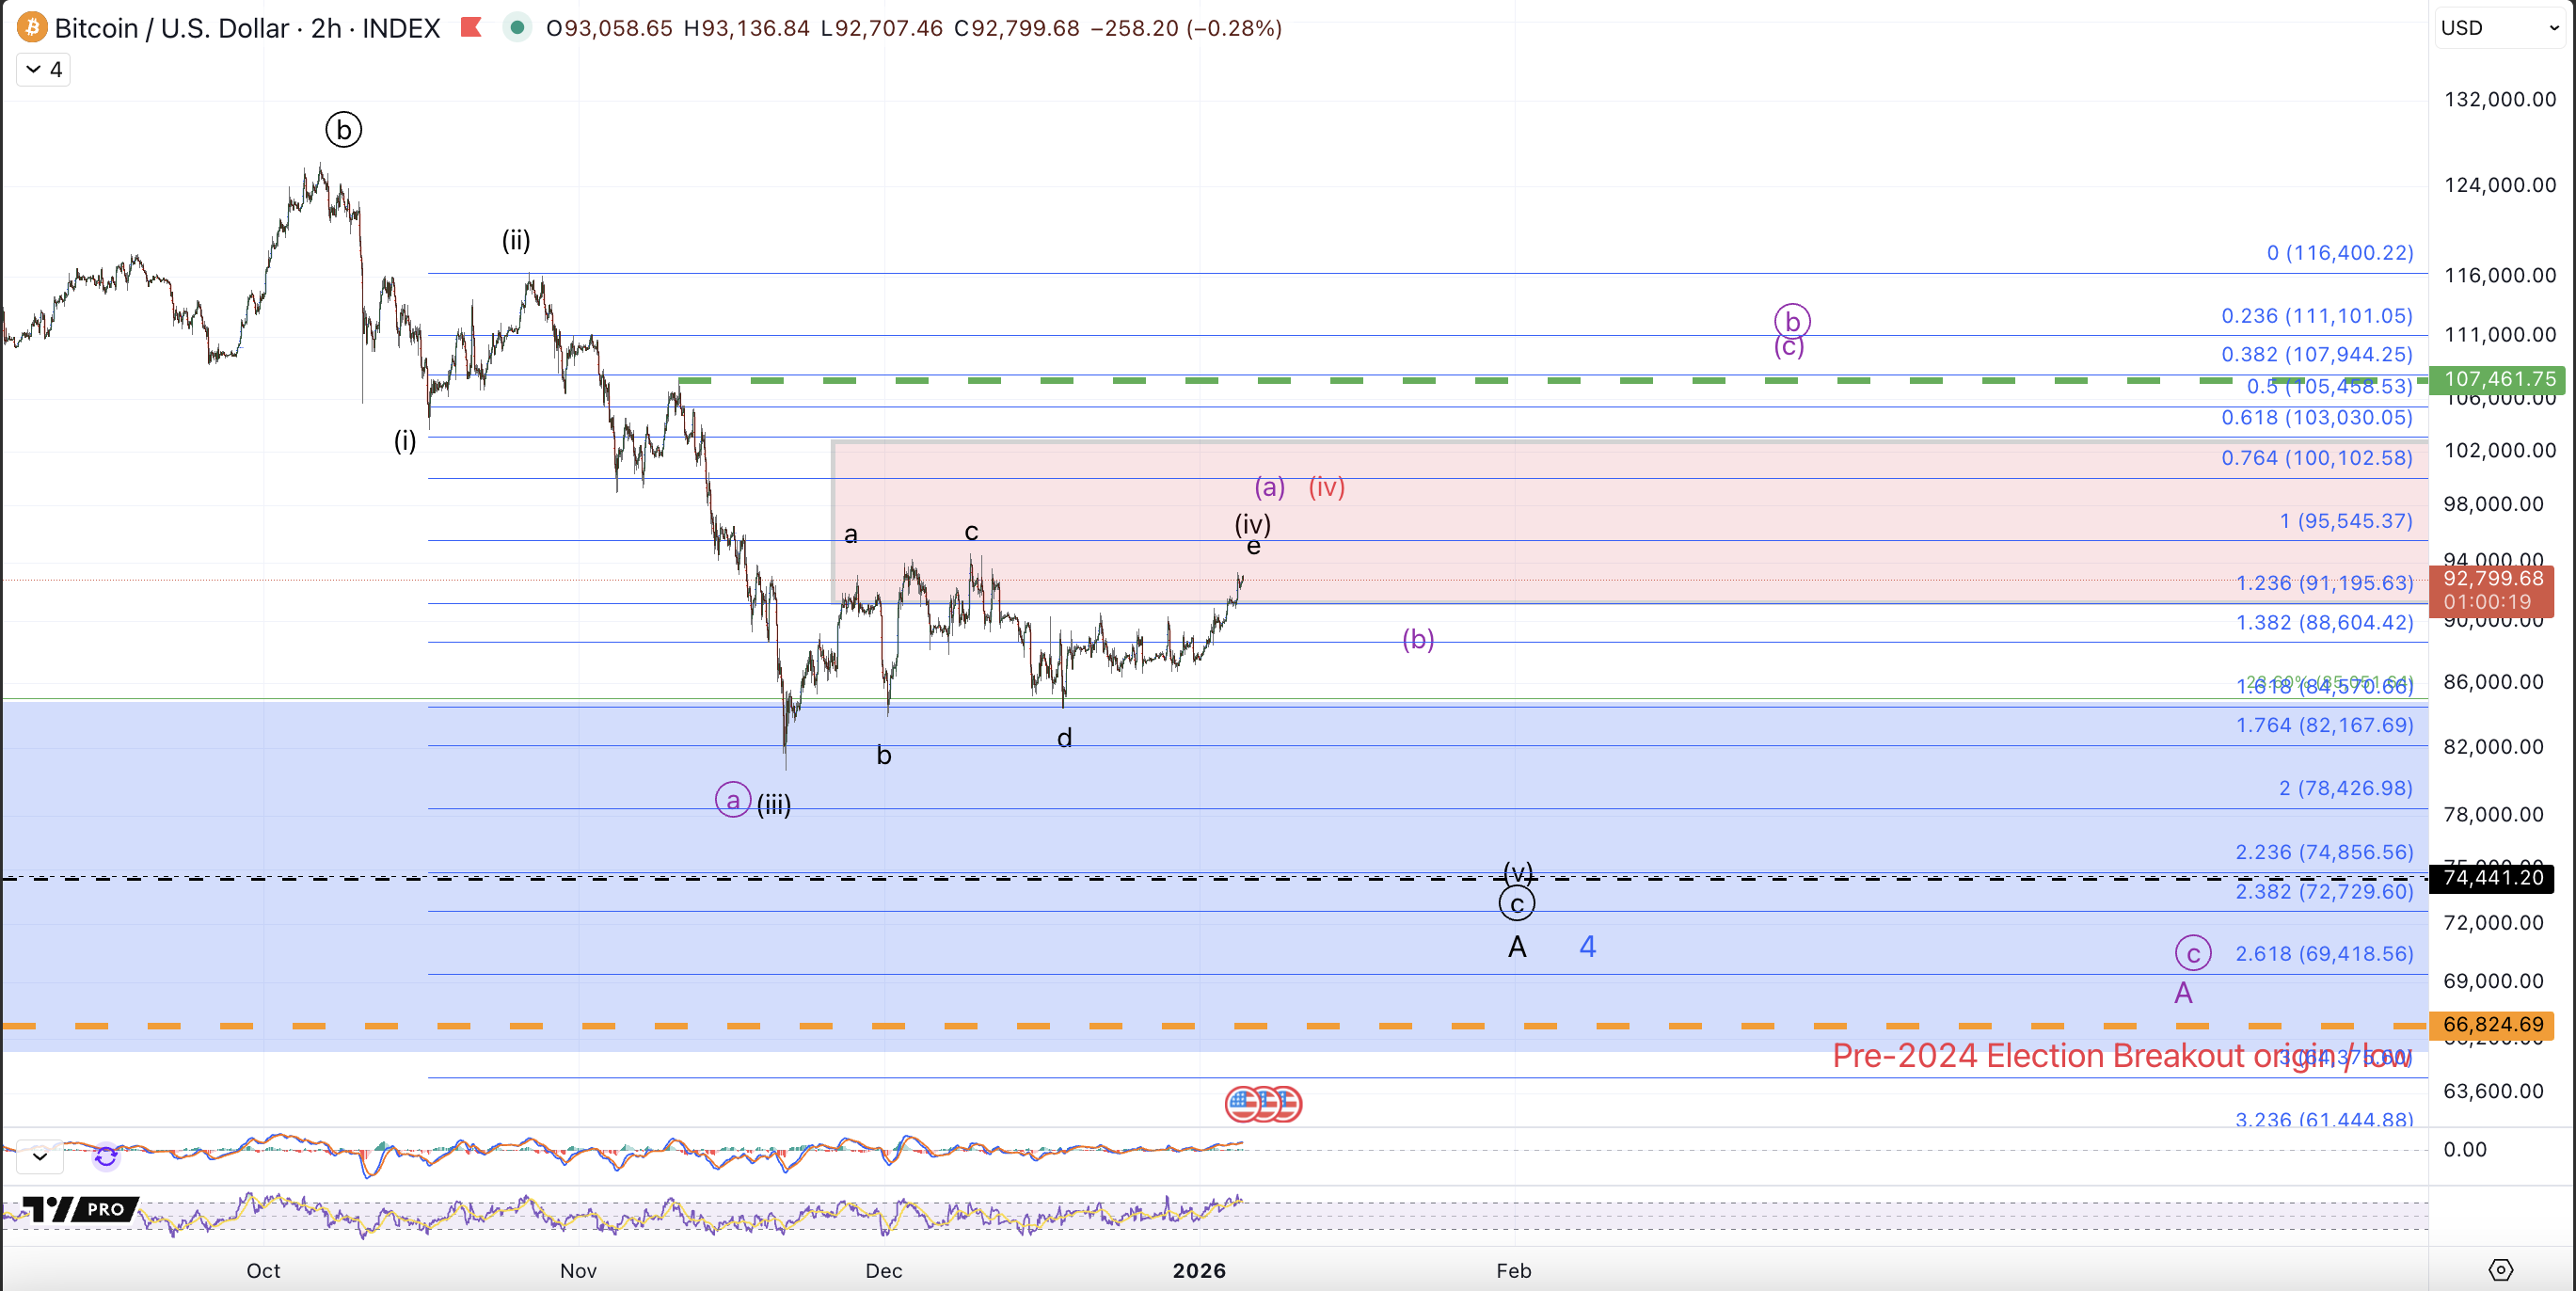
In the past few articles, I've posited various lower time frame paths for how Bitcoin might eventually break out or break down from the current range. For both longer term and shorter term players the past several weeks can all be seen as noise. December was a rather lackluster month for both bulls and bears alike as price remains stuck between the $80.6k November low and the $94.6k December high. In Elliott Wave Analysis these sideways price consolidations with a contracting range are referred to as triangles and are frequently occurring within the wave 4 of some larger 5 wave structure. That perspective tracks nicely within the context of the decline from the October high. Price formed a relatively swift 3 wave decline to drop about 36% into the November low, taking roughly 6 weeks from the October all-time high and the subsequent 6 weeks has been a sideways consolidation.
On the micro level, so long as price maintains below the December high, $94.6k, the operative thesis here is that Bitcoin is filling in a very protracted wave (iv) triangle which ultimately entails a break down below the November low to complete the circle c wave down from the October all-time high. The expected breakdown targets $67k-$74k. Ideally we can at least see the April low retested.
What happens if price breaks above $95k prior to breaking the November low? While that would technically invalidate the operating thesis described above, it does not entail a clear bullish thesis. If this little rally continues early this week up past the December high, the purple count shown on the 2h chart becomes the favored thesis and entails that price is filling in a bigger minor degree A wave where the bounce from the November low is the initial circle a of a wider minor A wave. Resistance for that prospect ranges from $107.5k-$111k.
I also want to address the orange wave (iv) label. Resistance for wave (iv) within the structure from the October high ranges up to $103k. As such it's still quite possible to see a break above the December high but failure to reach the circle b wave resistance within the purple count. That path allows for the lower probability potential of a very large wave (iv) within a very expanding ending diagonal wave circle c.
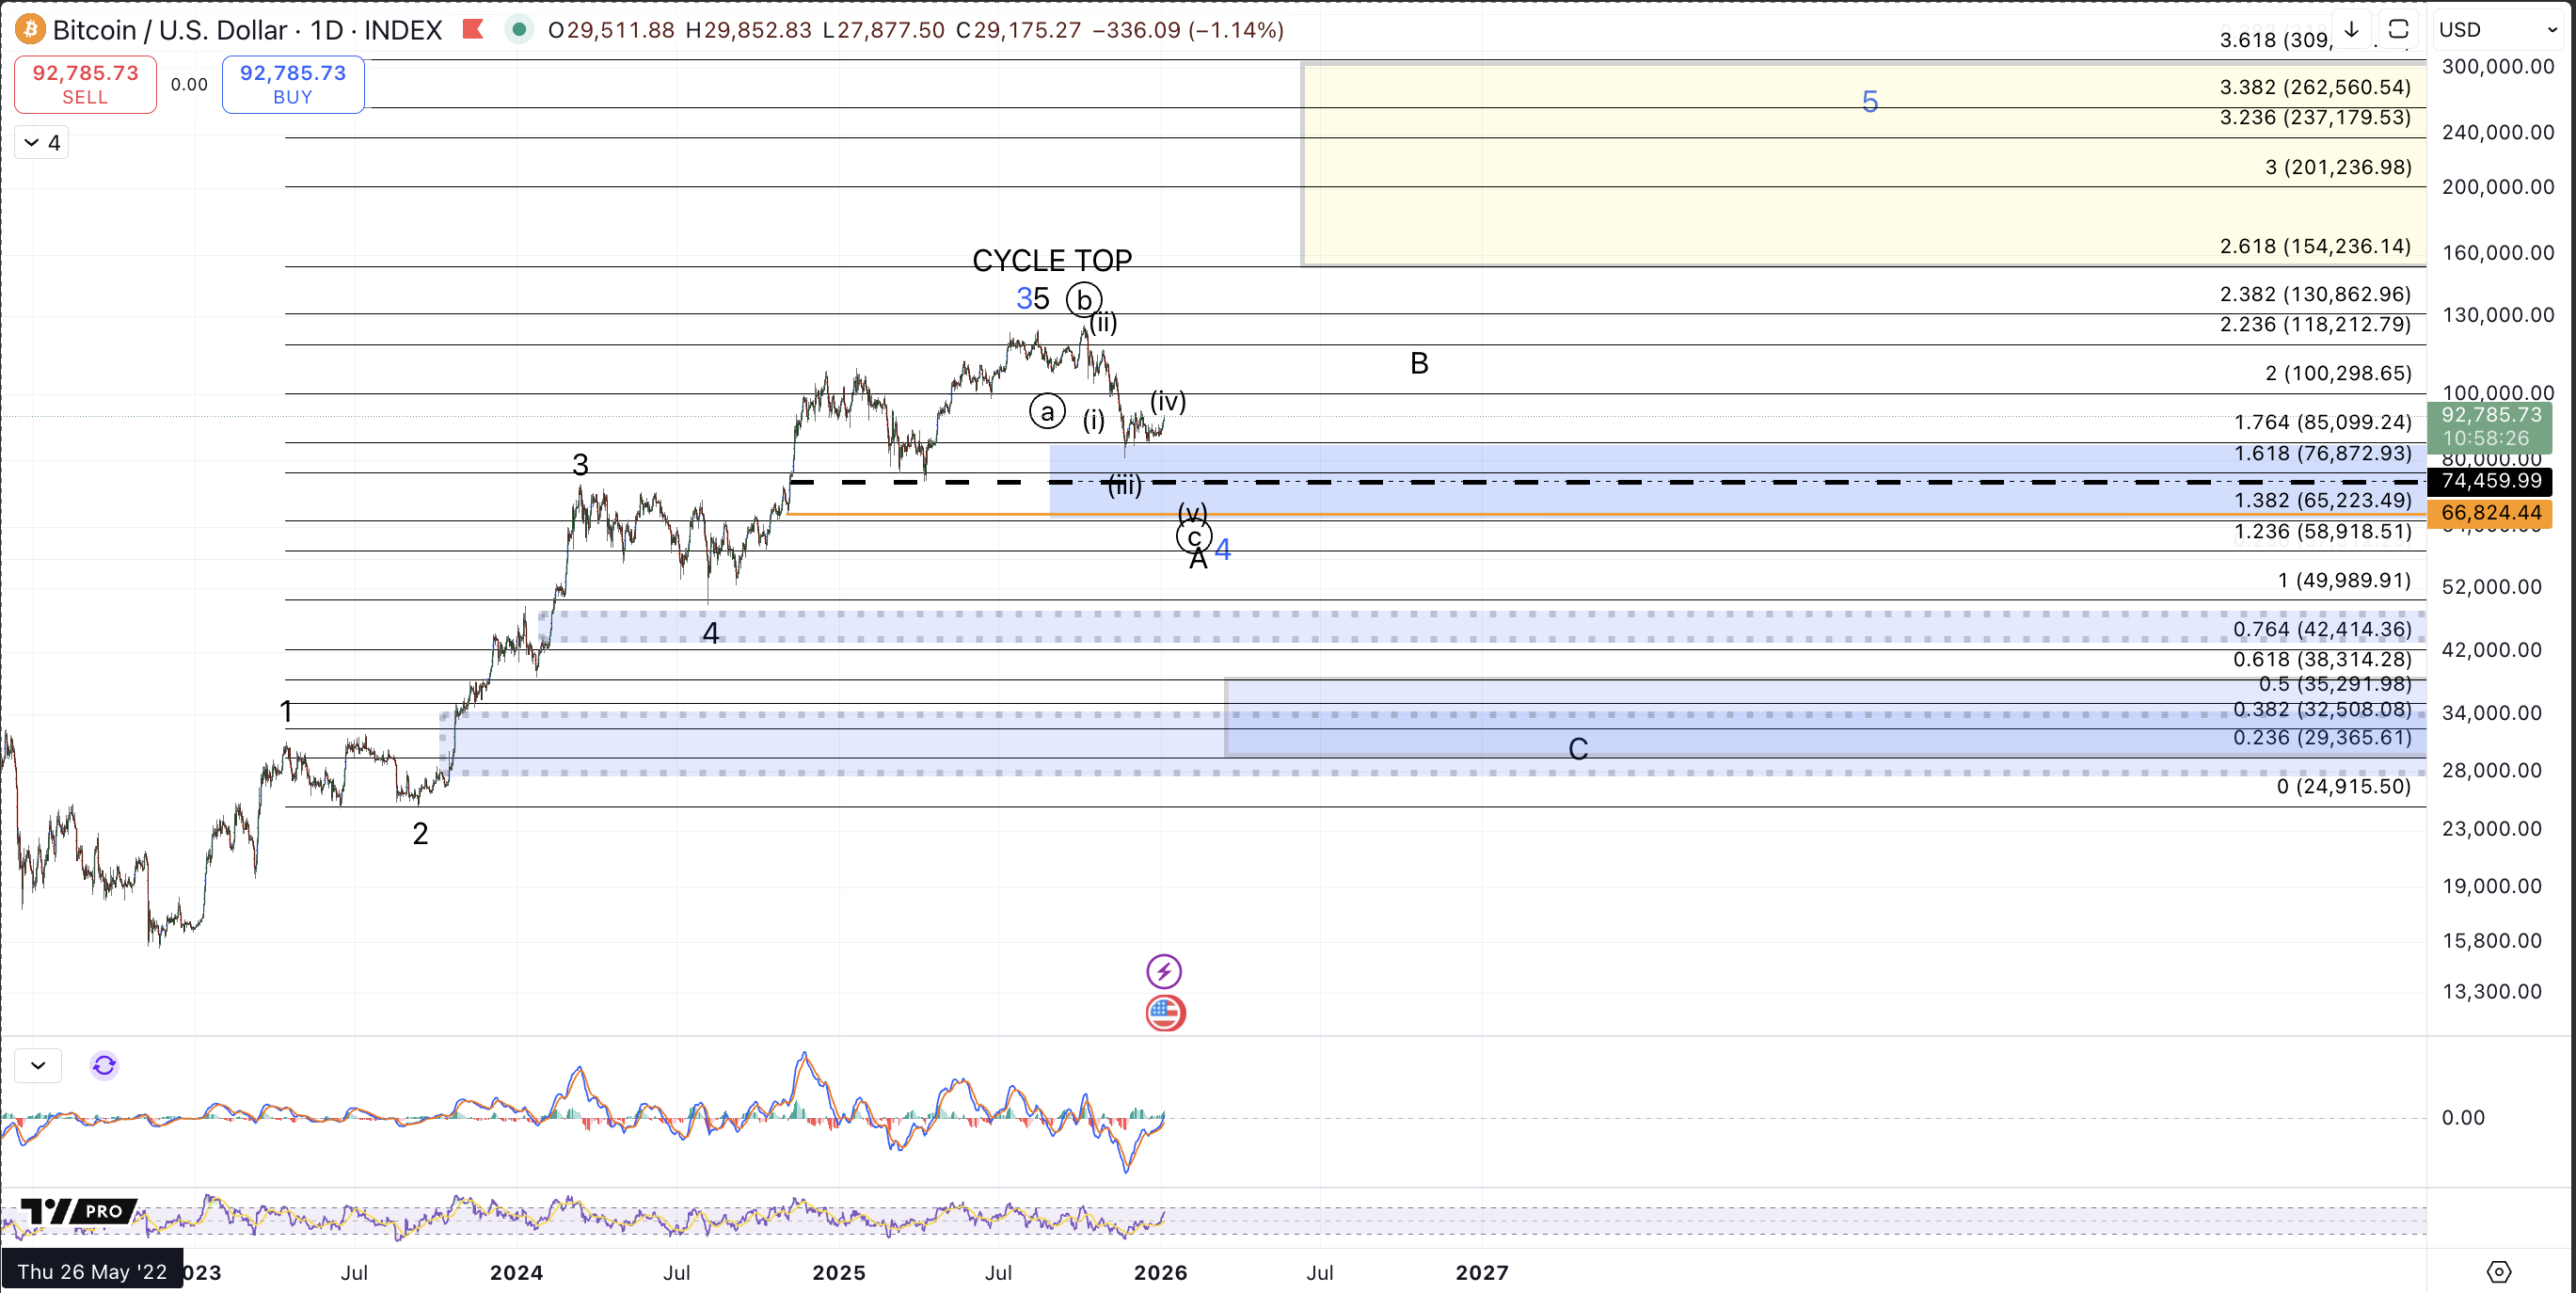
Regarding the larger degree prospects for more bullish continuation of the rally from the 2022 low, shown in blue vs. the completion of that rally and larger degree retrace in progress, shown in black: Nothing of substance has shifted whatsoever within these higher timeframe theses. We will still need to see some evidence of a complete circle c and then evaluate the structure of the bounce for clues as to how 2026 will develop. For now, we must wait patiently for price complete this consolidation and break the range that's developed