Bitcoin: Indecision - Market Analysis for Apr 5th, 2026
 By
Jason Appel
By
Jason Appel
Bitcoin: Indecision
One simple heuristic in Elliott Wave Analysis is to look at whether price is developing 5 wave structures in a particular direction or whether all moves in both directions are 3 wave moves. The market characteristics since the February low struck on 2/6 around $60k, fit the latter pattern: ie, 3 wave moves in both directions. This aligns with a market that lacks conviction to find clear momentum in a particular direction and is very typical of consolidations. So, it's quite fair to say by most means of analysis, that Bitcoin is in a period of consolidation but given the bounce off the February low with a few short-lived advances to new highs in the rally from $60k, this consolidation exhibits slight upwards intent.
All that is to say, that despite the persistent threat of lower lows down into the $55k region (or below) the higher odds path in the nearer terms remains generally upwards, ie maintaining for now the $60k low and working upwards to at least $80k.
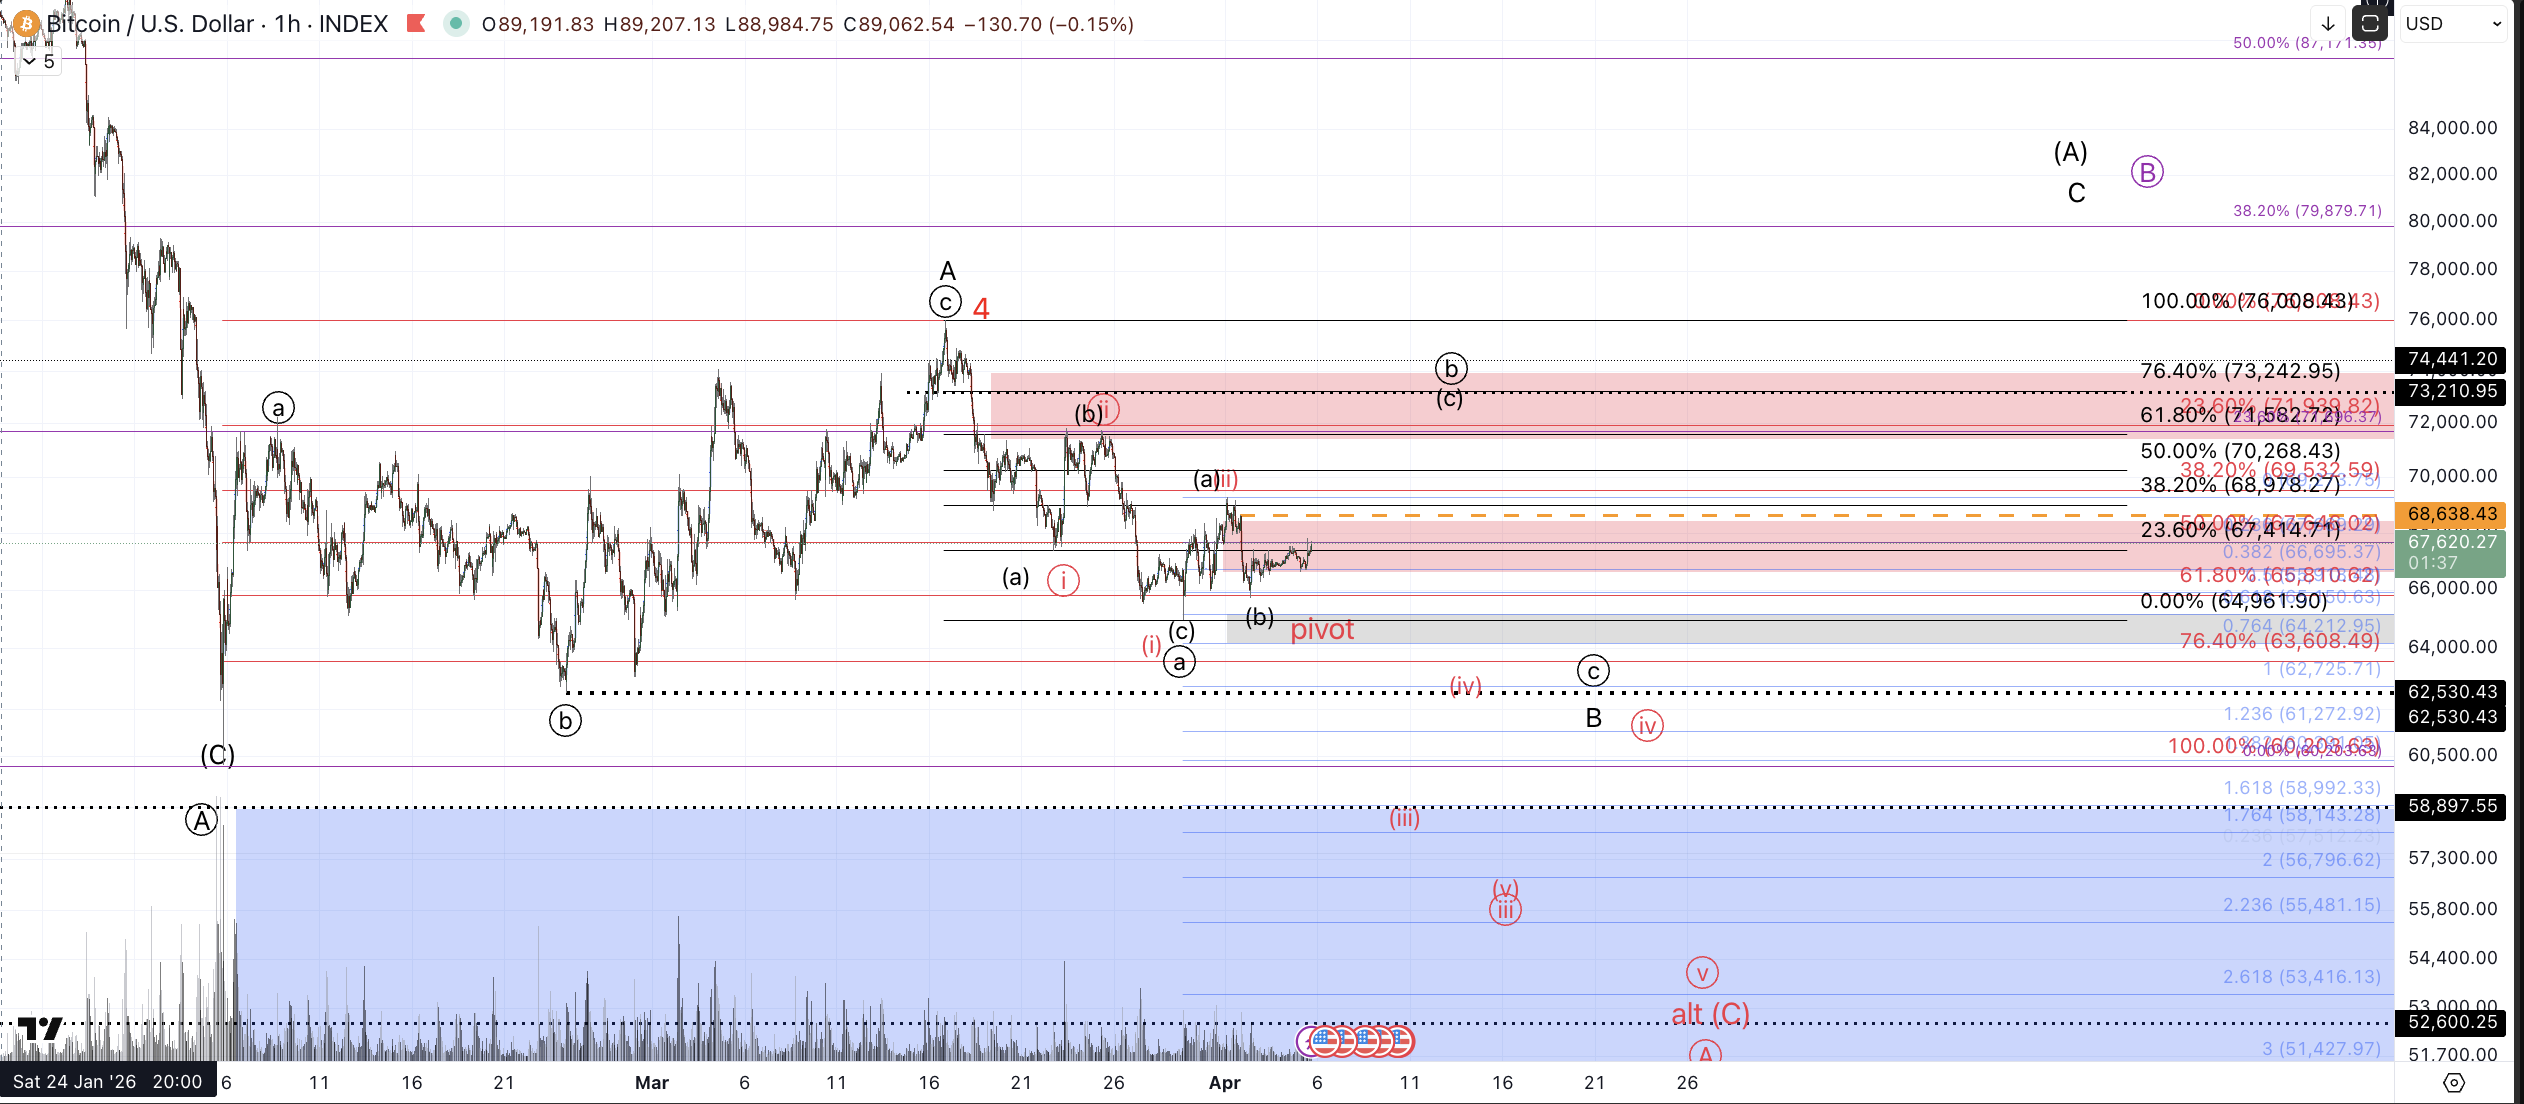
Though still in alternative status, the path for price to head immediately lower has some heightened risk so long as Bitcoin is maintaining below $68.6k. As such, we'll need a sustained break above that level to shake-off the risk of the immediate downside followthrough. Instead, should price head down this coming week, $64.2k will be a key level to watch. A sustained break below it increases odds of downside followthrough in the heart of wave (iii) of circle iii as displayed in red. Should such a decline develop below $64.2k the black count will require a quick reversal back through $65,150 to put the path higher back in favor. Essentially, in the current stance, $64.2k-$65.2k is a pivot region as noted on the 1 hour chart.
Instead, what's favored for the coming week is for price to head up to test the upper resistance on the 1 hour chart in the $71.5k-$73.3k zone for circle b of B. For this path, I'd prefer that the 3/29 low at $64,960~ is left untouched but should price move through it, I can allow for a slightly deeper circle a of B so long as price does not move beneath the pivot region.
In these persistent three wave patterns, I can not convey any particular path as a high confidence outcome. That is to say, I'm seeing the market as mostly lacking conviction for sustained momentum. That should be apparent when considering the expected path displayed in black on the 1 hour chart: up to $71.5k-$73.3k zone >>> down to $62.5k-$63k>>>up to $80k+. So I'll note explicitly that I don't have a ton of conviction on which direction the "knuckleball" will oscillate next.
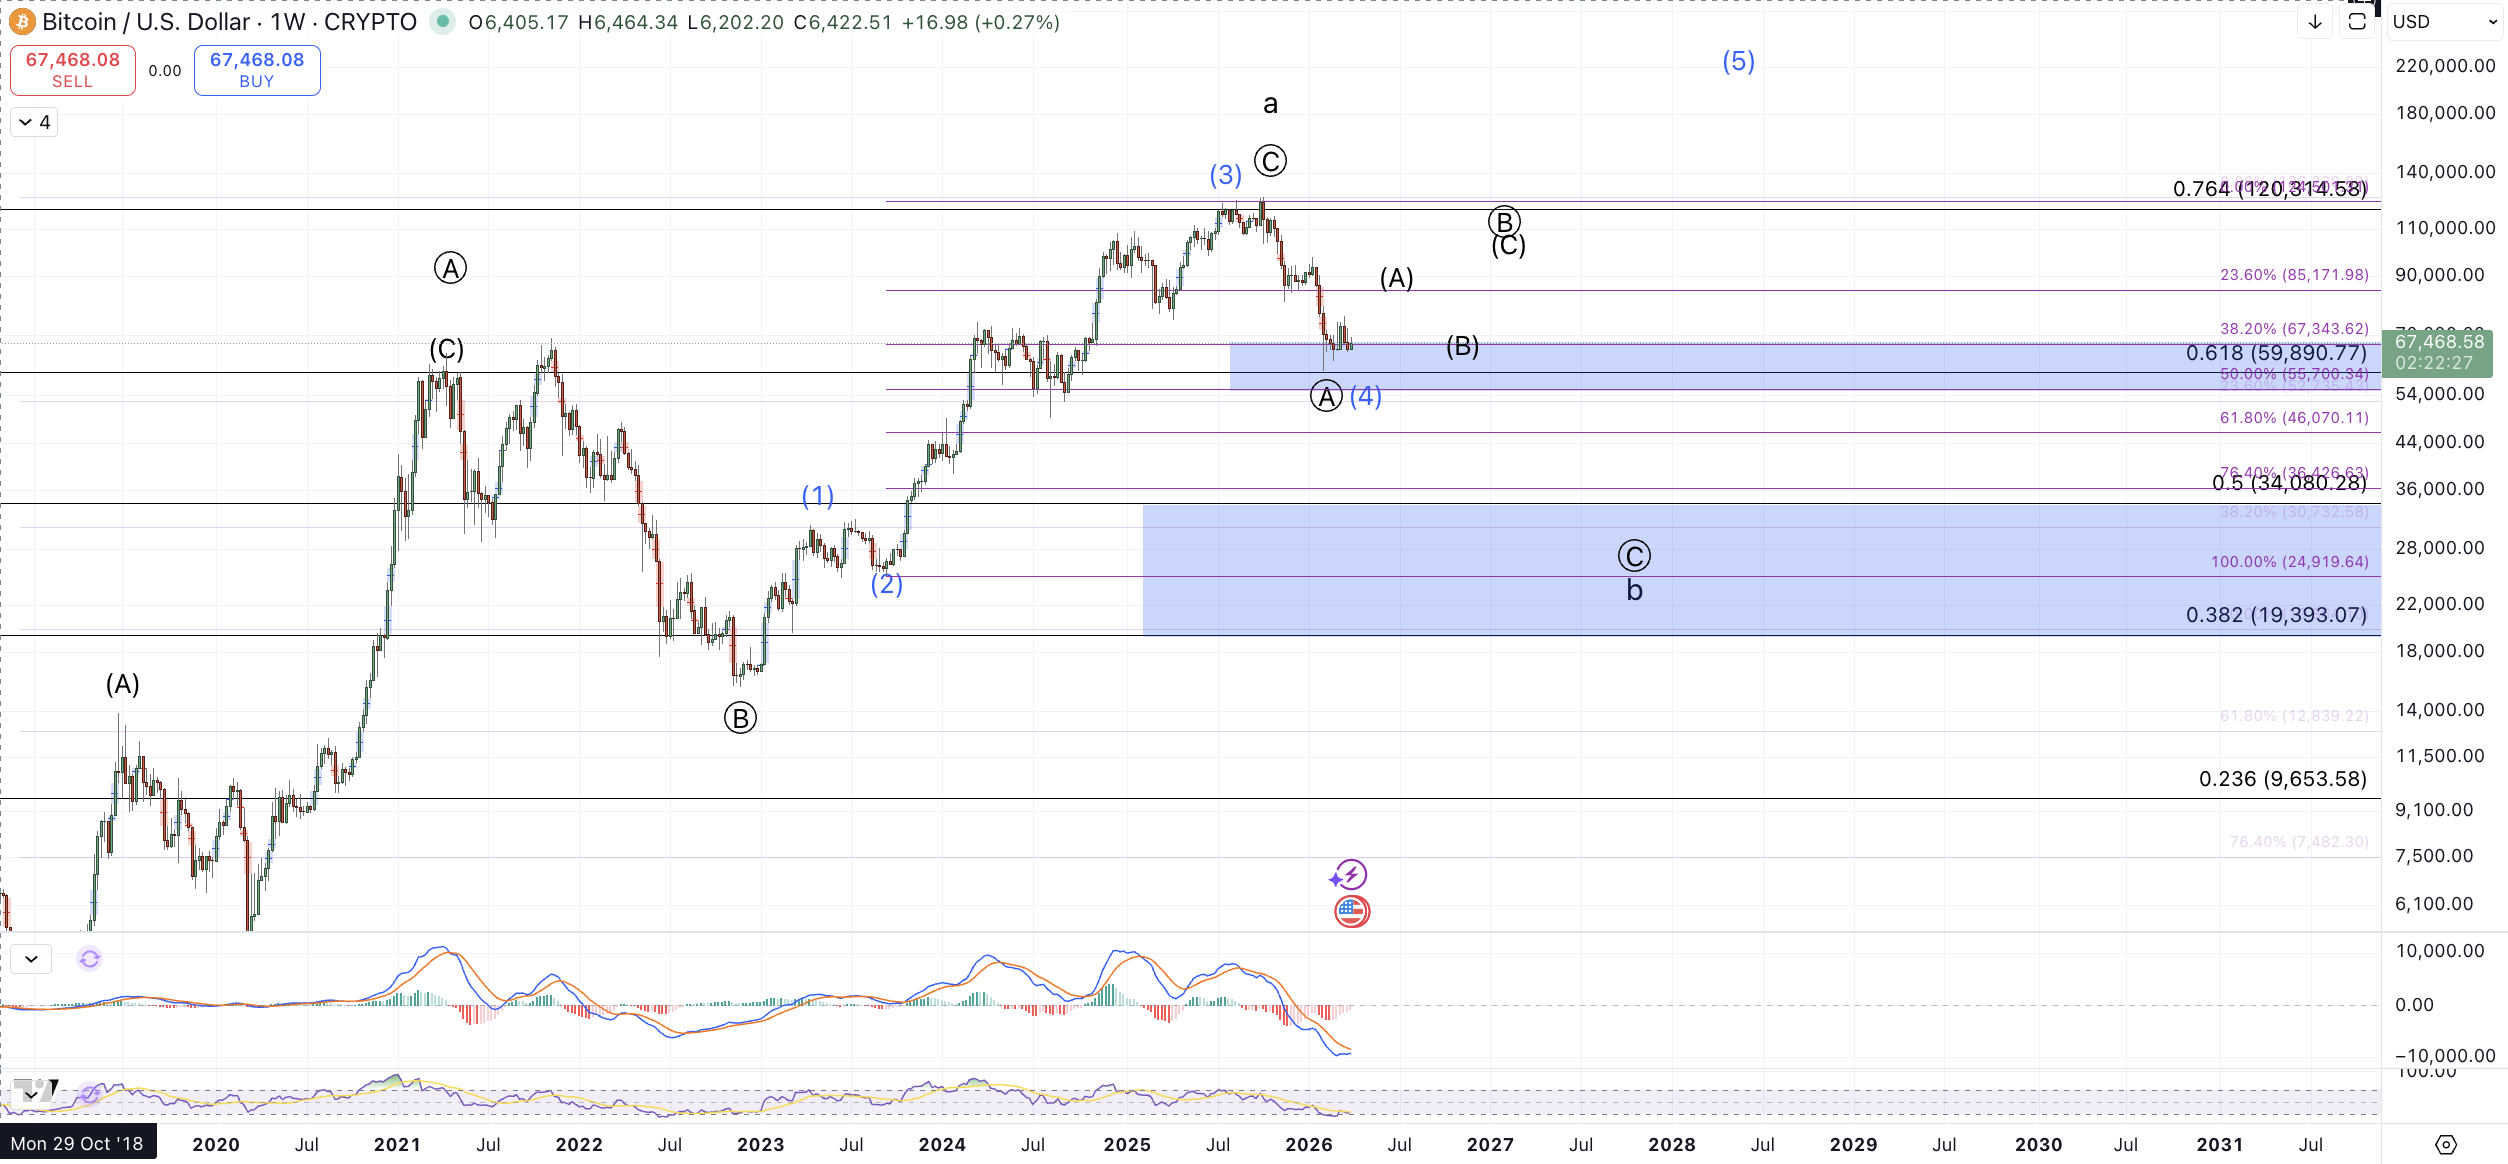
As price works its way through this consolidation and inventory turns over and changes hands, nothing has changed on the larger degree. The expected path still favors an intermediate low in place and working on a corrective bounce before lower lows are seen in this correction from the all-time high. As my larger degree chart shows, I would prefer a test of the $19k-$34k region in a clear three wave decline from the all-time high before a very large degree lasting bottom is in place. Based on the very corrective action from the February low, I don't see any clear path directly to new all time highs without first providing a lower low to start anew any serious upside rally potential. Should the red count take hold on the micro count and provide a slightly lower low beneath $60k, then we can entertain once again the possibility of the blue count (a run up $200k+) but for now, as price turns over correctively between $60k-$76k, this path has no realistic odds of coming to fruition.