Bitcoin: Heading Back Below $100k?
 By
Jason Appel
By
Jason Appel
Bitcoin: Heading back below $100k?
Last week's article, titled Bitcoin: No Route Yet Selected gave slight favor to the more immediate downside perspective described in details in the 10/20 article which laid out the various paths considered most reasonable to track for the next several weeks due to having the most likelihood.
Since last week's article, price topped in the noted resistance region and declined back into the middle of the trading range that's developed since the 10/17 low. Sans context, this action appears without any favor, whether up or down, to a particular resolution. However, in context, price's movement reasonably aligns with expectations laid out for downside to develop to take price back under $100k.
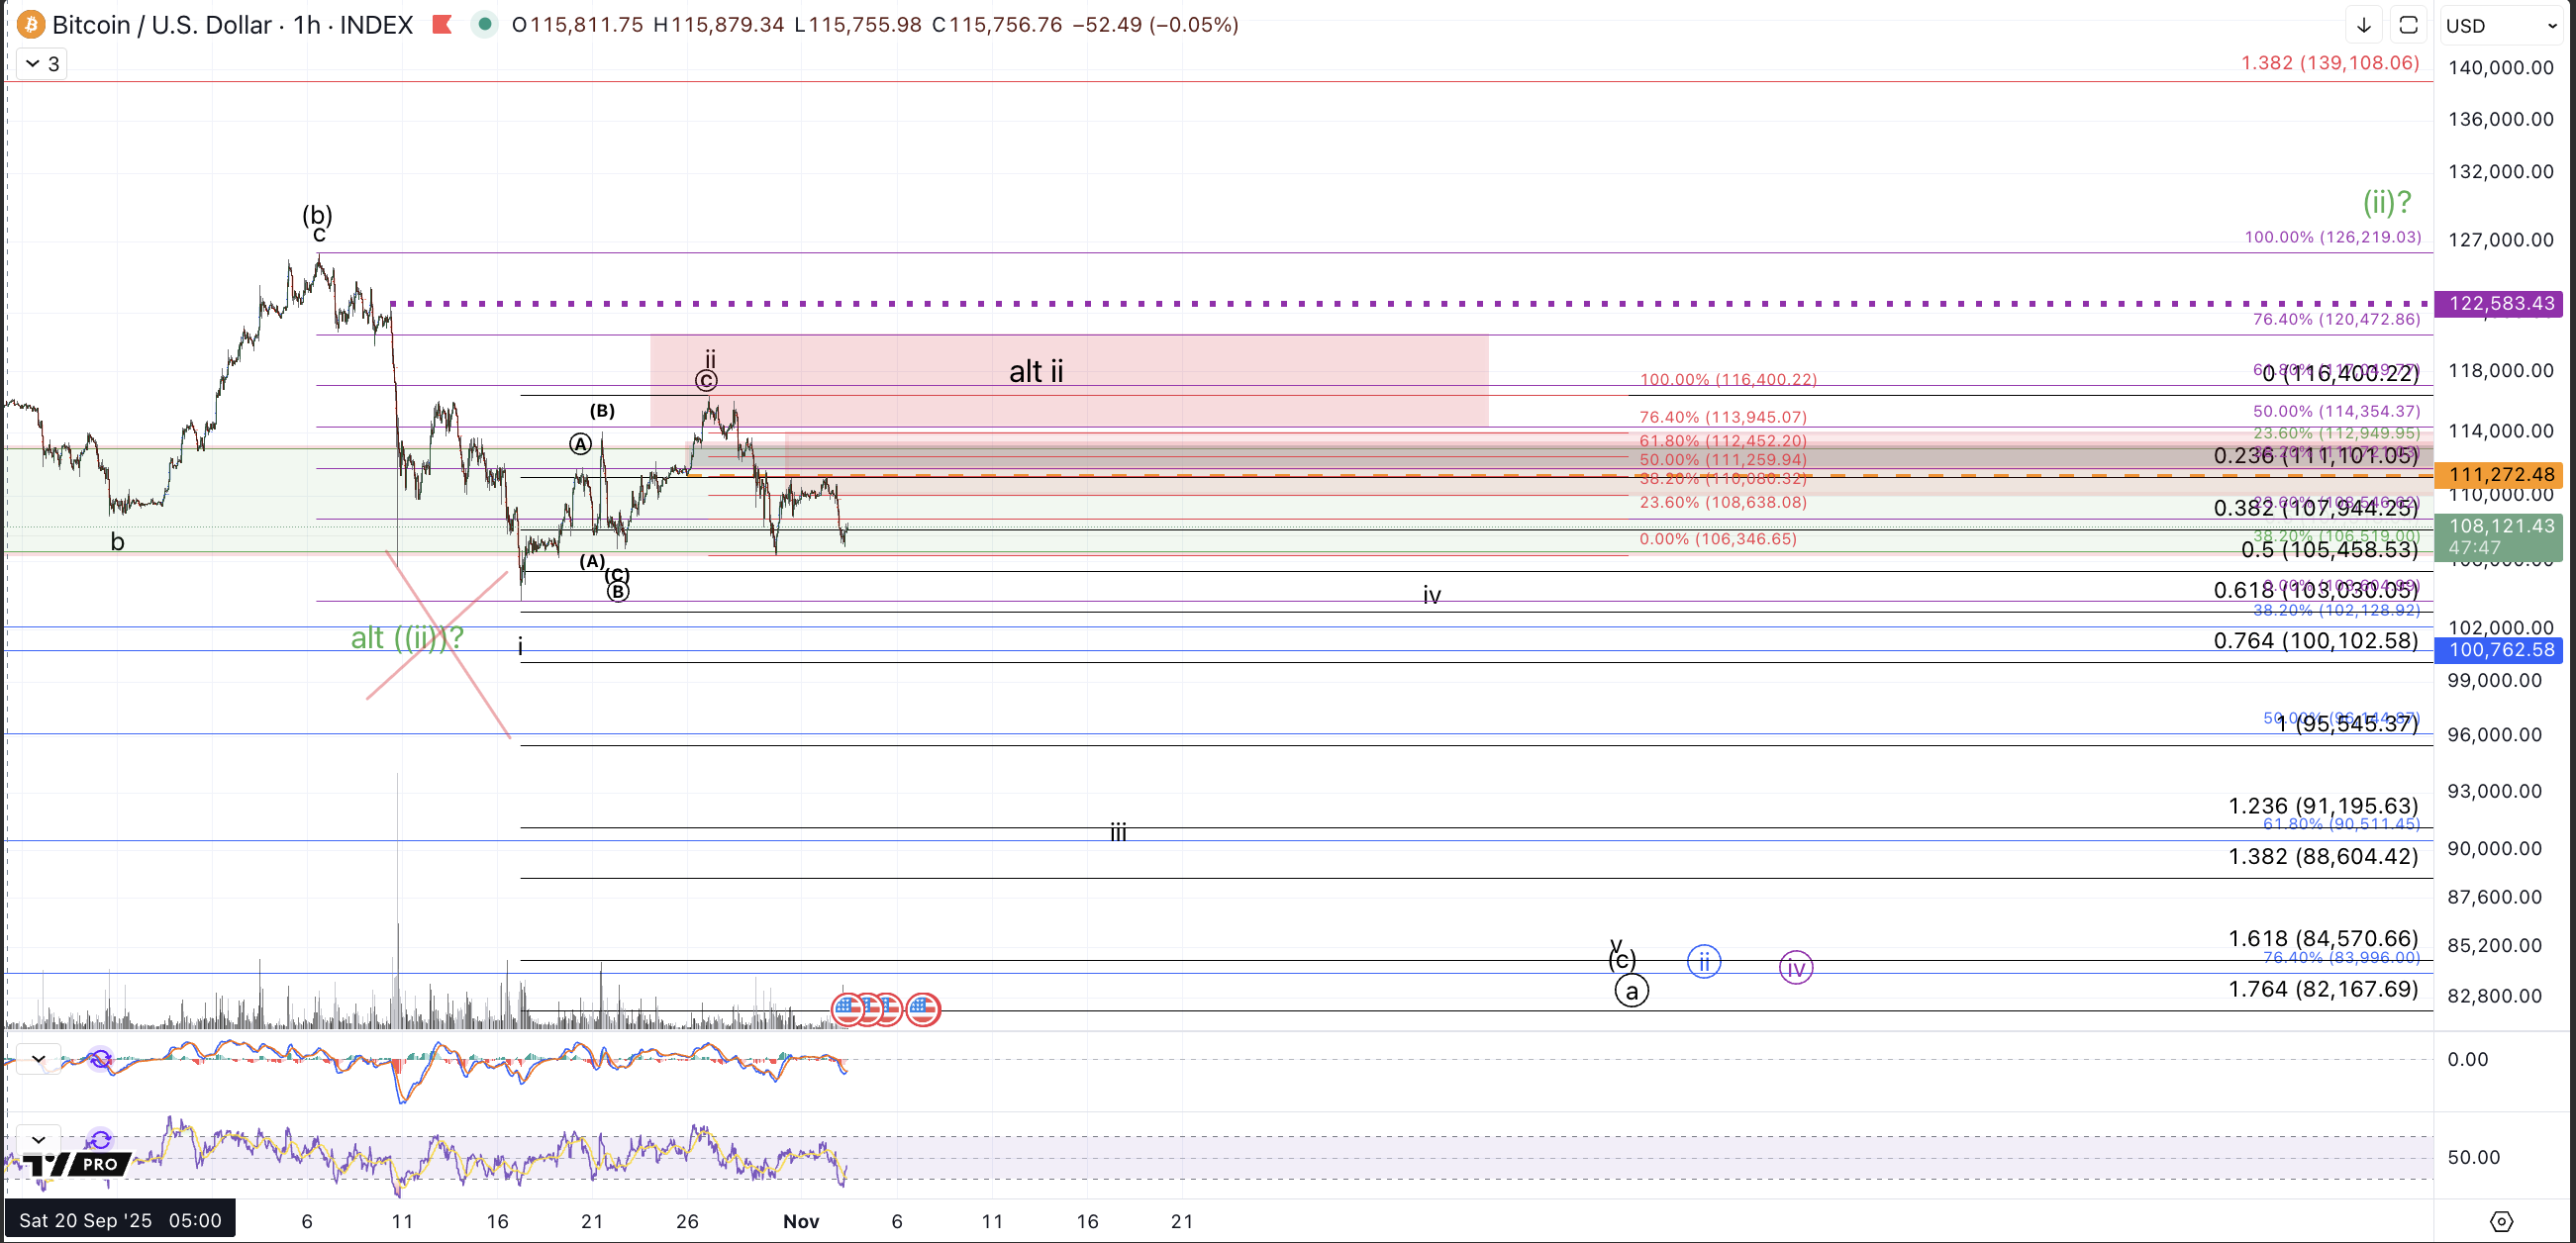
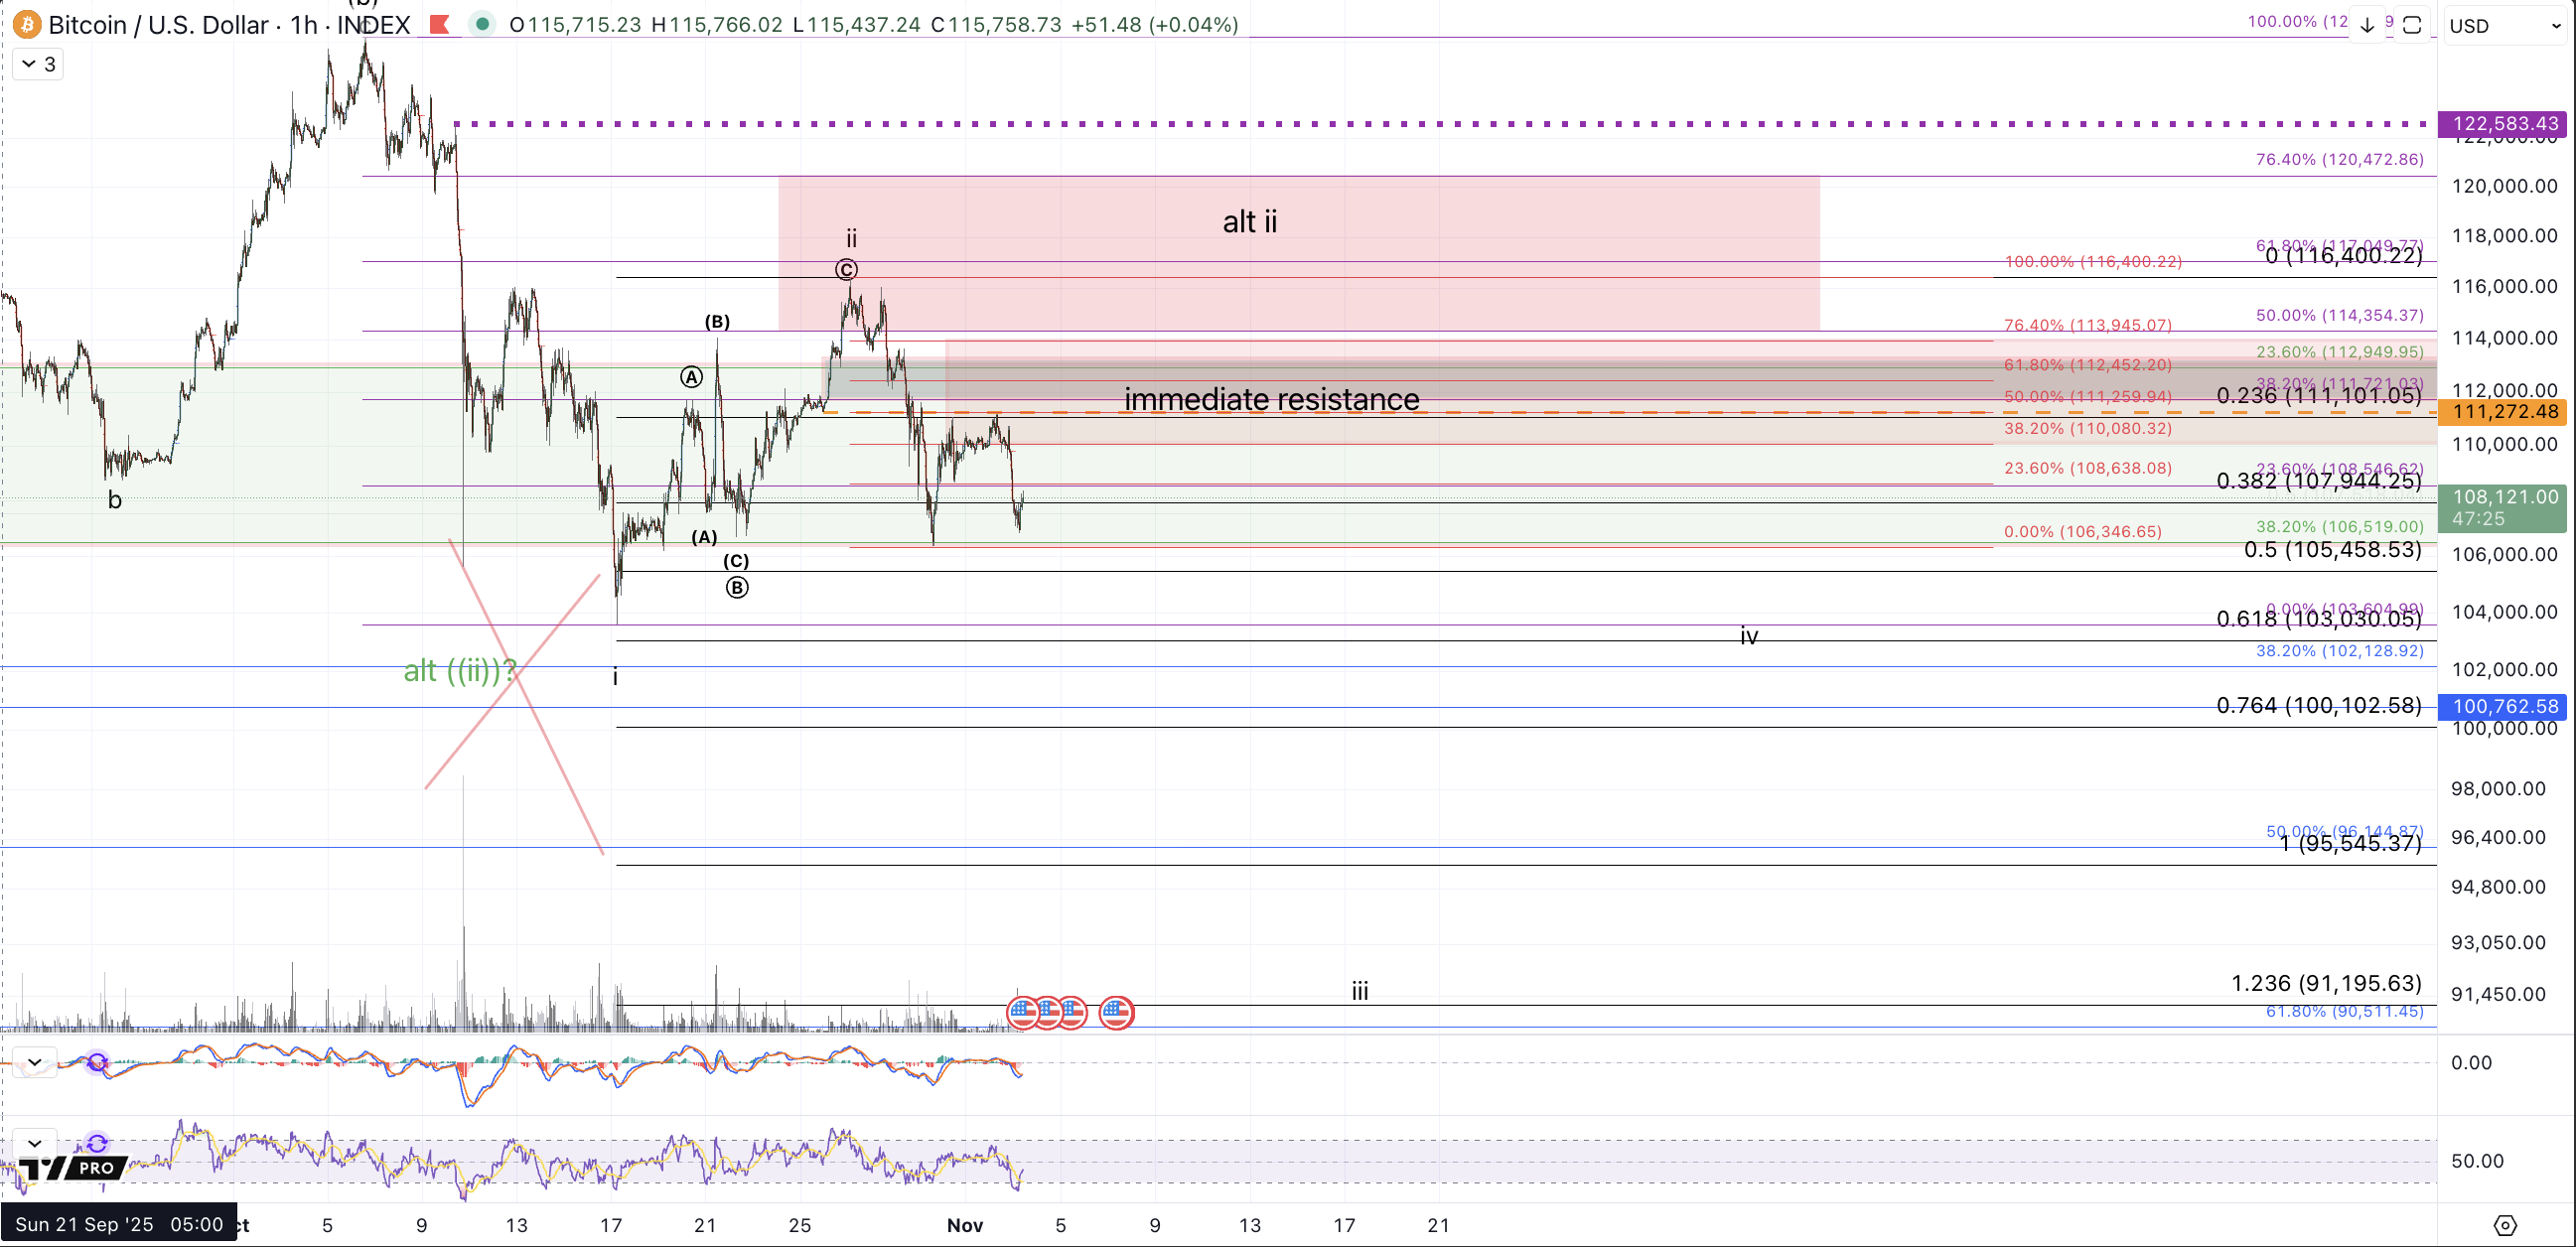
From the 10/20 article: "In the coming week[s] the key thing to watch for will be wave structure off the Friday 10/17 low. Should we see a micro impulsive 5 waves up develop, this action will strongly favor a completed a-b-c (or (a)-(b)-(c)) as per the purple/green counts. On the other hand, a corrective 3 wave bounce into this resistance or a move back below Friday's low will strongly favor the black/blue counts and expectations will favor continuation down to $85k-$100k."
Last week's decline from the high struck overnight on 10/27 has left price with a clearly corrective rally up from the 10/17 low and thus favors downside resolution into the larger bull market support in the $85k-$100k region. That said, Bitcoin has yet to develop a resounding break below the green box which ranges down to $106.5k. Price did briefly break below it on a shorter term capitulation type of move into the 10/17 low but for all intents and purposes this upper support can still be considered unbroken. And, as such, while the micro action continues to favor further downside as any upside struggles to get traction, the conditions for more immediate higher highs have still not been violated, which will require a sustained break of the upper support region and at this point a sustained break of the 10/17 low.
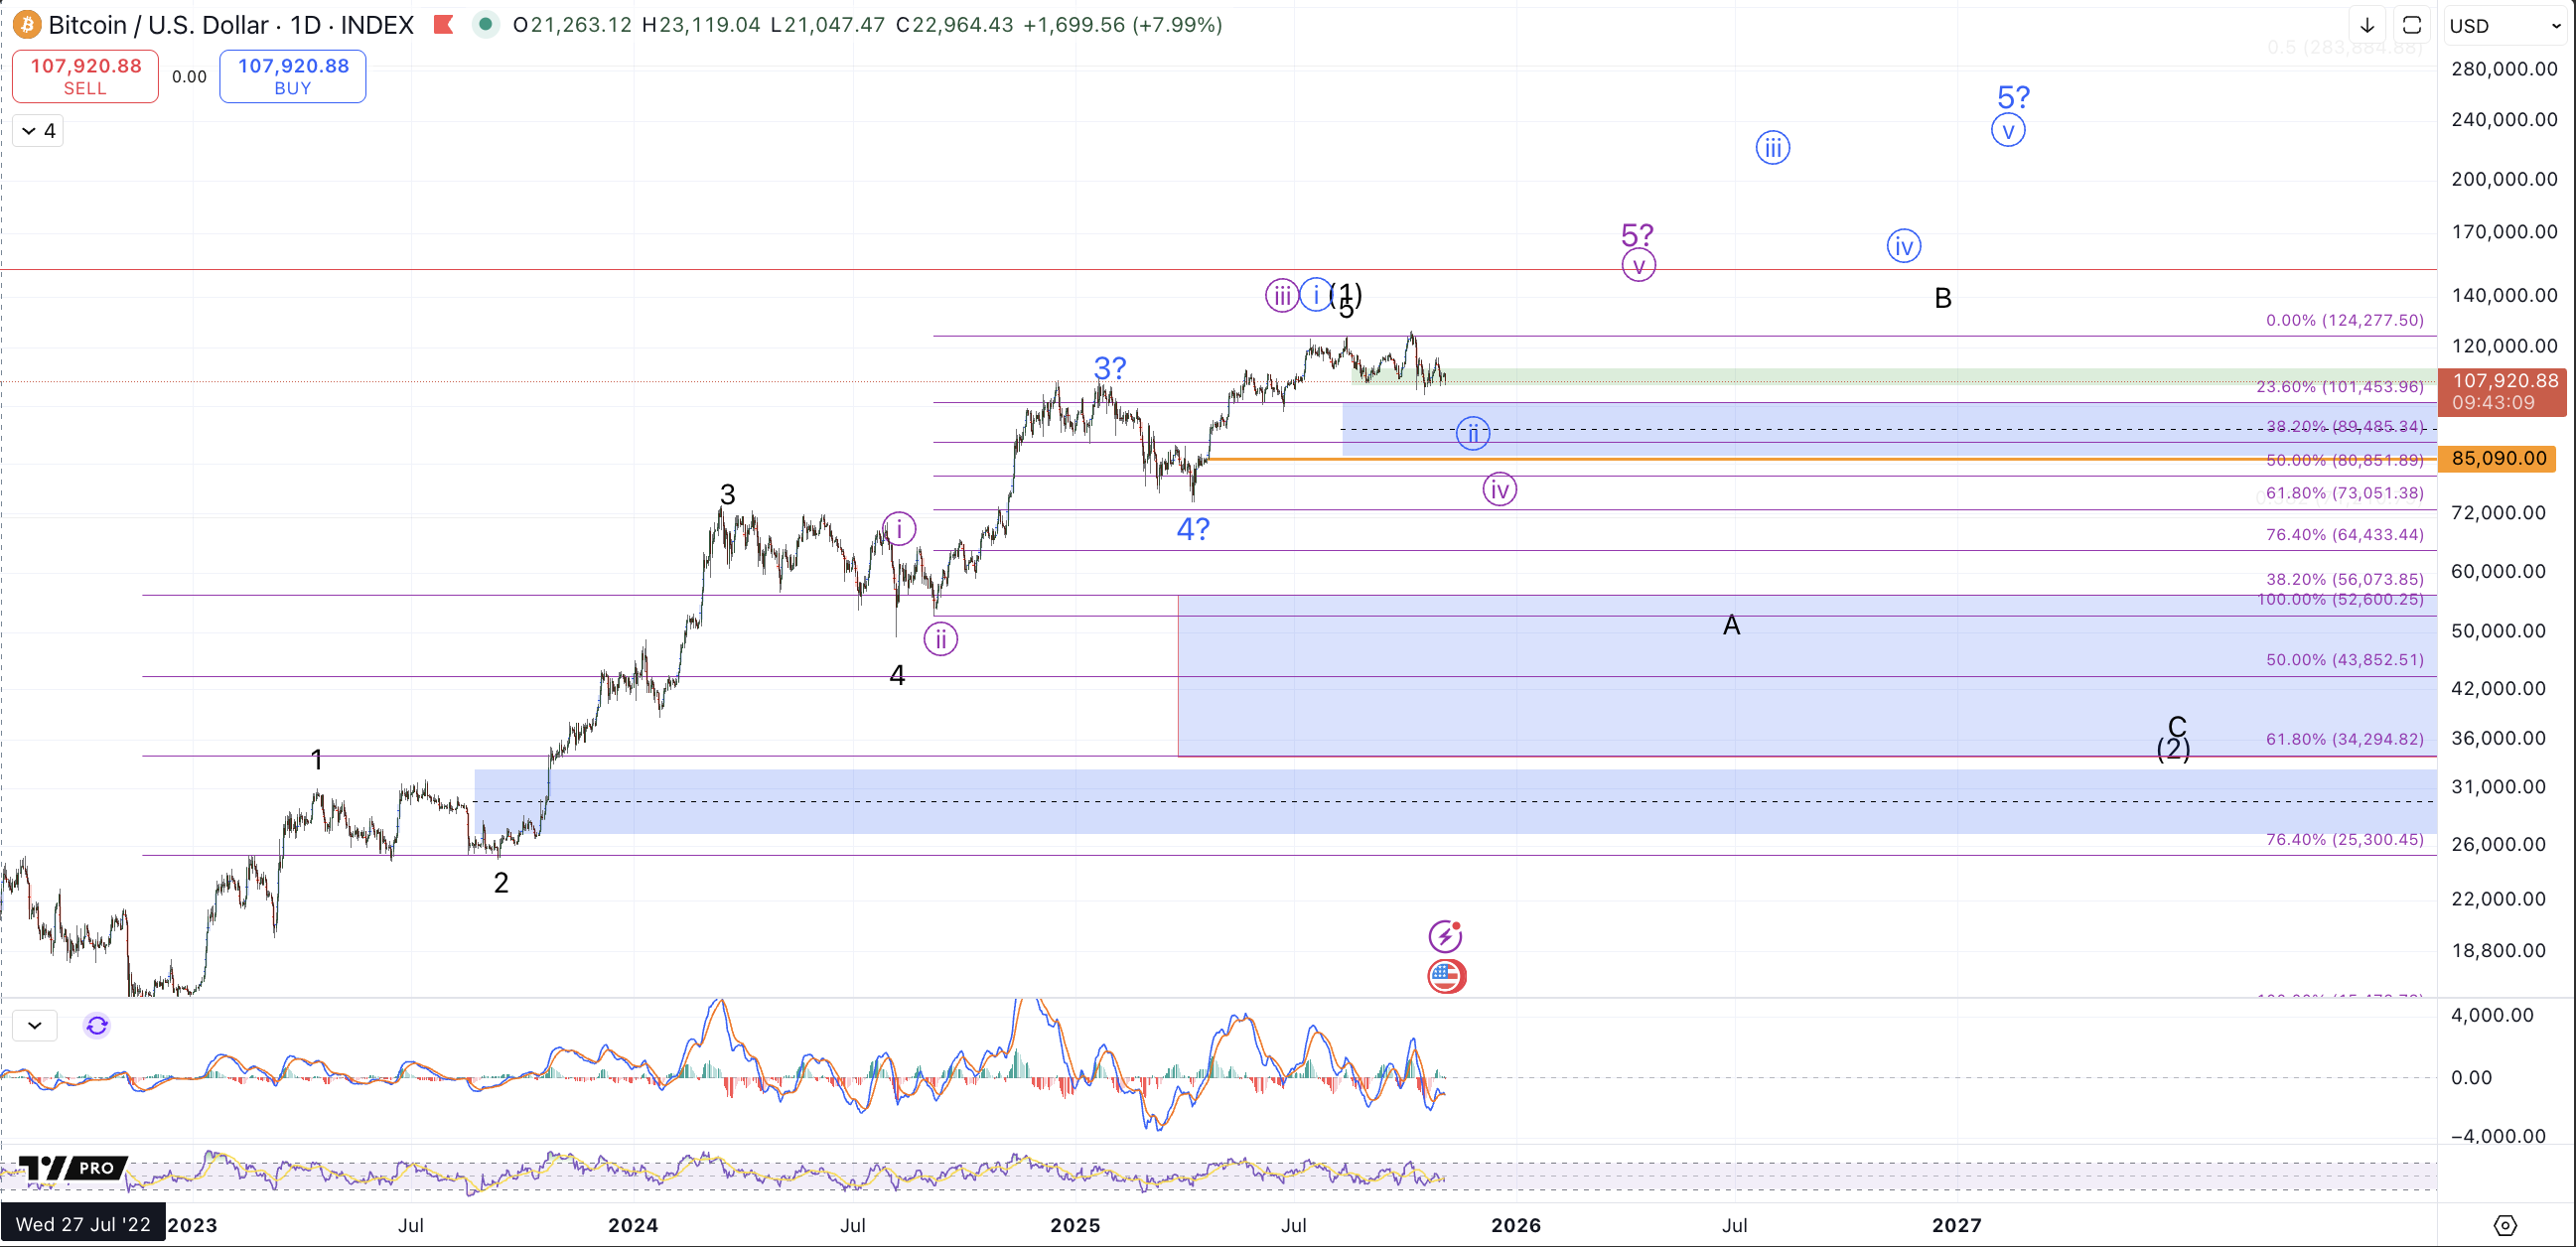
That said, I'm quite disinclined to maintain the green count on my chart which entails a potential bottom in wave circle ii but technical invalidation of it will require price to break back below the 10/17 low. For now I've crossed it off (shown on the 4h chart). The black and blue counts remain the same, ie, a bearish count (black) in which price has started a much larger bear market to at least significantly retrace the (potentially completed) rally from the 2022 low, and a bullish count (blue) where price is filling in a smaller degree wave circle ii retracing the rally from April low before heading up to $200k+.
With regard to the purple count, I'm going to re-consider this path somewhat. The 10/20 article considered a smaller degree wave (iv) pullback in the rally from the June low. However, the corrective action from the August high has become too large and protracted for me to maintain that version of the purple count. So instead, I'm considering a larger wave circle iv within the rally from the August 2024 low. Support for this prospect aligns with support for the blue circle ii and the black circle a wave down so there's no particular adjustment to make on smaller timeframes. The difference though is that purple entails an incompleteness to the rally from the 2022 low (like blue and unlike black) but unlike blue, this purple entails only one more minute wave circle v up to target $140k+ (depending on where it bottoms) whereas blue entails a circle iii-iv-v to take price well north of $200k. I'll note here that with respect to the new purple count, a break back below the April low would not technically invalidate the prospects for a higher high but any sustained break below $74k will more clearly favor completion of the bull market.
On the micro level, price has a reasonable i-ii in place to the downside and if the 10/27 high is left unbroken, this setup is targeting $82k-$85k, which would be a very deep pullback as a prospective wave circle ii in blue. Immediate resistance for downside continuation is $110k-$114k and so long as this is respected I favor price working its way down to $91k - $95k in wave iii of this ending diagonal (c) down. Alternatively should price break back above $114k it opens the door to a higher wave ii, which has upper resistance (noted last week) between $117k-$120k. A sustained break below the 10/17 low should finally take price down more strongly below $100k