Bitcoin: Finally Outside of the Consolidation Range!
 By
Jason Appel
By
Jason Appel
Bitcoin: Finally outside of the consolidation range!
For nearly 2 months following the November low, price remained stuck in consolidation between the November 21st spike low down to $80k and the initial corrective bounce high at $94k struck on 12/3. However, in this past week, price has finally gotten a sustained break above the upper bound of the region though I can hardly call the action resoundingly bullish. So despite the exclamation point in the title, there's little of interest to longer term Bitcoin investors in this update.
Our hint as to which direction the range would finally break was that price tested the 12/3 highs 3 times: on 12/9, 12/10, and 1/5, and though each of the previous instances got quick rejections down from slightly new highs, each subsequent pullback was unable to penetrate the $84k~ December low. Finally on 1/13, price zoomed through the previous highs and reached a short term top on 12/14 at $97.9k and has since consolidated above the aforementioned (previous) highs.
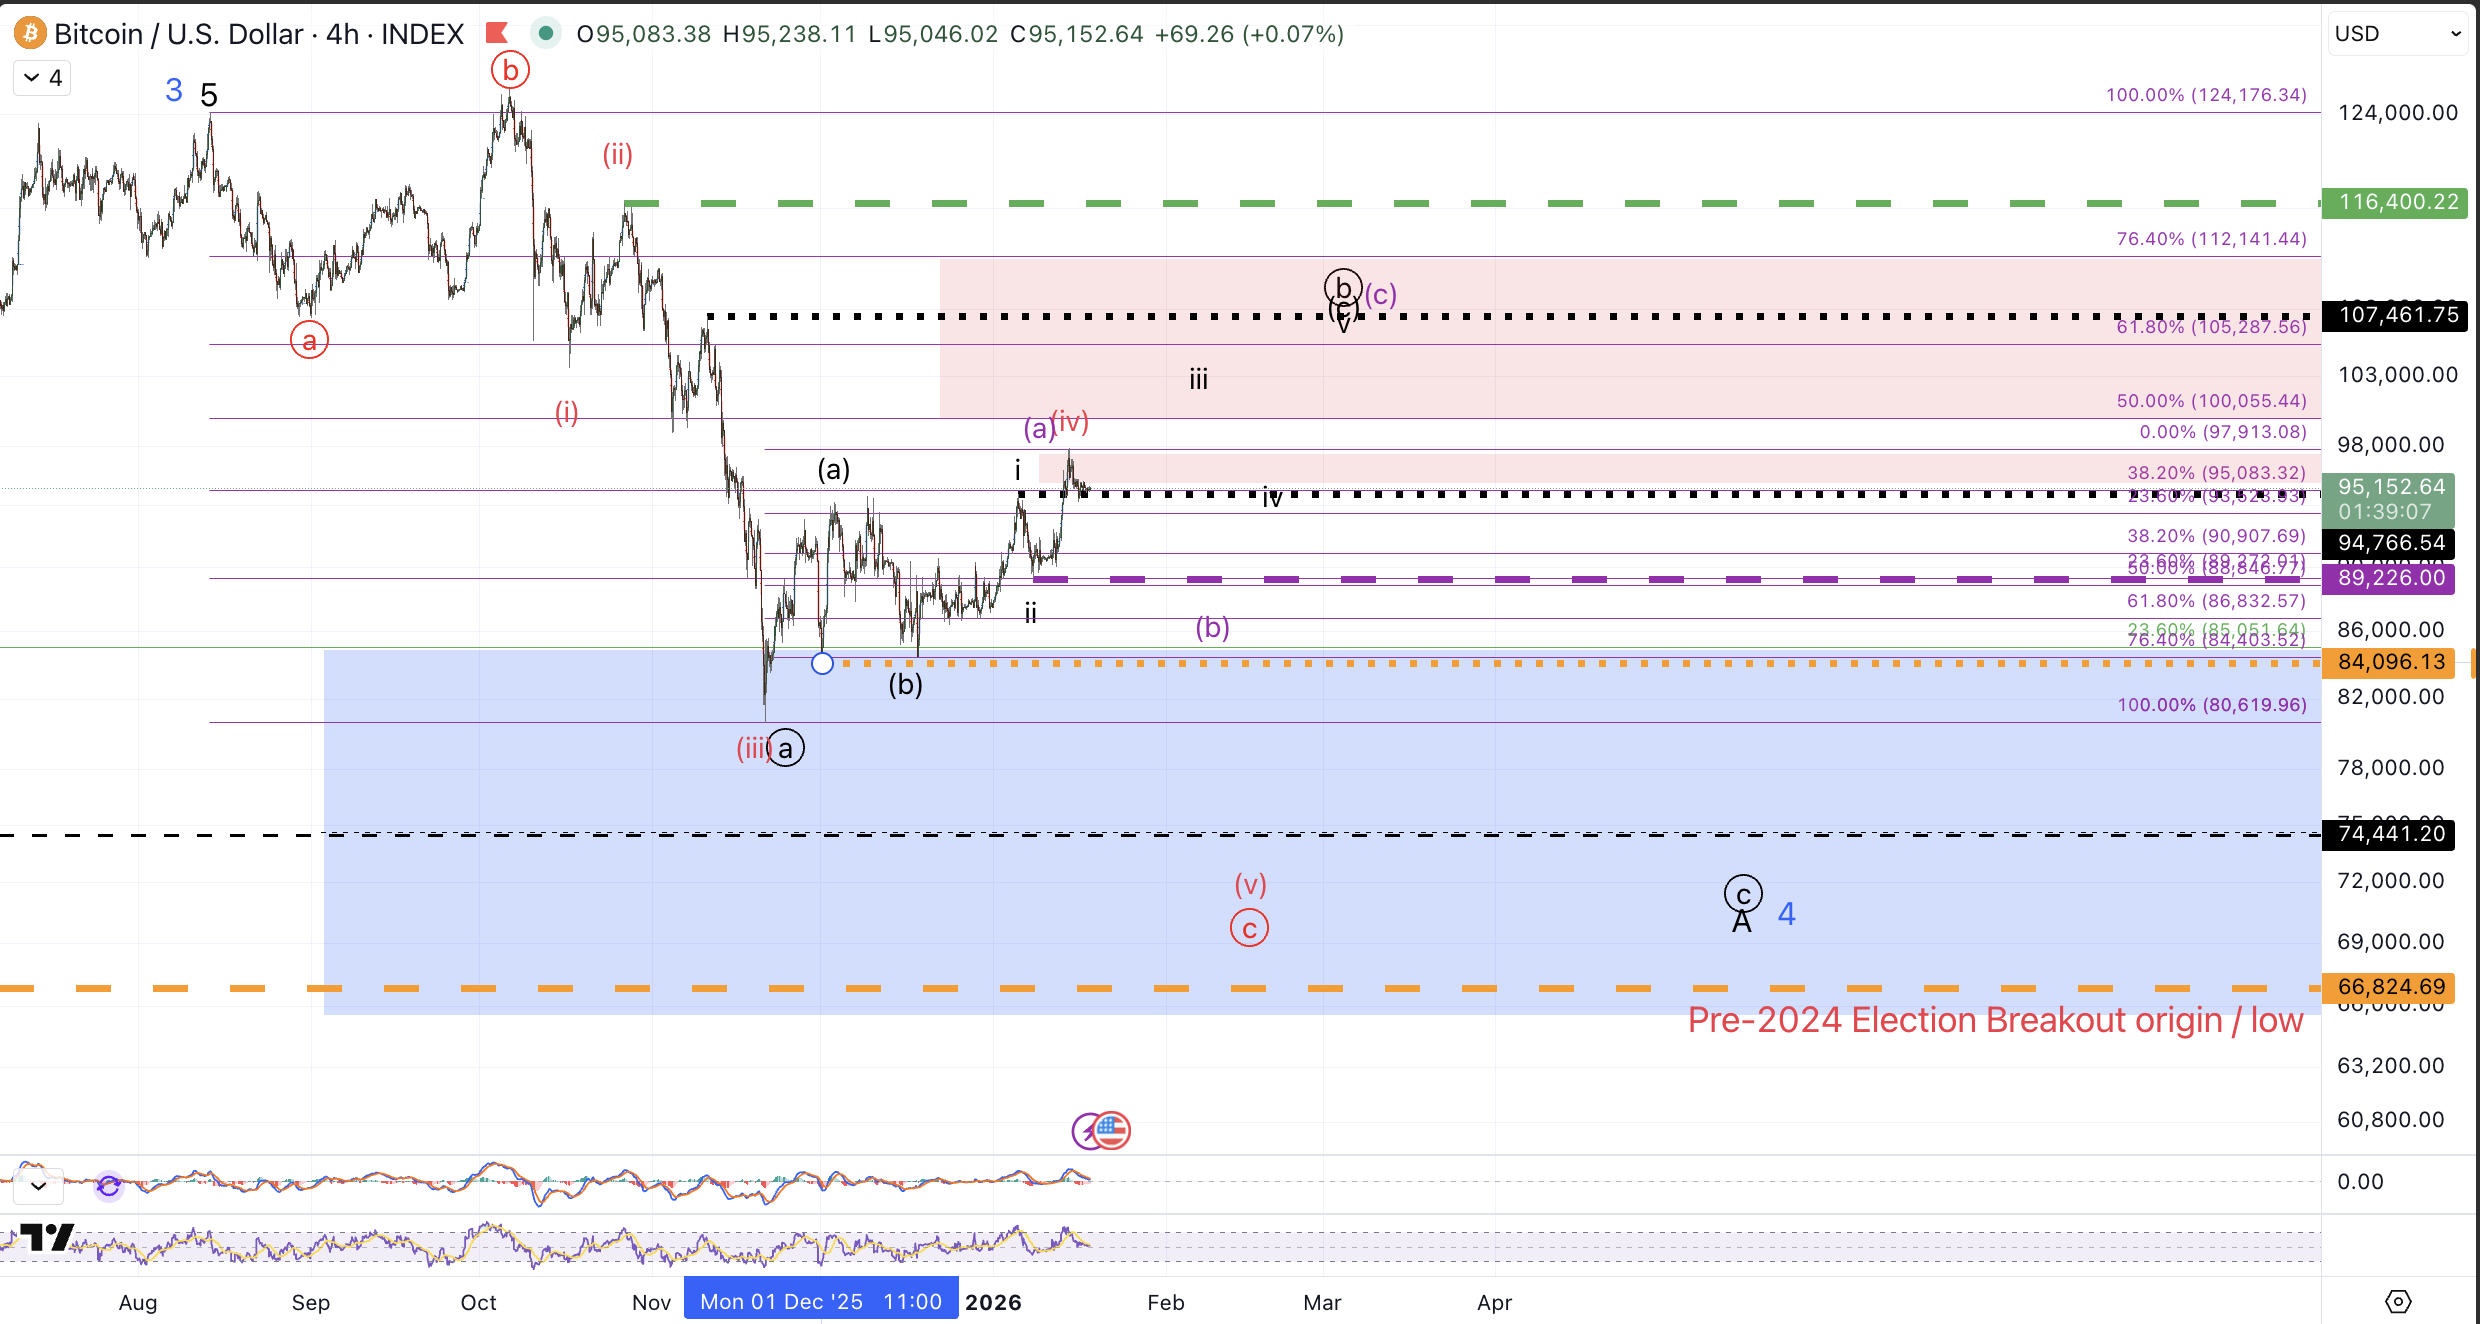
I was already hesitant to consider the bounce from the 11/21 low a wave (iv) due to the protracted consolidation getting too wide for a reasonable diagonal structure off the October highs and this break of the triangle consolidation posited in the most recent article further reduces those odds. As such, I'm leaving it on my chart in red as a lower probability immediately bearish alternative. And, in order to adopt this count as the primary perspective, I'll want to see a resounding breakdown back below $89k.
Given that the immediate decline in wave (v) is now perceived as an alternative path, what remains as the primary perspective? I favor price working on a bigger circle b wave off the 11/21 low which can ideally reach $107.5k before striking a top to this bounce. Fibonacci resistance for a circle b sits between $100k-$112k.
Within the framework of a circle b wave bounce, I have displayed two different subwave paths:
Black (preferred) entails a more direct move to fill in the (c) wave up from the 12/18 low. In order for this path to remain valid, Bitcoin will need to remain over $89,225, the 1/8 low.
Purple (alternative) entails a more circuitous path to $107.5k in which price comes back through the 1/8 low ($89.2k) but quickly rebounds after finding a (b) of circle b low above $84k.
Both of these perspectives are reasonable but the purple count is problematic in that it overlaps too strongly with the early stages of the suggested subwave path of the red count. So, if price makes a sustained break below $89k, a more immediate move down to retest the April 2025 low ($74k) and likely lower will become preferred. For the purple count to become operative, price should form a corrective decline and make a brief break below $89k followed by a quick recovery.
All that said, let's come back to the first paragraph: "...price has finally gotten a sustained break above the upper bound of the region though I can hardly call the action resoundingly bullish." Even though the immediate decline scenario has been relegated to alternative status, the bounce from the 11/21 low remains very corrective and below resistance. Unless Bitcoin can resoundingly break above the late October high, $116.4k on a sustained basis, the expectation remains for price to retest the April 2025 low prior to any new all-time highs being reached.
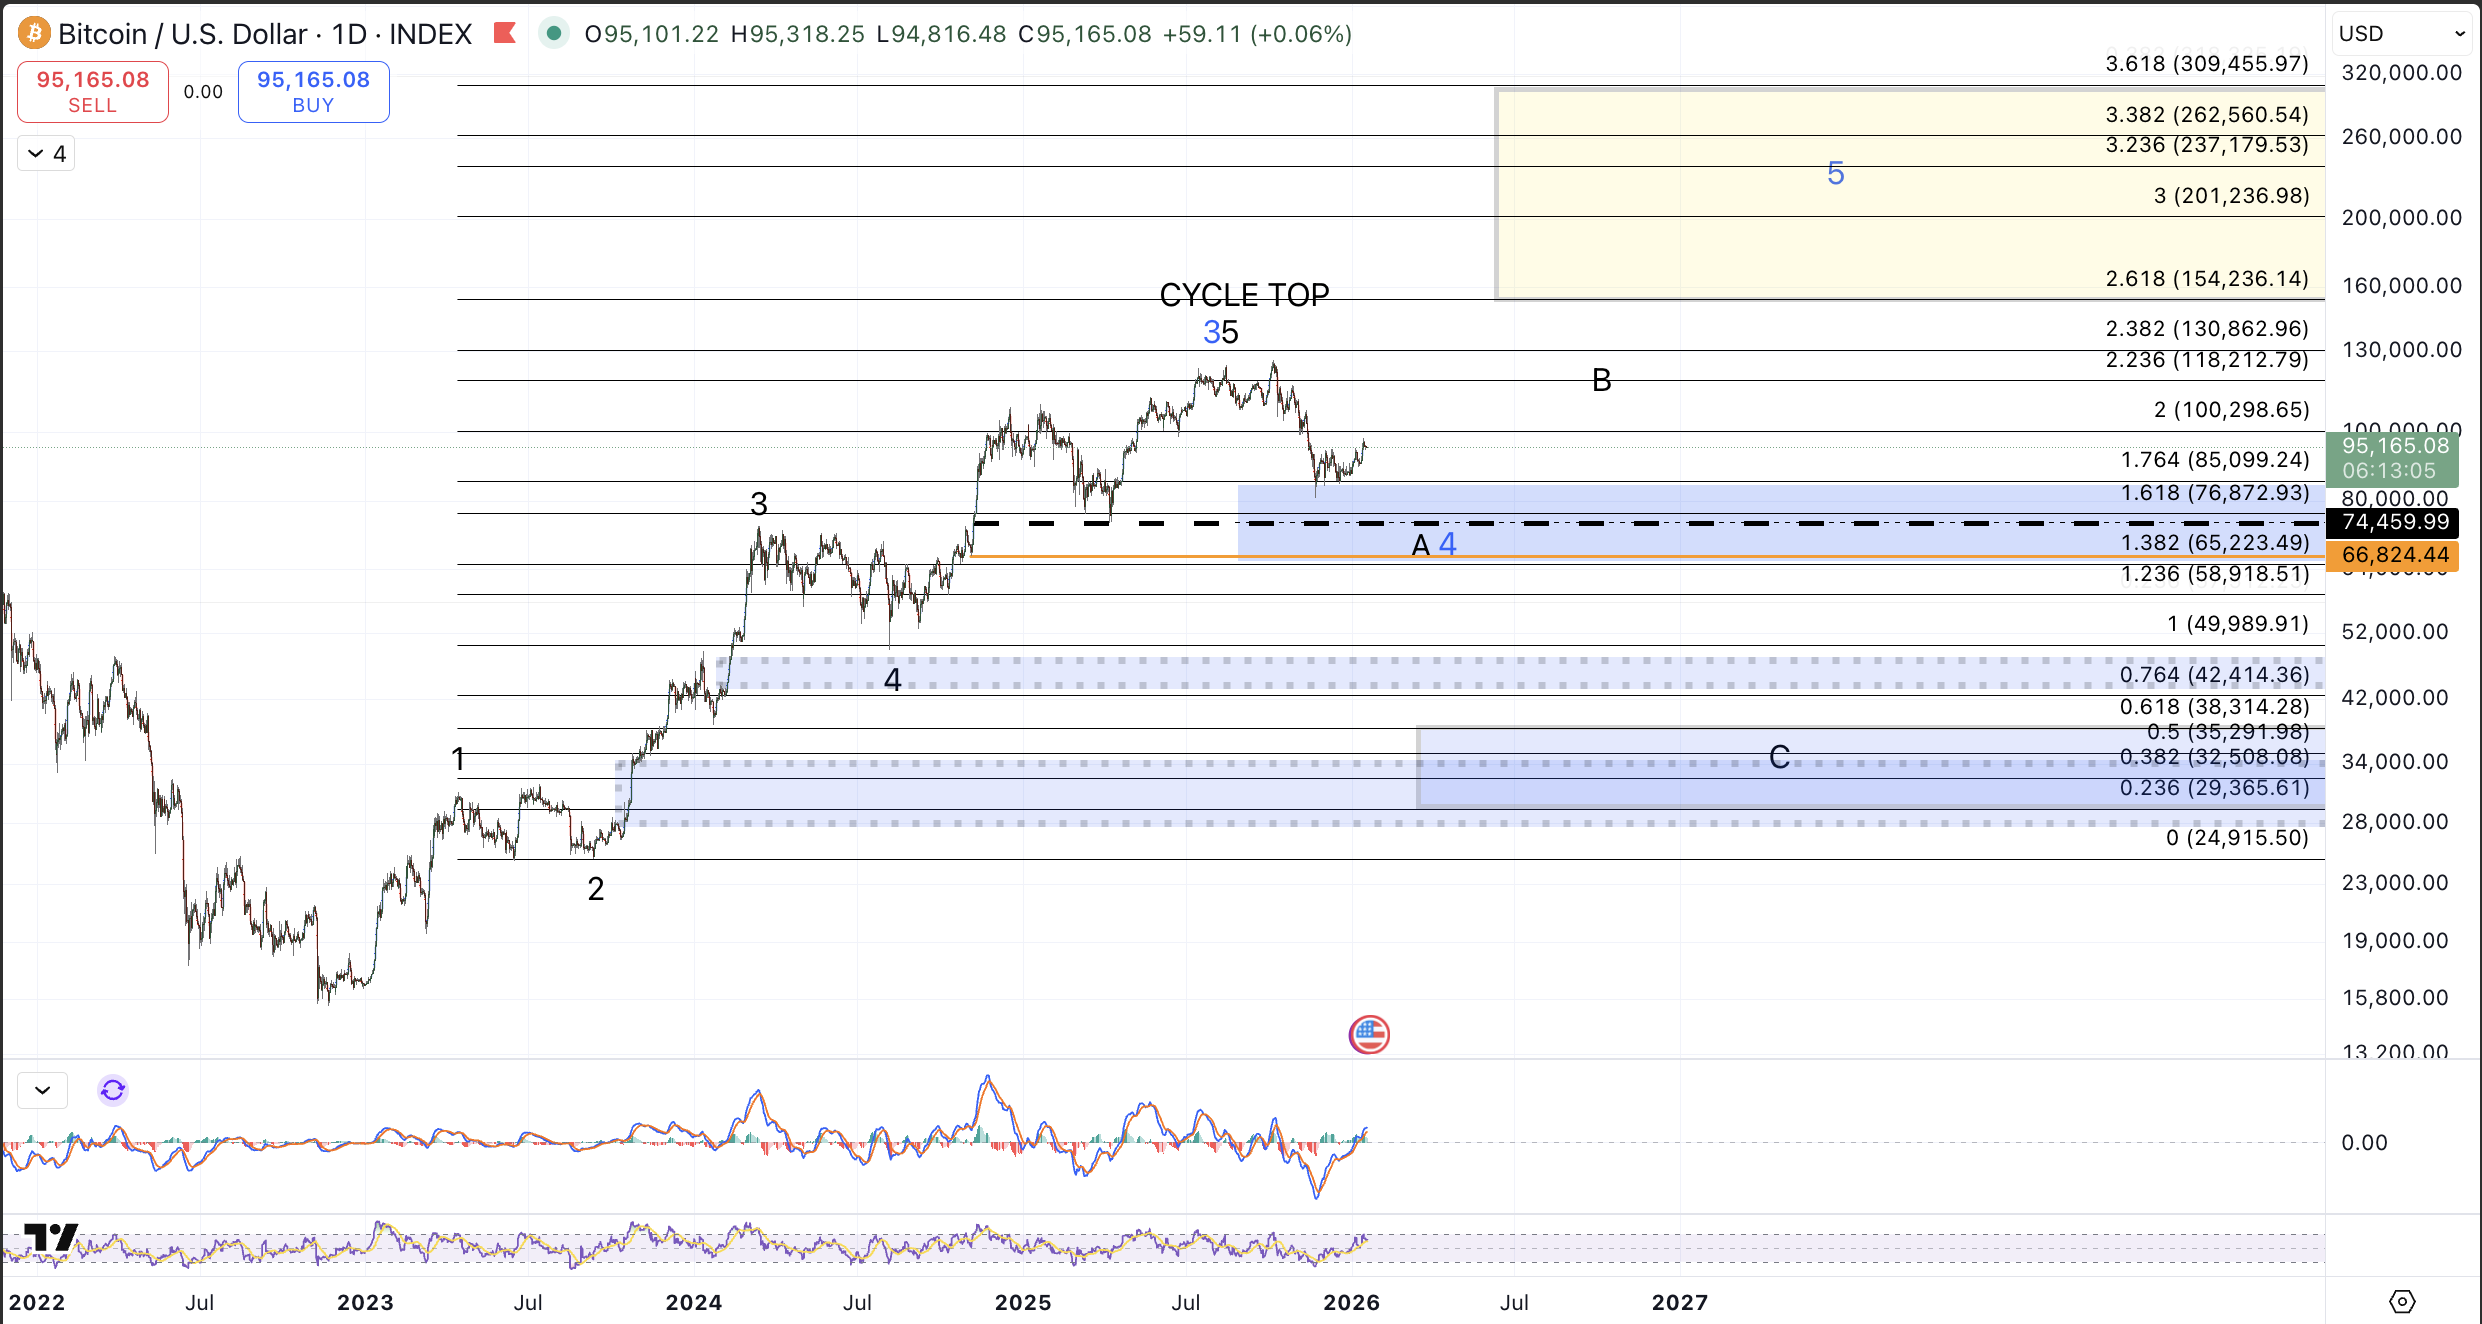
Any subsequent breakdown, whether direct as per the red count, or indirect as per the black count, should refrain from sustained trading below $66.8k in order to keep alive the prospects of new highs in the cycle from the 2022 low as suggested by the blue count on the Daily chart. To be sure, I'm still treating that count as the alternative but consider it relatively even with the larger degree black count which suggests a cycle top in place and price retracing the rally from the 2022 low at a minimum.