Bitcoin: Corrective Bounce or Something More, Pt2.
 By
Jason Appel
By
Jason Appel
Bitcoin: Corrective Bounce or Something More, Pt2.
Last week's title, Bitcoin: Corrective Bounce or Something More? may have been a bit premature as this is the very same question we have this week. However, the micro analysis provided a near perfect forecast of the actual price action:
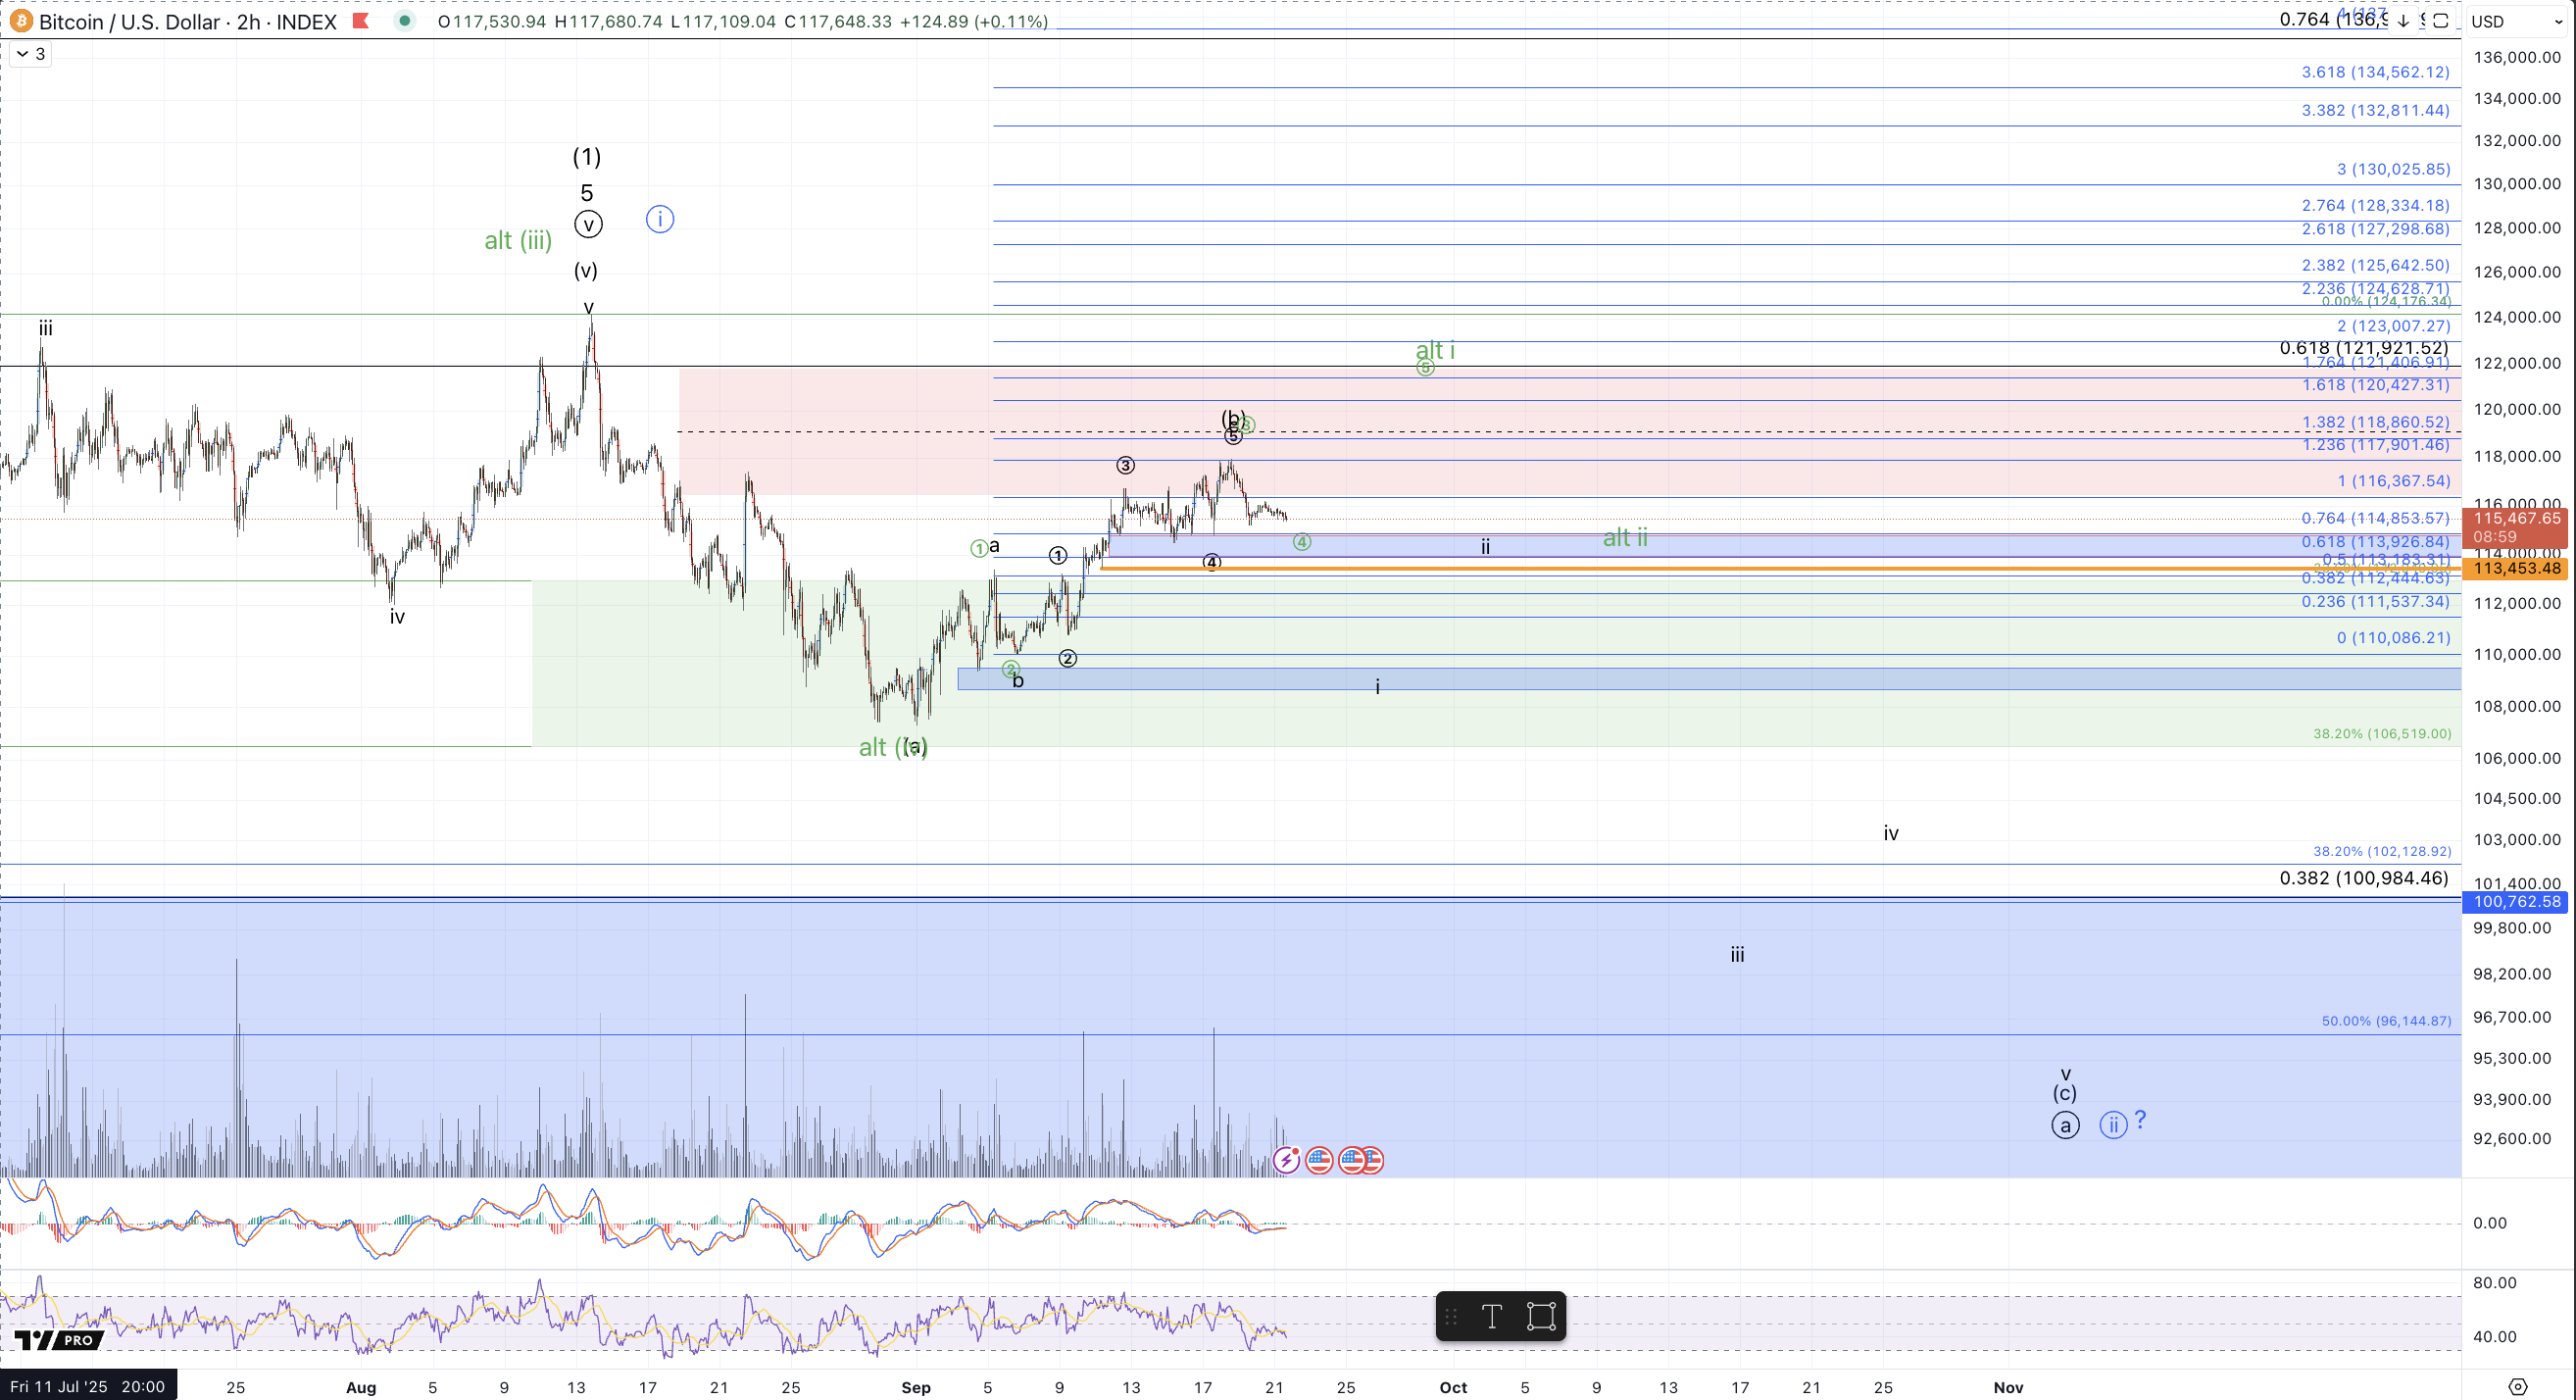
Overall price appears to be following last week's (9/7 article) lower timeframe black path: "... another swing higher for a wider flat off the September low to fill in a more substantial (b) wave which can ideally test the $117k-$120k region and complete the corrective bounce in that region." Since last week, Bitcoin has filled in waves circle 1-2-3 of the c of (b) higher in a manner that has confluence with the expectation for all of c to reach the $117k-$120k region. Micro support for the wave circle 4 of c is $113.9k-$114.9k and supposing this region contains any immediate declines, the expected path is for another high to fill in 5 waves of the c wave which appears on target for $118k based on the subwaves of c.
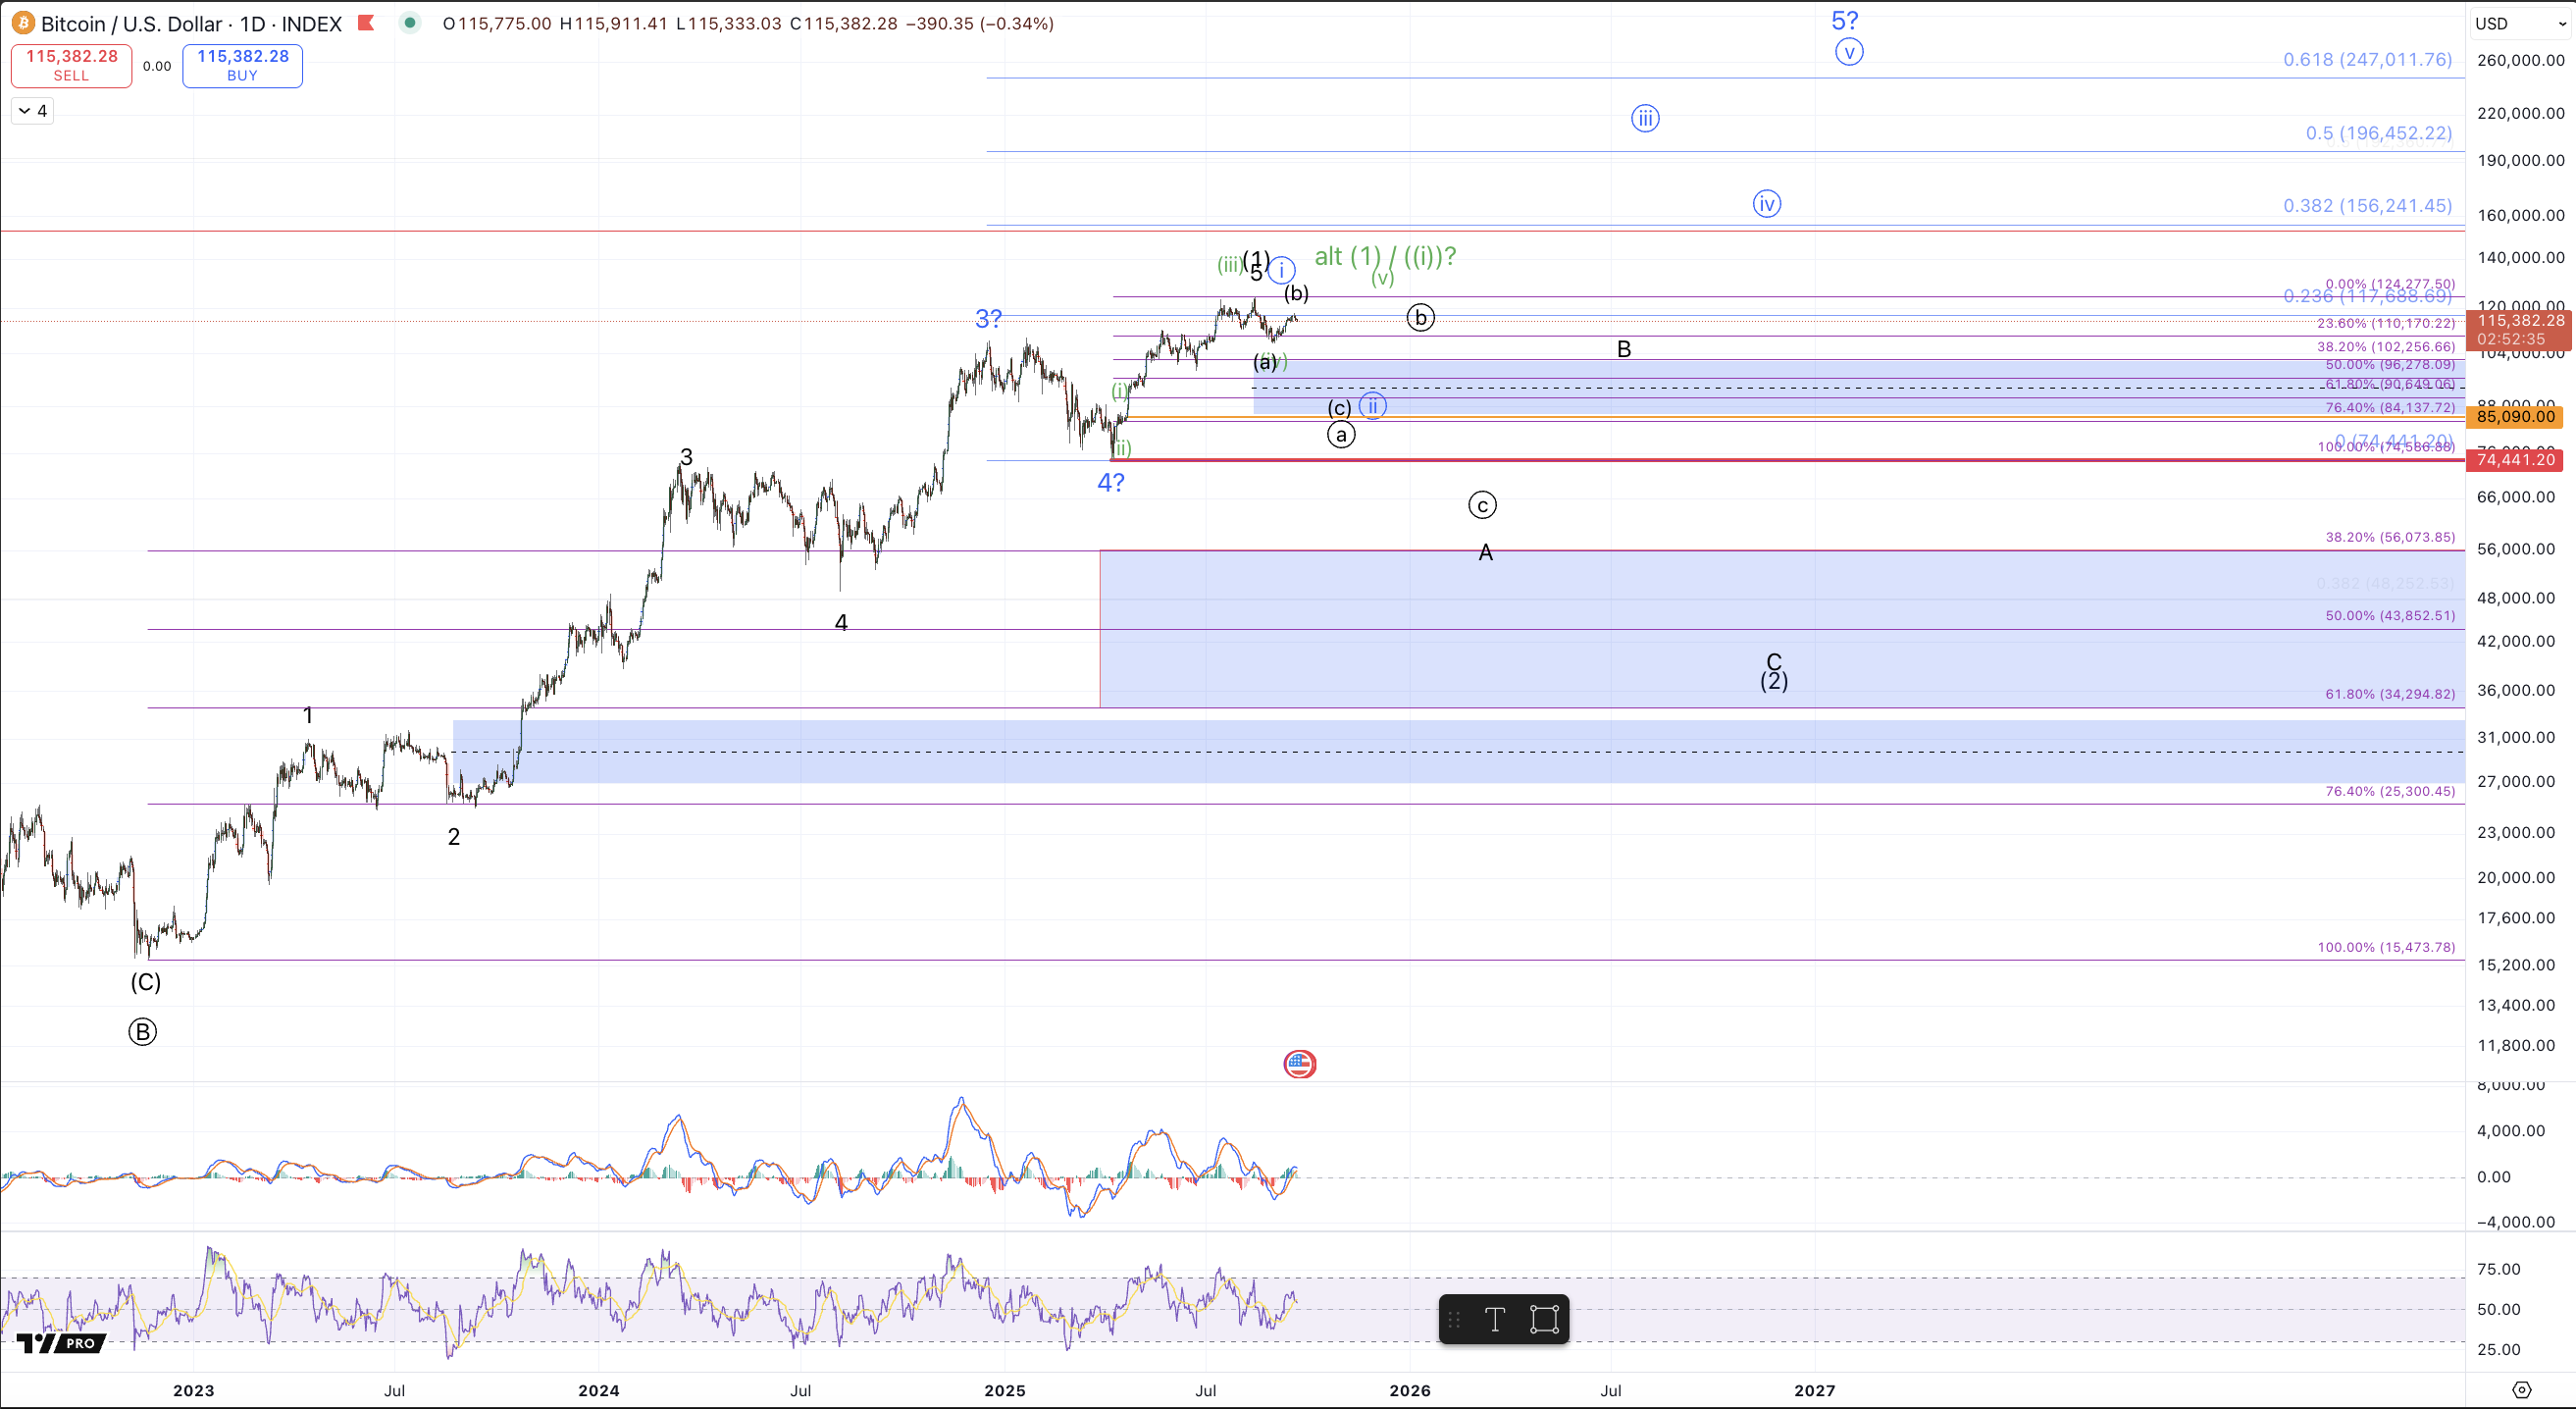
Price reached a high this past week on Thursday, 9/18, striking $117,966 before turning down in a steady decline. Over the next few weeks, the primary expectations are for another downside leg to develop and bring price down under $100k. This accords with both the black and blue counts on smaller timeframes in which price is minimally filling in a wave circle ii pullback for a larger 5 wave structure from the April low targeting $200k+, ie, the blue path.
All of the shorter timeframe action continues to accord with the primary expectations. However, the manner in which price has moved has not yet ruled out the green count. So, while that green path - for a more immediate run to a new all-time high ideally targeting the $130k-$150k region - is not the primary forecast, it very much remains in contention. Given all of the above, this current decline from Thursday's $118k~ high, is now key for determining at least the next few weeks of action and potentially much more.
If the green count is going to take the lead in favor, Bitcoin will need to develop a 5 wave move from the September low. That prospect still remains reasonable with price holding the micro support region within this rally from the September low. Wave circle 4 of i support within the green count is $113.9k-$114.9k. Until that's resoundingly broken with a sustained break below $113.4k (to make much less likely) and then below $110k, (to invalidate) the green count remains live. Instead, should price hold support and push up past $120k, that will yield 5 waves up at which point the green count becomes primary and pullbacks can be viewed as shorter term buying opportunities.
Preferred action for the coming week entails downside continuation in impulsive fashion that ideally fils in a micro 5 wave decline through $110k. Such a move would resoundingly favor the (already) primary perspective that this bounce in September is corrective and price will decline into the bull market support zone, $85k-$100k, before making a new high.
I'll conclude with the final portions of last week's analysis with a snippet as well from the 9/7 article:
From 9/14: "Assuming price follows the favored path, ie, develops a (b) wave top in the coming week and then breaks down back below $110k we should finally get a test of $85k-$102k region which remains the larger crucial support for continuation of the bull cycle from the 2022 low. As a reminder, the blue path showing the prospect of a more direct run to $200k+ remains valid so long as price is over the April low, $74.4k, but for all intents and purposes, no sustained break below $85k should develop for the blue count to remain in reasonable contention."
From 9/7: "As always, we'll take things one step at a time. And as a reminder, nothing is broken yet but price did satisfy expectations set out in 2022 for price to reach $125k in this cycle. While that was technically not achieved, the rally did come close enough with the hit of $124.2k in August.
The best prospects for continuation higher would be for price to follow the shorter term path shown with the (a)-(b)-(c) to test the key support region, $85k-$102k and then to find a low there and rally impulsively. Should we see that type of action develop in the coming weeks, I will become quite bullish in favor of the larger blue count. But in the current view, I'm treating the shorter term view with a risk averse stance"