Bitcoin: Breakdown! - Market Analysis for Feb 1st, 2026
 By
Jason Appel
By
Jason Appel
Bitcoin: Breakdown!
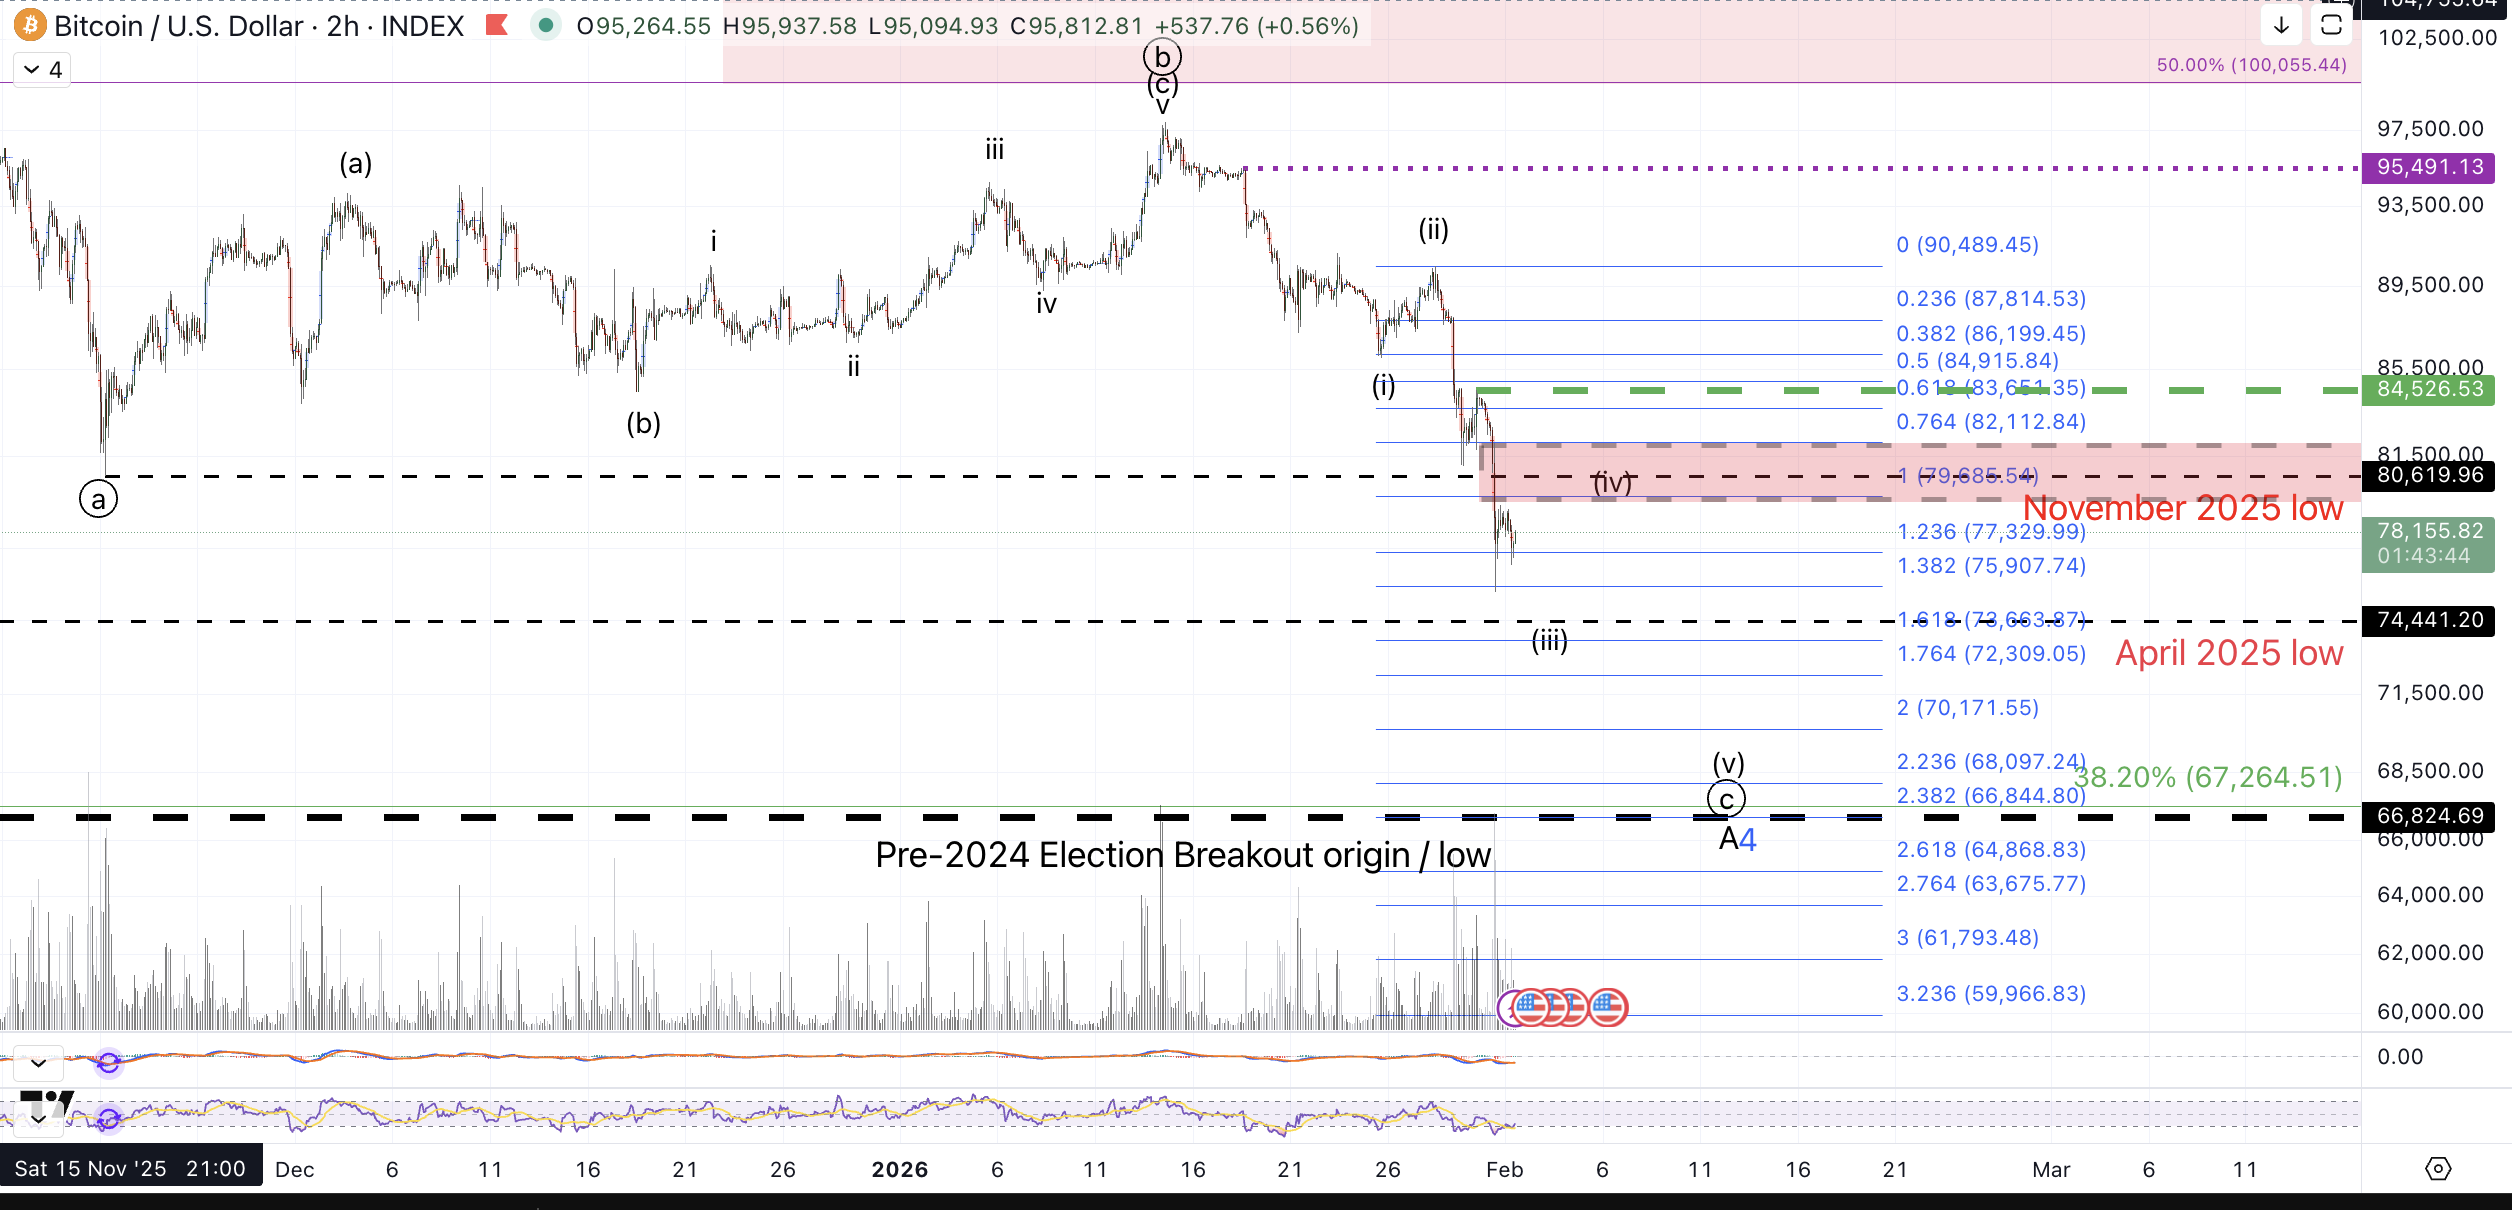
Bitcoin wasted little time this week moving lower. As discussed last week; after the nearly 8 week consolidation, price poked above in mid-January and was swiftly rejected and now is taking the most direct path lower. As of writing this article, the November low has been resoundingly broken on a sustained basis but price has yet to test $74.4k, the April 2025 low which is the next downside target.
Last week we entertained a few different prospective bounces that would shape a more circuitous path down to retesting the November 2025 low and below but none of these materialized and instead we're seeing the most direct move down to the $67k-$74k region that's been considered THE TARGET for this drop off the October 2025 high for some time now.
The drop from the mid January high appears impulsive which works as a circle c wave down and thus the wide consolidation into that 1/14 high can be counted as a circle b wave which makes sense of the very protracted (in time) consolidation which was problematic as a wave (iv) in the previous interpretation.
Considering an impulse down, we have some clear parameters for resistance. The micro count's (i)-(ii) down suggests a target of the $66k-$72k region aligns reasonably well with the $67k-$74k that's been forecasted based upon the larger degree. I'm particularly focused on the lower end of that region and even a bit below it as it has a confluence of important Fibonacci and liquidity levels:
The green line (38.2%) is the .382 retrace of the entire move from the September 2023 low to the August 2025 high which counts as the minor wave 3 in the blue count. This is key support for a prospective wave 4 in the more bullish blue count and while a bit of overthrow due to slippage or otherwise is acceptable, a sustained or resounding break below this level will further reduce odds of the blue count.
The thick black dashed line, $66,825~ is the November 2024 low and the last local nadir prior to the breakout that transpired immediately following the 2024 US Presidential election. I would not be surprised whatsoever to see this level retested.
Right now the micro progression off the 1/14 high is suggestive that price will test beyond the 2.0 extension of the (i)-(ii) down which adds further weight to a test of the $67k~ confluence region. Micro resistance for downside continuation is $79.6k-$82.1k.
So long as this region is not breached, my more immediate expectations are for a test of the April low at $74.4k. The ideal path then entails a bounce from $70k-$74k back up to resistance followed by one more low down to the aforementioned targets in the $67k region. That said, often times corrective c waves complete with a climax in what appears to be the third wave down where and price just drops directly to the wave (v) targets without a clearly discernible 4th wave. While I'm not predicting that per se, it would not surprise me to see that develop in the next 48 hours.
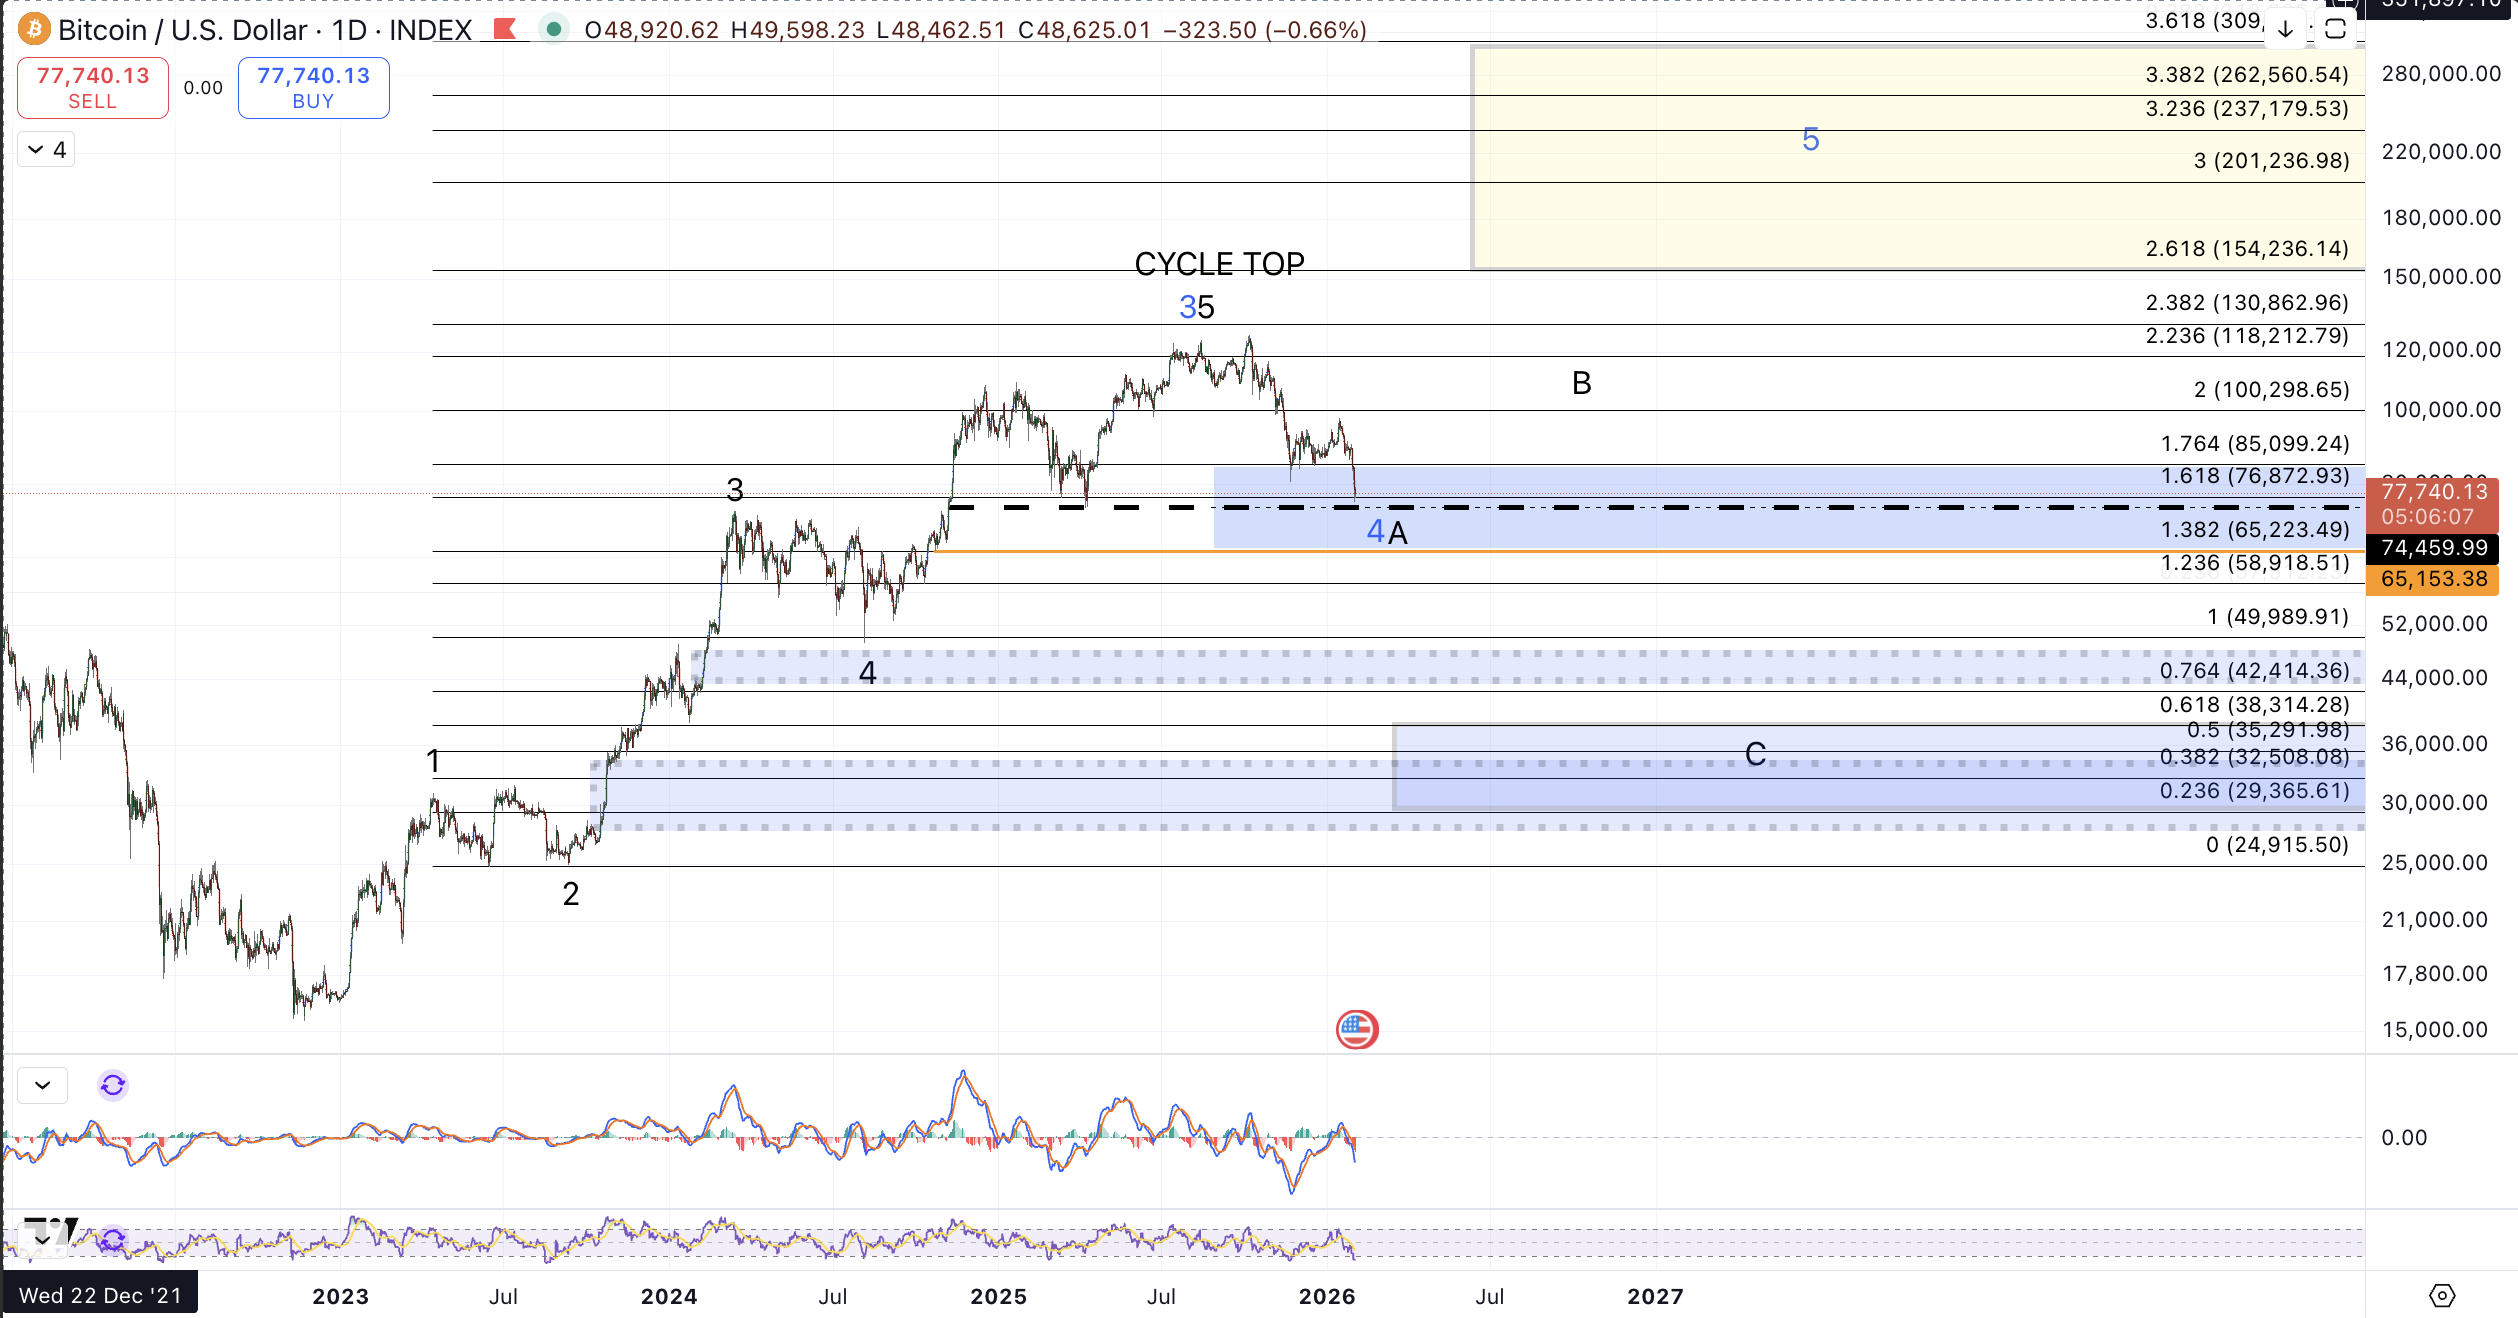
Regarding the daily chart:
For several months, the difference between the blue and black counts has been highly hypothetical to longer term players but this breakdown has accelerated this distinction. Please note what was discussed at length in the Autumn 2025 updates: that price fulfilled the forecast from the 2022 low given that it formed a clear 5 wave rally and reached the $125k target. As such, the blue count can be considered a potential "bonus" for another extension in the cycle from 2022. In order for the blue count to remain a reasonable prospect price must hold the $65k region. Any sustained or large break below it will be further evidence favoring the bear market in which we can reasonably see much lower levels with the August 2024 low around $50k e.g. as the next target.
As a bit of an aside from the technical talk: I was at a Bitcoin meetup this past summer after Bitcoin had crossed back above the May high exceeding $110k but it had not yet struck its high. Most of the attendees explained that the development of non-Crypto companies adopting Bitcoin as a treasury reserve asset would be very bullish for many months to come, providing a consistent bid for price. As such not a single person I met there entertained the possibility of a retest of the April 2025 low.
I don't in particular speculate on these Bitcoin treasury companies but I would not be surprised to see some large Bitcoin liquidations among weaker hands who may have been a bit more tentative about adopting Bitcoin as a treasury reserve asset. In particular, it will be interesting to see if those companies that "were later to the party," so to speak, will be inclined to get out as they are likely currently sustaining some larger unrealized losses in USD terms.
My forecast from here is to see some form of larger bounce develop from the $65k-$70k region. Even in the black count, a bounce back up to $100-$110k is reasonable. However, until we see some resistance break, any form of leveraged long is very risky and at a minimum, quite premature. For those looking to add more unleveraged exposure at cheaper levels, the $67k region represents a decent opportunity.
I'll be watching for a potential bottom to develop in the coming days and weeks and should we see a micro 5 wave rally through resistance originating from a complete 5 down in the circle c wave that does not sustain a break below $65k, that would be a good sign for the blue count.