Bitcoin: Back Under $100k? Check! But If You Blinked You May Have Missed It
 By
Jason Appel
By
Jason Appel
Bitcoin: Back under $100k? Check! But if you blinked you may have missed it.
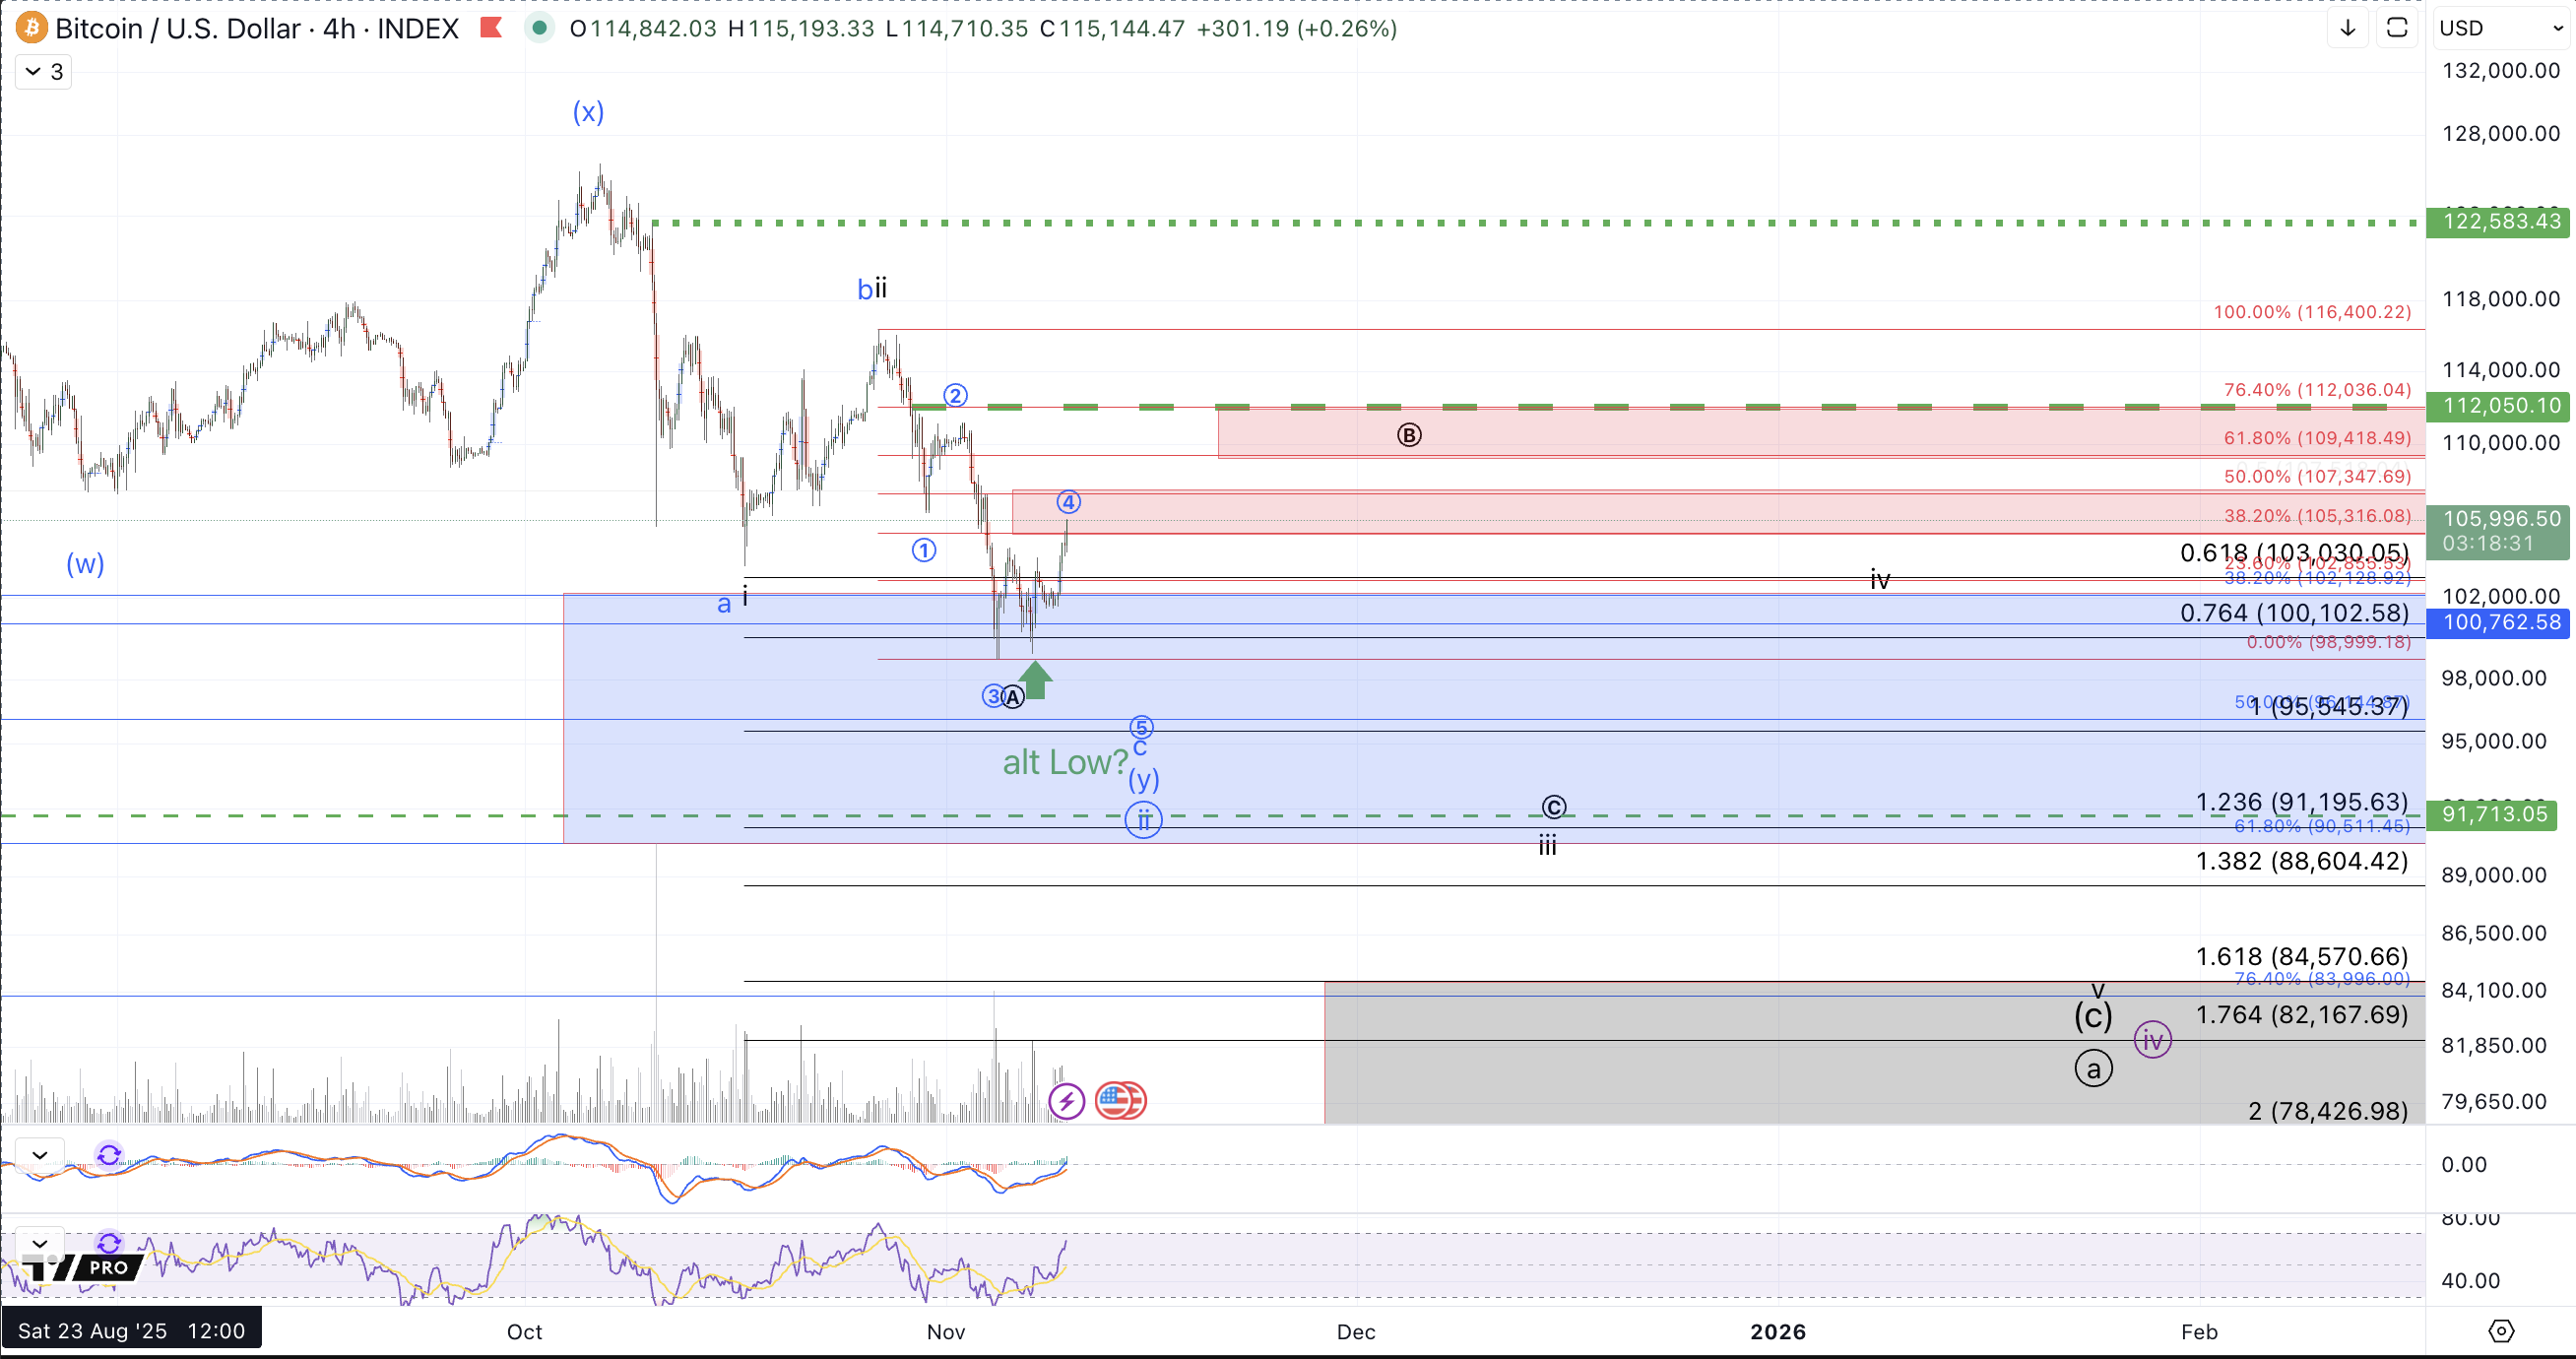
In last week's 11/3 article I posited expectations for Bitcoin to decline under $100k. At the time, price was trading at roughly $108k, so it was hardly an outlandish call but the nearer term forecast laid out in the analysis was fulfilled in the past week with price following through to the downside and reaching a low on Tuesday in the $98.9k region. The subsequent bounce also fits with the displayed path (in black on the 4hour chart) of a larger ending diagonal developing down from the October high
Though not shown in detail in last week's micro chart (screenshot below) the wave iii targeting the 1.236 downside extension of the initial i-ii entails an ending diagonal in which it's typical to see the A of iii tag the .764 extension before getting a corrective bounce to resistance in B of iii followed by a C of iii down to the noted 1.236 extension target, ie. $91k~ in this case. This nicely coincides with price action thus far. As shown on this week's charts, that resistance region for this decline is $105k-$112k and as of writing this article, price has met the minimal bounce expectations for the circle B wave. I'll note though that B waves are the most variable structure within Elliott Wave Analysis and as such while I would prefer a more protracted corrective rally as suggested by the chart I can't rule out more direct downside extension, should we see Bitcoin's price rejected from the current region, $105.3k-$107.4k.
Should such a decline develop from here taking price down below $95k, we're left with a bit of a tossup between a completed a-b-c down from the October high as shown in blue or just a completed iii of a bigger wave (c) with one more iv-v to come as shown in black. We'll closely observe the micro structure should such a more transpire this week. Anyhow, what's suggested in blue entails an irregular correction which I'm disinclined from considering strongly in advance in any other asset class, but Crypto has a strong tendency to fill in corrections in this more "exotic" w-x-y fashion as suggested in blue.
From last week: Also, with respect to what was noted last week: On the micro level, price has a reasonable i-ii in place to the downside and if the 10/27 high is left unbroken, this setup is targeting $82k-$85k, which would be a very deep pullback as a prospective wave circle ii in blue.
As such, we now theoretically have more distinct subwave paths for the decline to distinguish the blue count from black/purple counts. That is, if this is a wave circle ii pullback of a larger circle i-ii from the April low, I'd expect price to hold the $90k support. However, should price fill in a larger pullback down to $82k-$85k as suggested by the black ending diagonal path on the 4h chart, that can function as a circle a in the more bearish black count or all of a wave circle iv in the purple count.
Lastly, though I have no confident way of counting a complete correction, I'll note that Bitcoin (in the spirit of its tendency for WXYs) often does not fully satisfy expectations for a complete correction from a wave structure standpoint. So, while I think it's quite speculative to consider the correction complete (in the current stance), if BTC moves resoundingly back above $112k I'll be forced to consider this perspective more realistically. It's currently noted in green on the 4hr chart.
A short review of the differing counts:
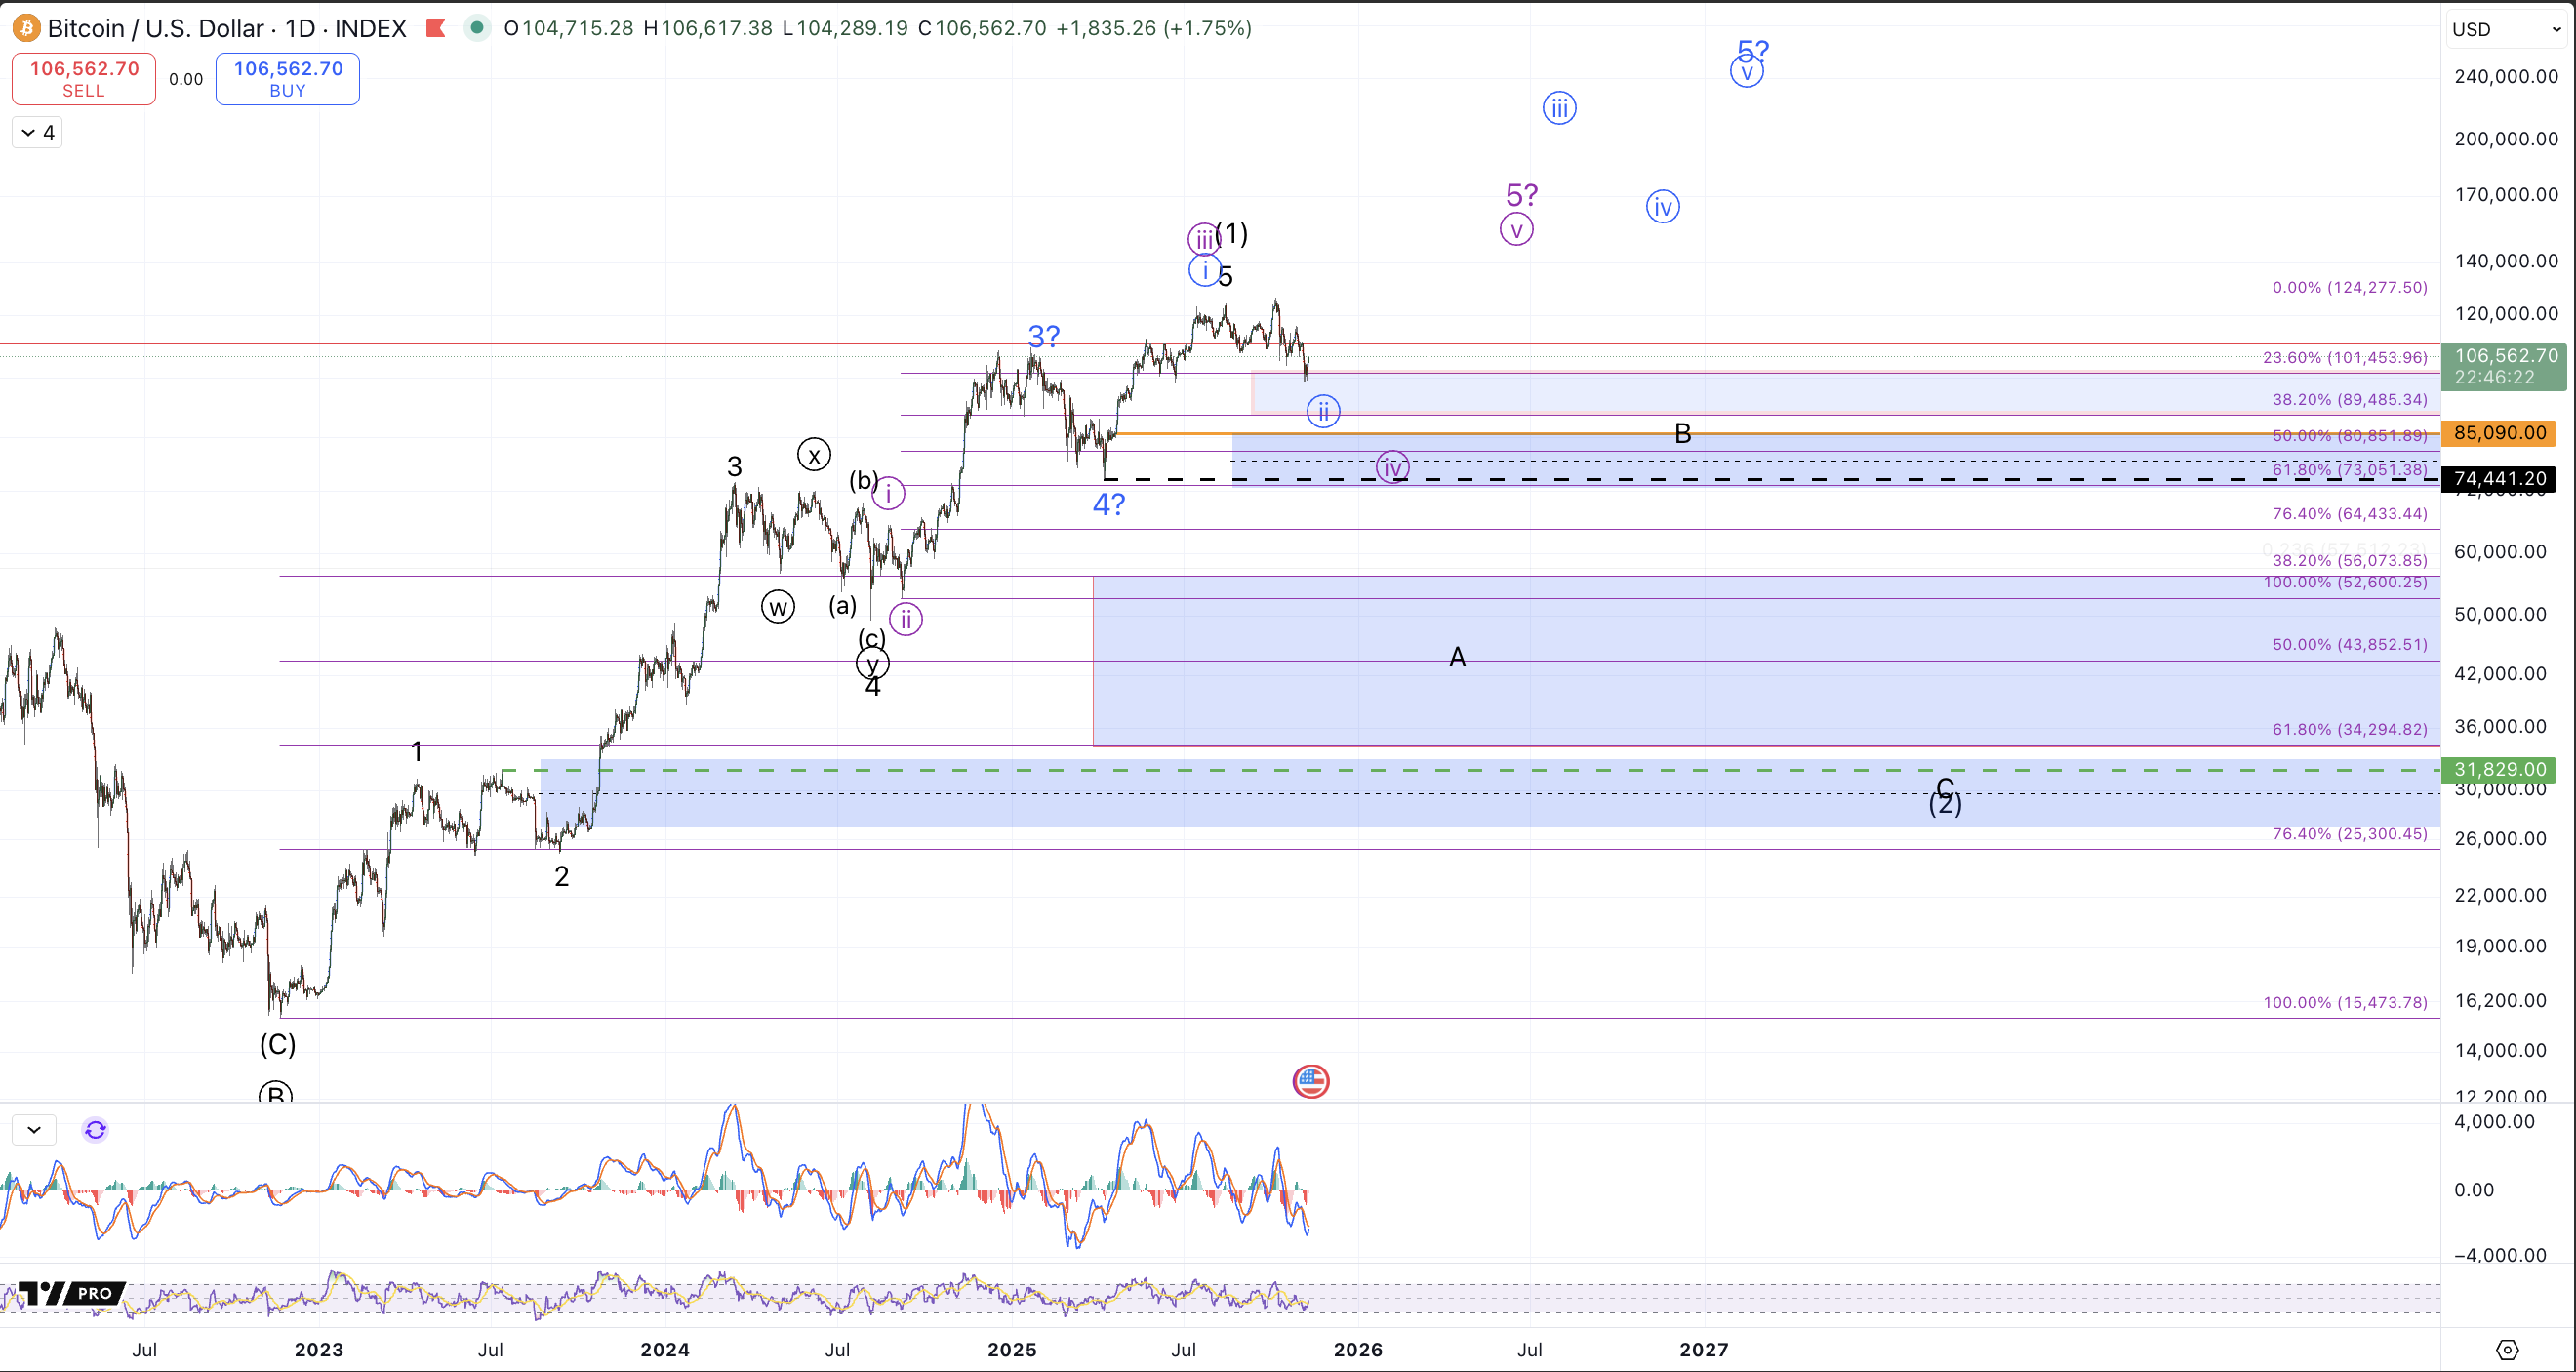
Black: The rally from the 2022 low completed in somewhat stealthy fashion without any sort of climactic top. Price filled in 5 waves and satisfied the $125k target set out in 2022 and is now in the early stages of a higher timeframe bear market to consolidate the gains from the 2022 low.
Purple: (Introduced in greater detail last week) Price is working a pullback with one more intermediate rally to come to complete the cycle from the 2022 low. In the current stance I'd expect this to target $140k-$160k, but that's very reasonably subject to change depending on where a bottom develops in this pullback from the October high.
Blue: Very bullish, price is working on a larger i-ii from the April low setting up a bigger 5th wave from the 2022 low with waves iii-iv-v still to come. Ultimately this would target north of $200k to complete the cycle from the 2022 low.