Bitcoin: Another Detour On The Moonpath
 By
Jason Appel
By
Jason Appel
Bitcoin: Detour on the Moonpath (part II)
Since September of last year, the technical updates on Bitcoin we have provided have focused on various iterations in the expected “path to $100k+.”
Before providing any further commentary, I must note that I maintain my forecast for new all-time highs and price to surge to north of $100k. A more protracted crypto bear market is a possibility, but the technical structure indicates price being much closer to a significant bottom than a lasting top. There’s been no compelling evidence in the action since either of the April or November 2021 highs to indicate Bitcoin is in something worse than a bull market consolidation.
Q4 2021 provided Bitcoin holders, particularly those with shorter time horizons, loads of disappointment. After the initial “$100k” article in September, Bitcoin: Do We Have Liftoff To $100k?, price formed a short bottom and rallied to new all-time highs following our expectations. Unfortunately, this breakout was unsustained, and the big letdown has ultimately come from the aftermath of the failed breakout in November, with prices retreating down near to the summer 2021 lows.
Since that November, sentiments have tanked and fear has spiked amidst bearish forecasts and wild speculations as to what prospective regulatory actions may be, and how those may negatively impact Bitcoin.
This past week, President Biden signed a much awaited Executive Order on Crypto, “Executive Order on Ensuring Responsible Development of Digital Assets.” And, though we’ve seen some intraday volatility, this order did not trigger any larger selloff.
The next upcoming regulatory issue (upcoming as of writing this article on the evening of 3/13) is the 3/14 EU Parliamentary vote on “Markets in Crypto Assets” (MICA). What effects this vote may have on price are beyond the scope of our technical work in Crypto Waves, but it’s worth mentioning that previous regulatory measures aimed at Bitcoin over the years have been unable to tamp down price or demand in any lasting fashion.
Where are we now?
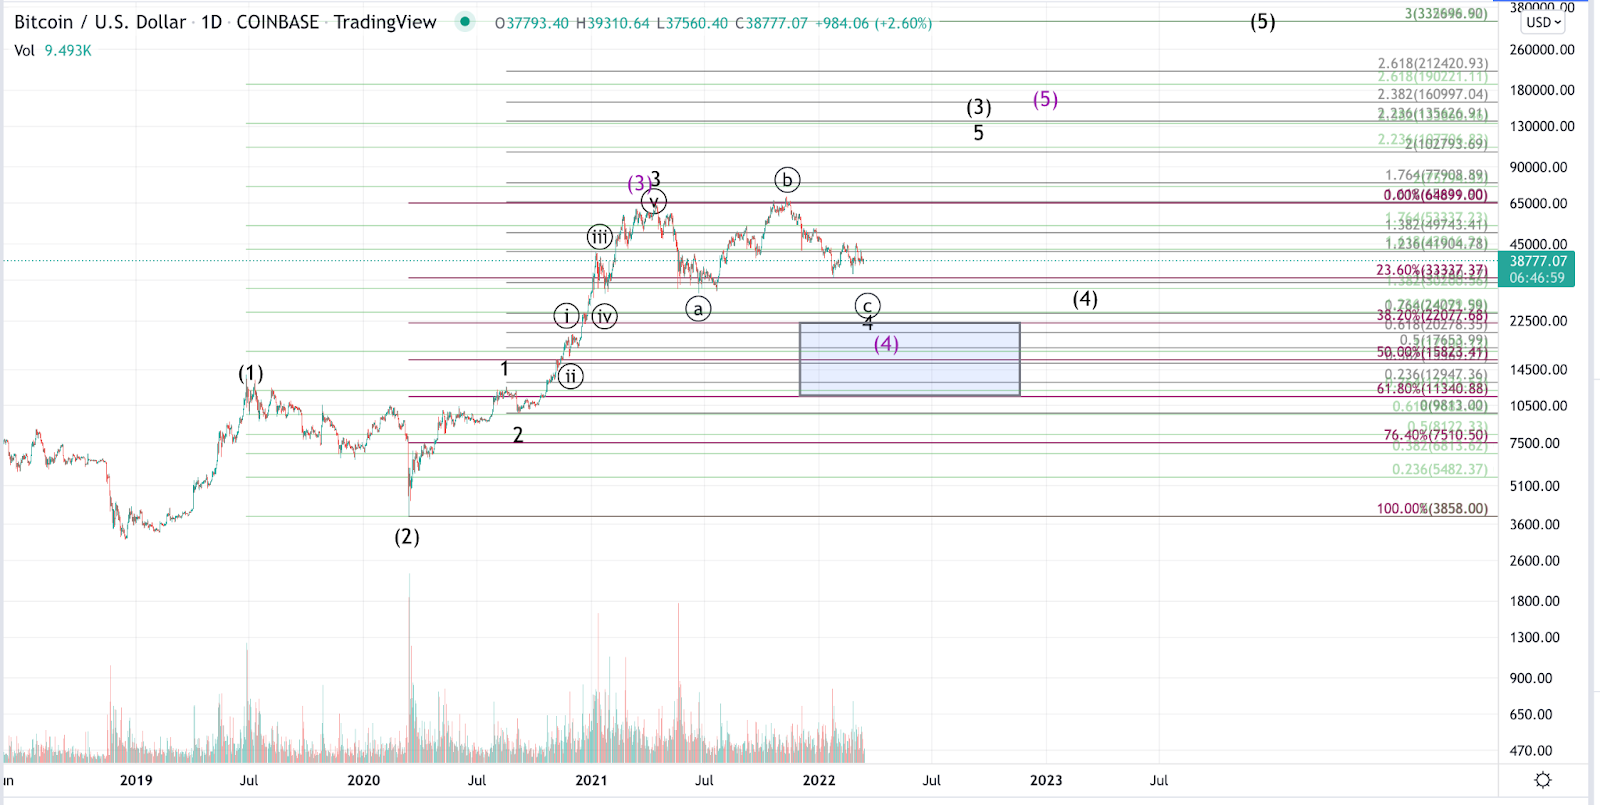
Whereas previous interpretations favored a bottom in place for wave 4, the more recent move beneath the September 2021 lows presents strong evidence for the wider wave 4 flat correction off the April 2021 high. Referencing the December article, Bitcoin: Detour On The Moonpath, the conditions were laid out for the various scenarios, and, unfortunately for Bitcoin bulls, the market appears to be on the most detoured path:
“[Breaking $39.6k]… opens the door to price testing and/or breaking the summer lows to finally test the $24k region we were looking for in July.”
Below is the accompanying chart from the December article for visual reference; price is following the red path.
Thus, the preferred interpretation here is for price to be completing a nearly year-long bull market consolidation, after which, the trend is expected to resume upwards.
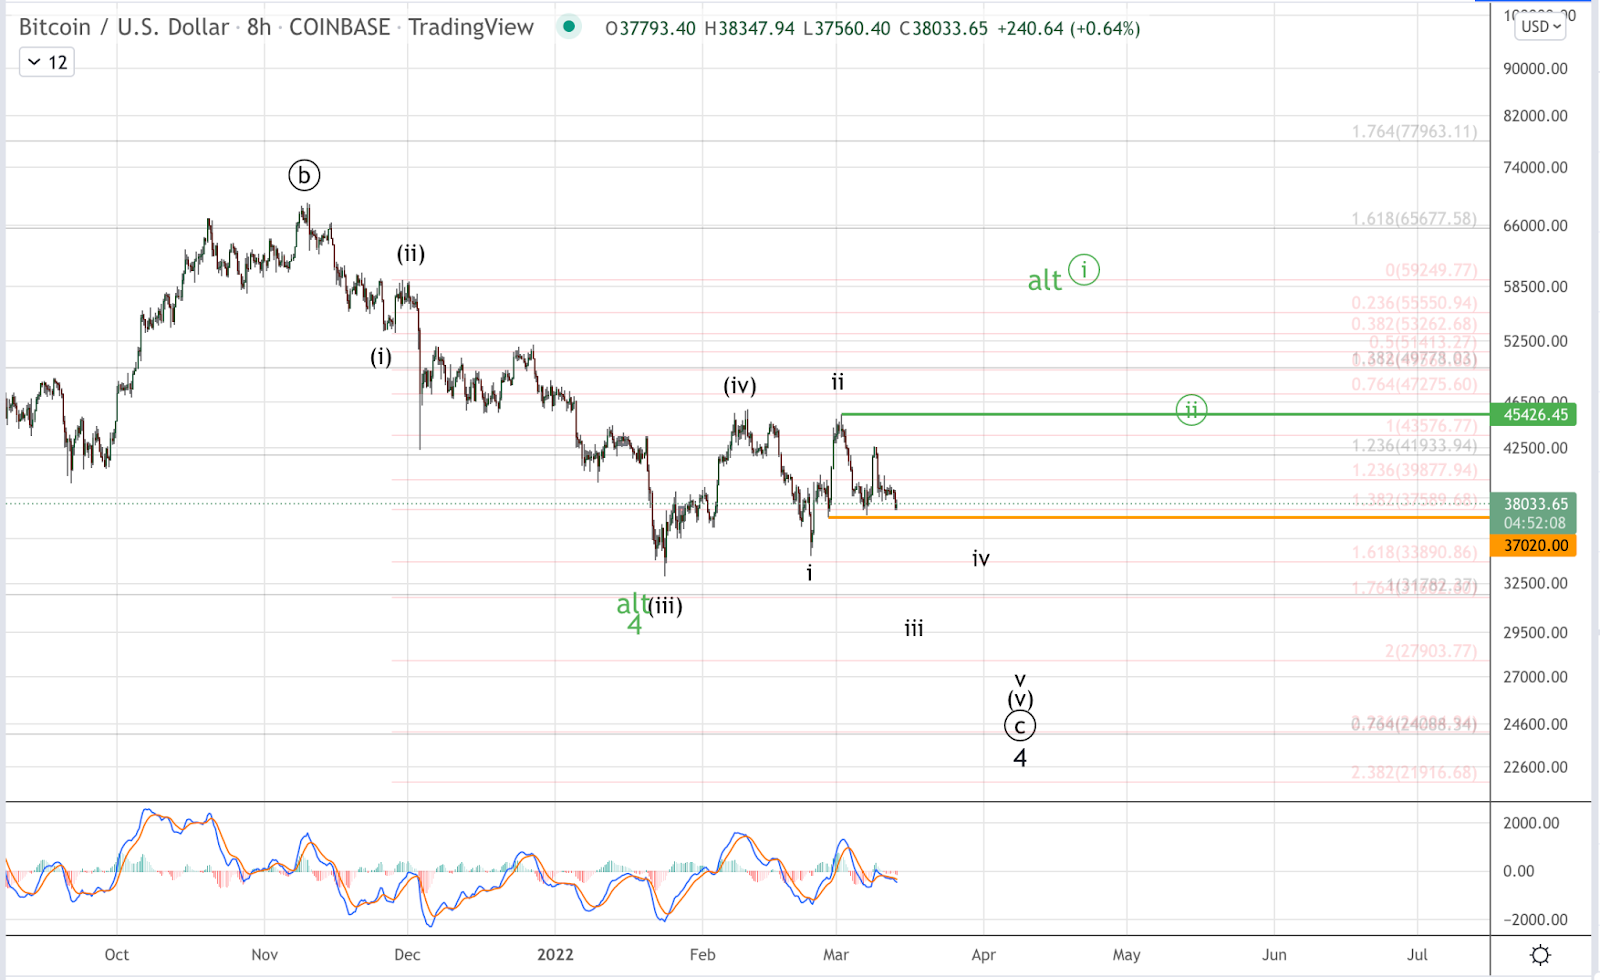
In the very short run (see the BTCUSD 8h chart (above), BTC has yet to reach its larger wave wave 4 target support between the $24k and the summer 2021 lows (approximately $28.8k), nor has it advanced in such a way off the January 2022 lows to suggest a bottom in place. As such, more short term weakness is reasonably likely. Reasonably considering a low to this pullback in hindsight would require a resounding and sustained break above $45,250.
Aside from those who are day trading Bitcoin, any further declines down to $24k can be seen as an opportunity for continued accumulation and dollar-cost-averaging at lower prices. Don’t count out the prospects of seeing Bitcoin north of $100k in 2022. It is exactly from these types of conditions in sentiment that we’ve seen previous large rallies take hold.
“What if $24k doesn’t hold?”
Though this is not expected, it has become important to provide coverage of this prospect given Bitcoin’s detour to the least bullish of our previous expectations.
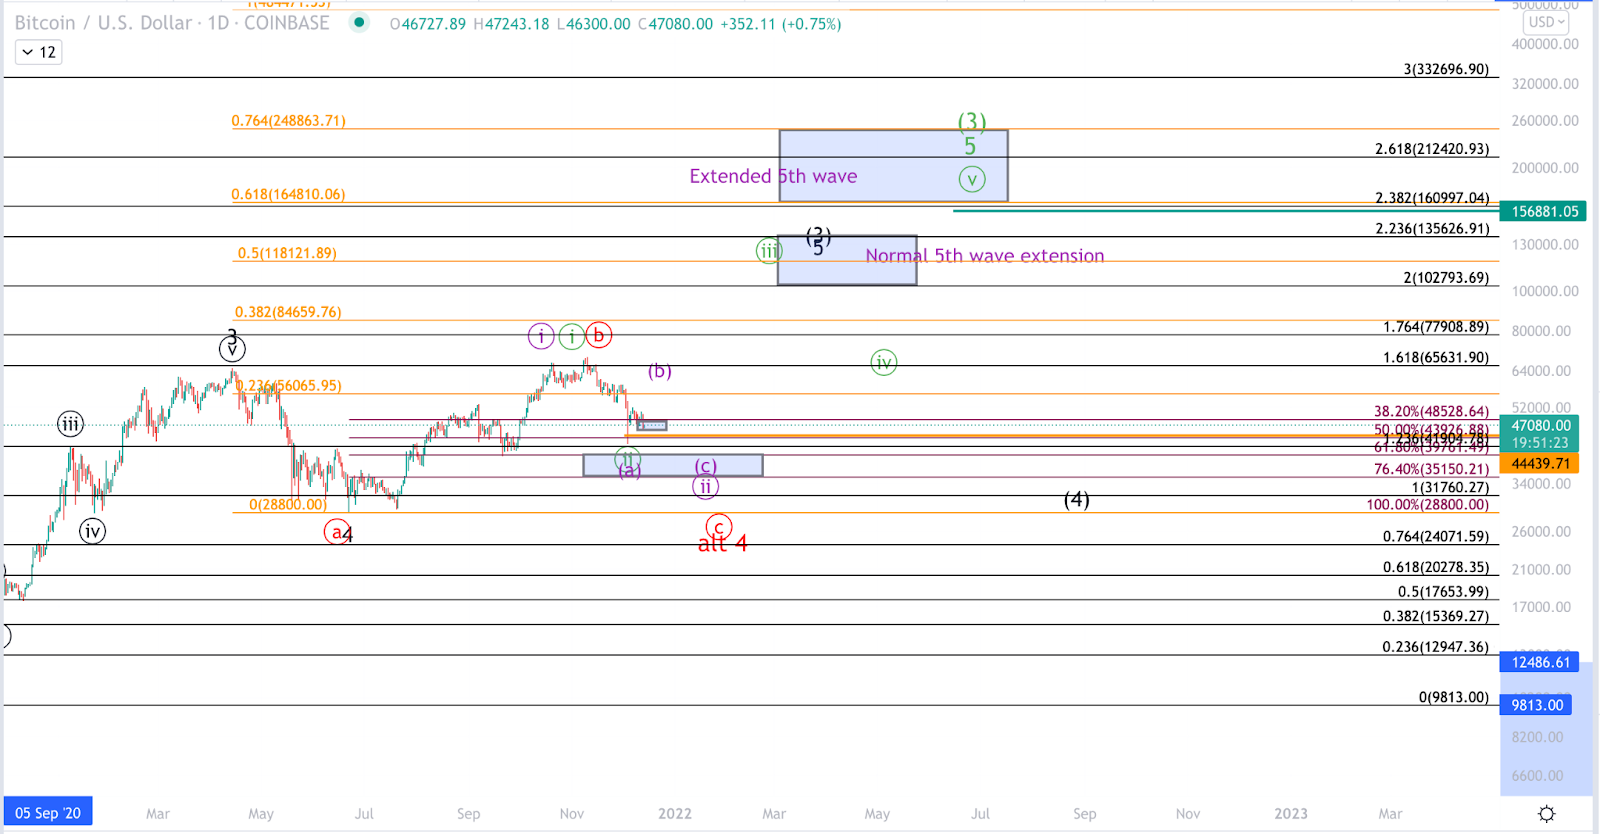
First, a break below $24k does not in and of itself constitute an invalidation of the primary Elliott Wave pattern that has price nearing a bottom in wave 4 of (3). A brief spike through $24k would not compromise the larger pattern so long as price quickly and resoundingly recovers. However, a sustained break below $24k has strong ramifications for the longer term forecasts. Such a prospect would “downshift” our expectations to an ending diagonal pattern originating from the December 2018 lows.
Target support in that case becomes the $11k-$17k region. Objectively, we could no longer consider such a drop a 4th wave in an impulsive move from the 2020 lows. But, as can be seen in the accompanying zoomed out chart, Bitcoin has only 3 waves up from 2018, and so, one more high is still strongly expected to complete 5 waves. In this prospective diagonal, $11.3k is significant support at the 61.8% retrace in log-scale of the entire rally from the 2020 low. That region must hold without any sustained breaks in order for us to maintain any reasonable technical bullish thesis pending a reset down to $3k. This path is displayed in purple labels on the chart, and as can be seen, still portends a rally upwards of $100k. However, should price take the purple path, it’s suggestive of a prolonged bear market following the next major high.
The takeaway here--amidst the various paths presented--is that while prospects of near-term bearish action remain reasonably likely, continued pullbacks are providing opportunity for cheaper accumulation for the ride to the next high. My current rating remains “Buy,” but below $30k, I consider Bitcoin a “Strong Buy.”