Bitcoin: 5 Weeks of Rallying Quickly Nixed and Establishing a Roadmap for the Next Several Weeks
 By
Jason Appel
By
Jason Appel
Bitcoin: 5 weeks of rallying quickly nixed and establishing a roadmap for the next several weeks
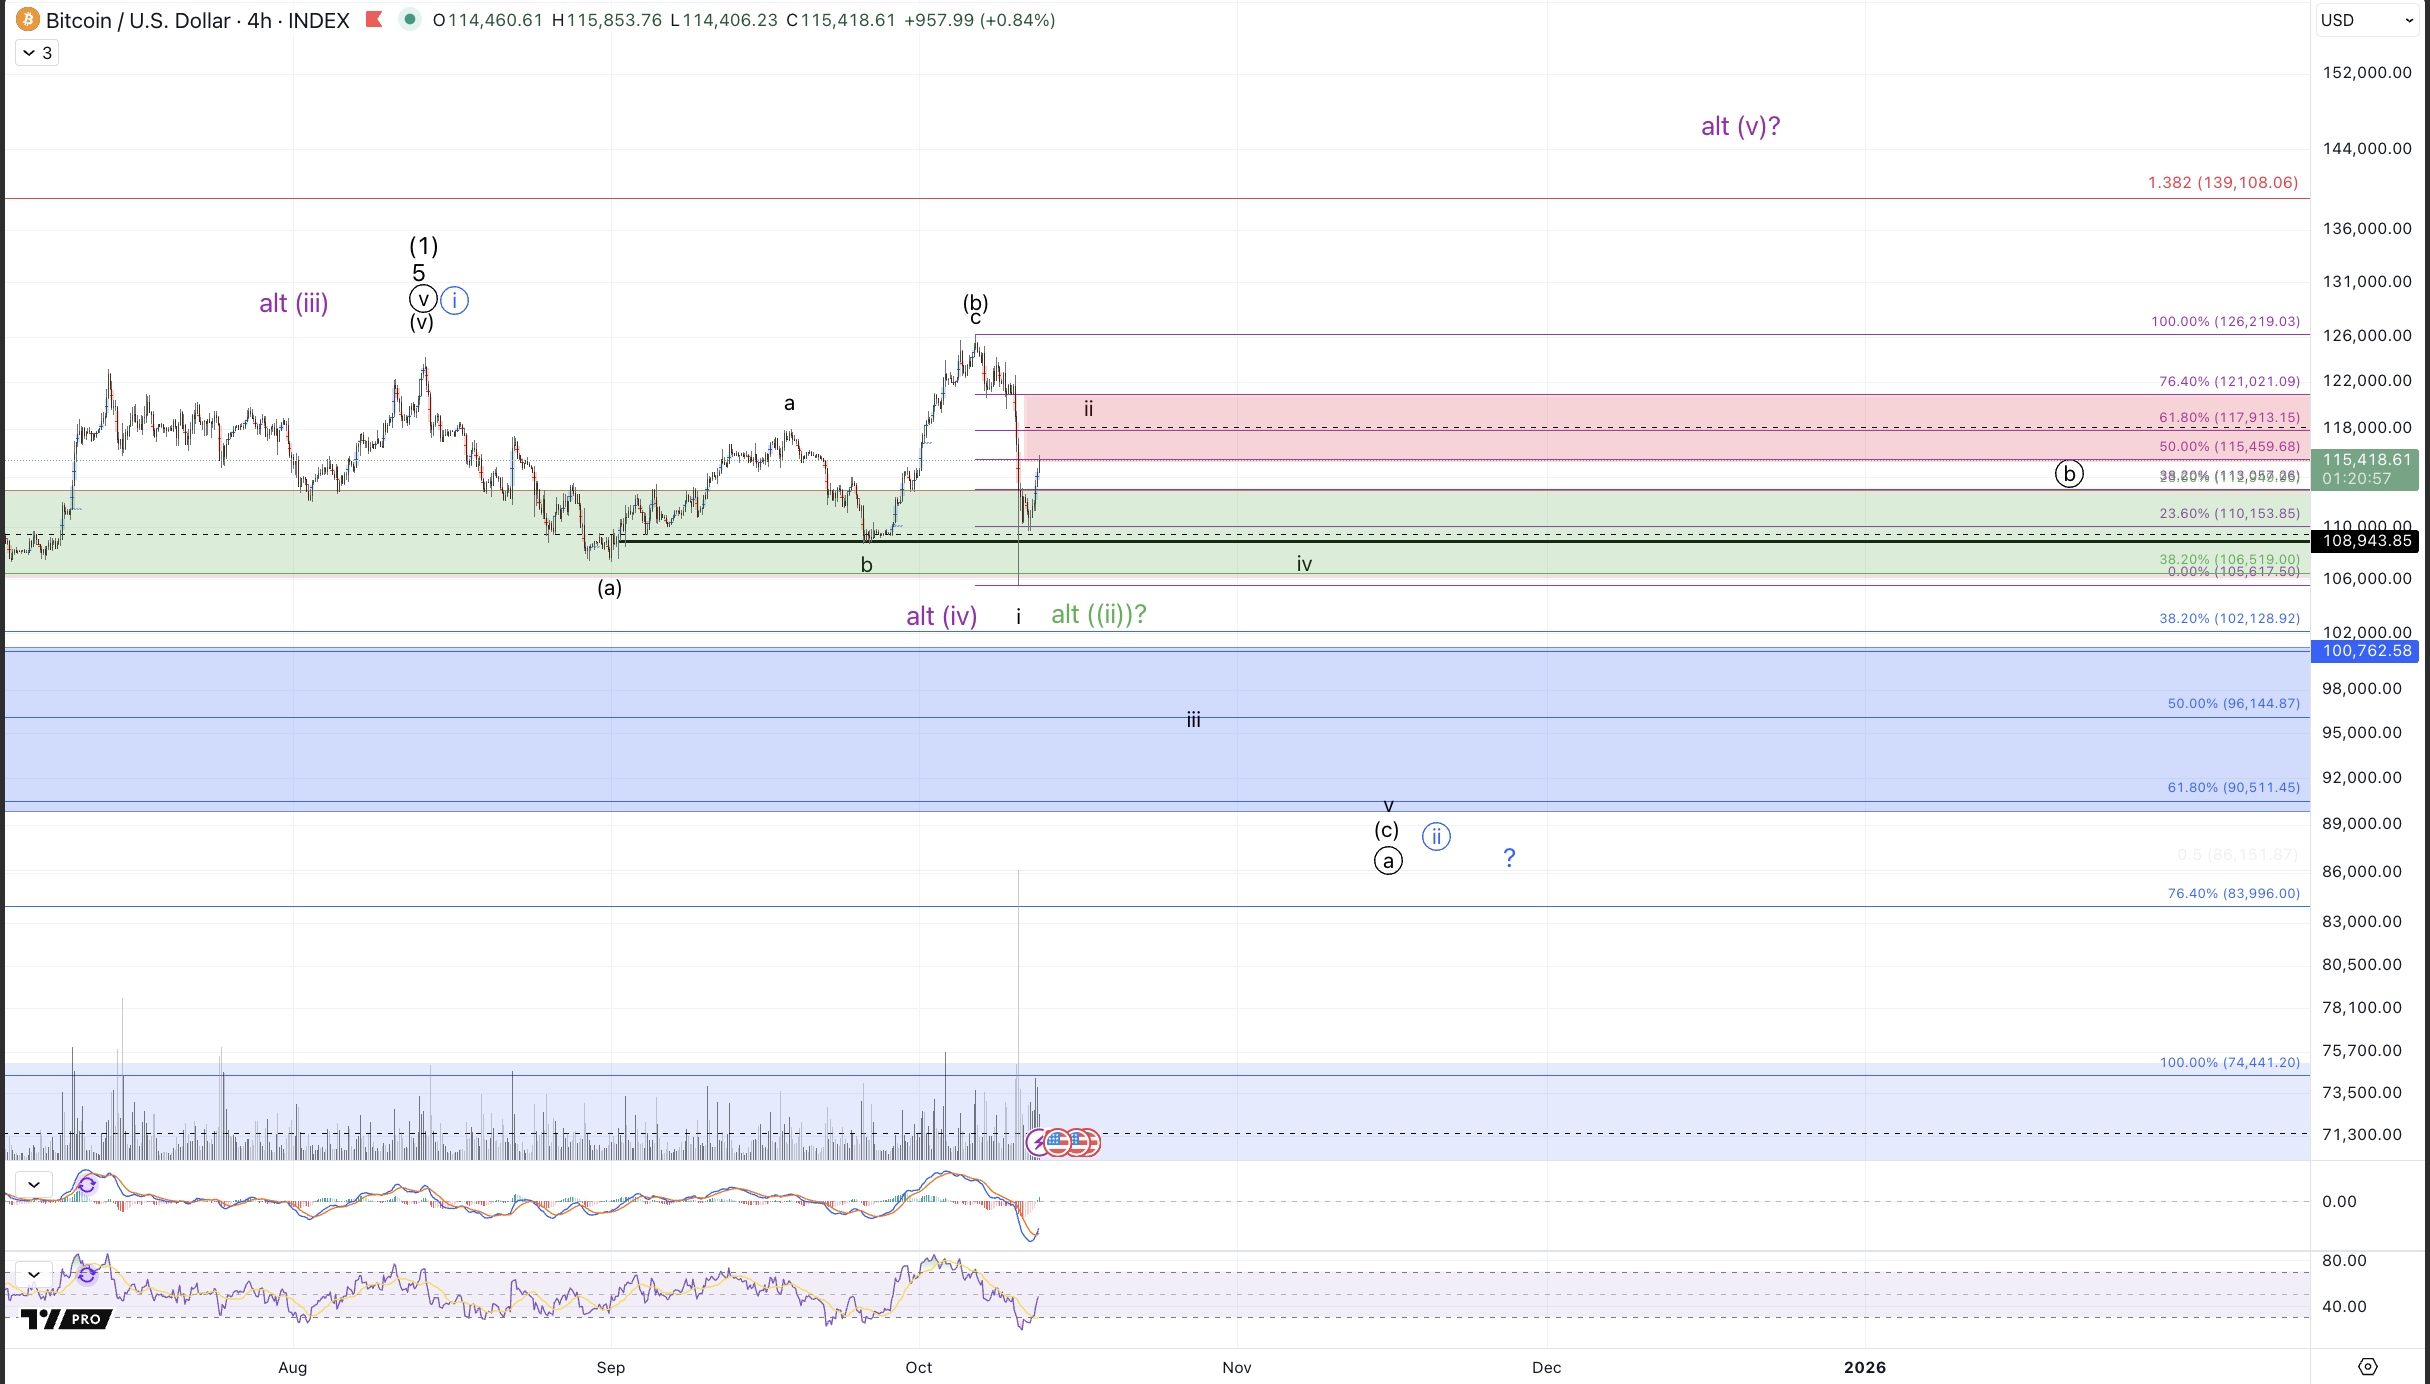
Last week's article discussed Bitcoin's ambiguous stance due to price taking what was described as the lower probability path to new all-time highs vs a more direct trip to test below $100k. Additionally, the new all-time highs were not clearly rejected (initially) nor did Bitcoin resoundingly maintain the new highs.
While we have gotten clarity that the current all-time high was not part of a new motive subwave, the manner in which Friday's flash-crash developed has left price once again in a relatively ambiguous posture. I'm going to describe what I see as the most reasonable roadmaps for the next several weeks with accompanying commentary describing my subjective view of what's most favorable and I'll also describe the conditions for each path to become more or less likely or to potentially invalidate.
The most immediately bullish path (green):
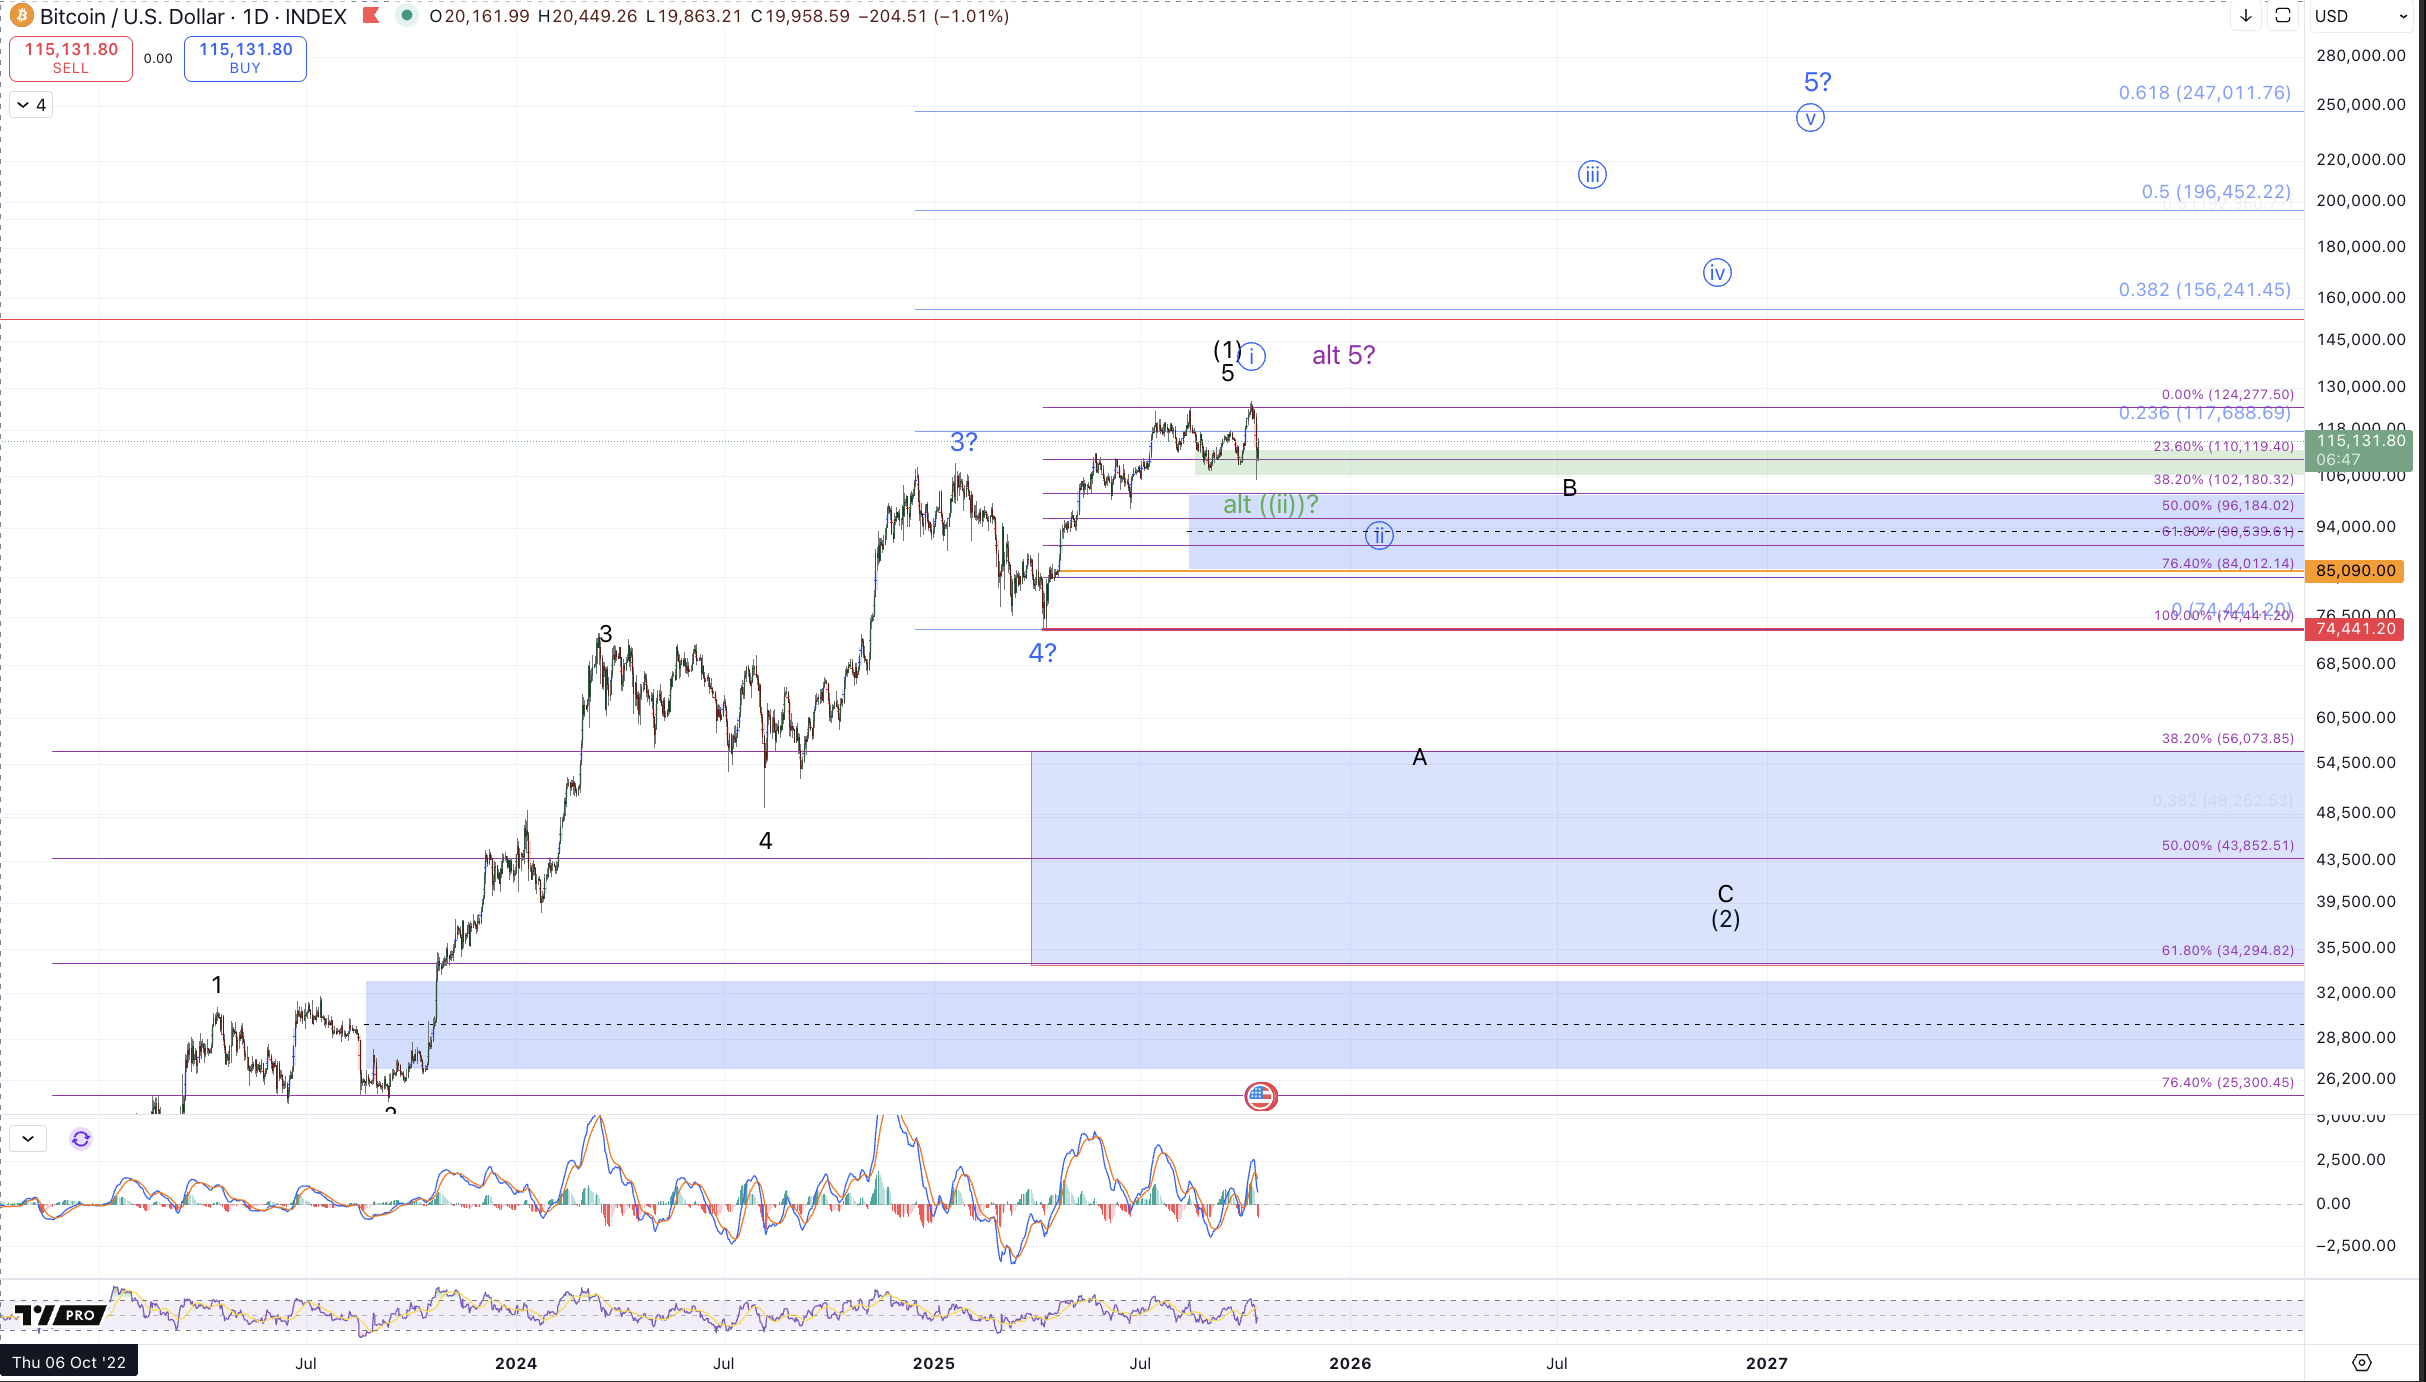
For several months now I've been entertaining that the rally from the April lows is an initiation of the 5th wave from the 2022 low rather than the terminus of the entire cycle. This path has been shown on the larger degree charts in blue. It considers a micro 5 up from the April low to the August high as wave circle i of 5. Now, consider the subsequent action from the August high: a corrective move down into the beginning of September, a 3 wave corrective rally which expanded slightly above the August high, and most importantly, a crash last Friday which took price back just beneath the September low before immediately bouncing. This can very well be all of the wave circle ii as an even more bullish variation of the blue count. In other words, this count entails all of wave circle ii having completed at Friday's low and price gearing up more directly for a run to $200k+ but without the test of the $85k-$100k region that the blue count suggested. In order to embrace this count as the primary one, I'll need to see a clear 5 wave rally develop from Friday's low to $130k-$147k which would function as the wave (i) of circle iii. Should this count come to fruition, it could reasonably target $300k!
As immediate as green but less bullish path (purple)
This count has the exact same setup as the green count described above with one notable variation: instead of the "clear 5 wave rally develop[ing] from Friday's low to $130k-$147k ...function[ing] as the wave (i) of circle iii," the same rally would be a terminal move for a bigger 5 waves up from the April low and as such would function as the wave (v) of circle v of 5. This count has some issues regarding the size of wave (iv) in propotion to the rest of the structure from the April low but entails a more conservative view where the next prospective extension to new all-time highs terminates the cycle from the 2022 low rather than providing an intermediate setup for much further extension higher (as the green count suggests). Additionally, as has been noted in previous updates (where this path was noted as the green count) price has maintained support for a wave (iv) in the rally from the April low.
Discerning between green and purple will ultimately come down to how price reacts from a completion of a prospective 5 wave rally into the noted $130k-$147k region. Purple will ultimately require a break back below Friday's low (after a run to new all-time highs) and green will entail pulling back to a higher low (above the Friday 10/10 lows) and then taking out the high of the move to $130k-$147k.
A more circuitous but very bullish path (blue)
This path entails continuation down from the recent all time highs to the $85k-$100k region that's been forecasted for several weeks. Like the green path, this count considers the all-time high a (b) of circle ii but unlike the green count this path favors Friday's flash crash to have merely terminated wave i of a larger (c) of circle ii in development. Resistance for wave ii for downside continuation is $115.5k-$121k and the blue count posits that price will fail at this resistance region and head back below Friday's low and below $100k filling in a bigger (c) wave which should likely target the lower portion of the wave circle ii bull market support, approximately $85k-$88k, tbd, depending on where wave ii tops. Though I've written about this count extensively in the past several weeks, I'll recap that the blue path entails price finding support in the $85k-$100k region and then extending up to fill in waves circle iii-iv-v targeting north of $200k in this cycle. Based on the recent action I've come to view this path (ever so slightly) as the most favorable
The Bearish path (black)
In this path price has topped, completing all of the motive subwaves into the August high and expanding slightly in the (b) of circle a of A of (2) in the October high to tag the bull-market target officially exceeding $125k, without qualification (as discussed last week). This count now has some issues. Though not impossible, I'll note that it's rather atypical to see an expanded (b) wave that's a subwave of a larger a or A wave correction. Generally when expanded flats occur, taking price above the motive wave high after an impulse completes, it occurs in the b wave of the larger correction. In other words if the larger black labeled (1)-(2) is correct, a typical expansion within a b wave, would occur in the B of (2), not the (b) of circle a of A. This nuance does not rule out the black count but it does cast some reasonable doubt on the prospect that the entire cycle from the 2022 low has completed. As can be seen, this path would entail, like the blue count, continuation down to the $85k-$100k region. However, unlike the blue count, this path entails merely a corrective bounce from that region which will fail to make new highs and instead turn down and take out the April low, $74.4k confirming the completion of the rally from the 2022 low.
Despite the large bounce already from Friday's low, the rally appears corrective structurally and there's a ton of resistance to break. Instead, I favor this rally to be corrective, filling in some of Friday's imbalances before continuing lower. That said, I would not be surprised whatsoever to see price stretch up to the upper portion of resistance north of $120k before turning down.
From a trading standpoint, even though I'm now favoring the blue count, I still am going to be viewing this market very conservatively meaning that I will want to see a compelling reason to belive in further extension of the cycle that began in 2022. That means if the purple count plays out, I don't see a good prospect of participation other than for day traders / scalpers / and short term swing traders. Should price exceed the immediate resistance provide extension up to $130k-$147k, we'll need to see how the pullback is developing to evaludate in real time the quality of prospective entries to play for the green count's path.
Regarding the blue count: I see modest entries below $90k as a reasonable play considering risk / reward so long as one is to heed a break of $74.4k as evidence that a larger bear market is underway. That said, I see the best strategy for playing for upside to be some moderate entries around or below $90k and then waiting to see if price provides an impulsive reversal, at which point higher lows can be purchased on a retrace to play for the 200k target. The rest of 2025 should likely give us an answer as to which path price takes.