Bigger Downmove Setting Up
 By
By
In last weekend’s update, I wrote:
I think we have begun a bigger correction in price off the top. We may have completed ‘a’ down last week are have begun a ‘b’ wave up… or there is a little bit left in the ‘a’ to complete. Regardless, I think this correction off the top lasts for a few weeks before we are ready for the next leg up. 2640 area for the whole correction to complete would be my base case at the moment…. as long as we stay below 2800. Above there, a blow off move to 2875-2900 would be on the cards.
Wrong on this idea. Market did a great job of whipsawing me last week before making a run for the highs. We went above 2800 on the S&P 500, so this put the last part of the outlook above into effect -- a blowoff move to 2875/2900. We did make a quick long trade in the smart money room on QLD last week so no complaints.
What's next?
In my room, last week I shared several charts last week on how we have seen post-quarterly opex corrections over the past year. I suspect this time too will be similar. A couple of these charts are shown below: the last 4 quarterly opexes. Note how every single one of them has a correction soon after.
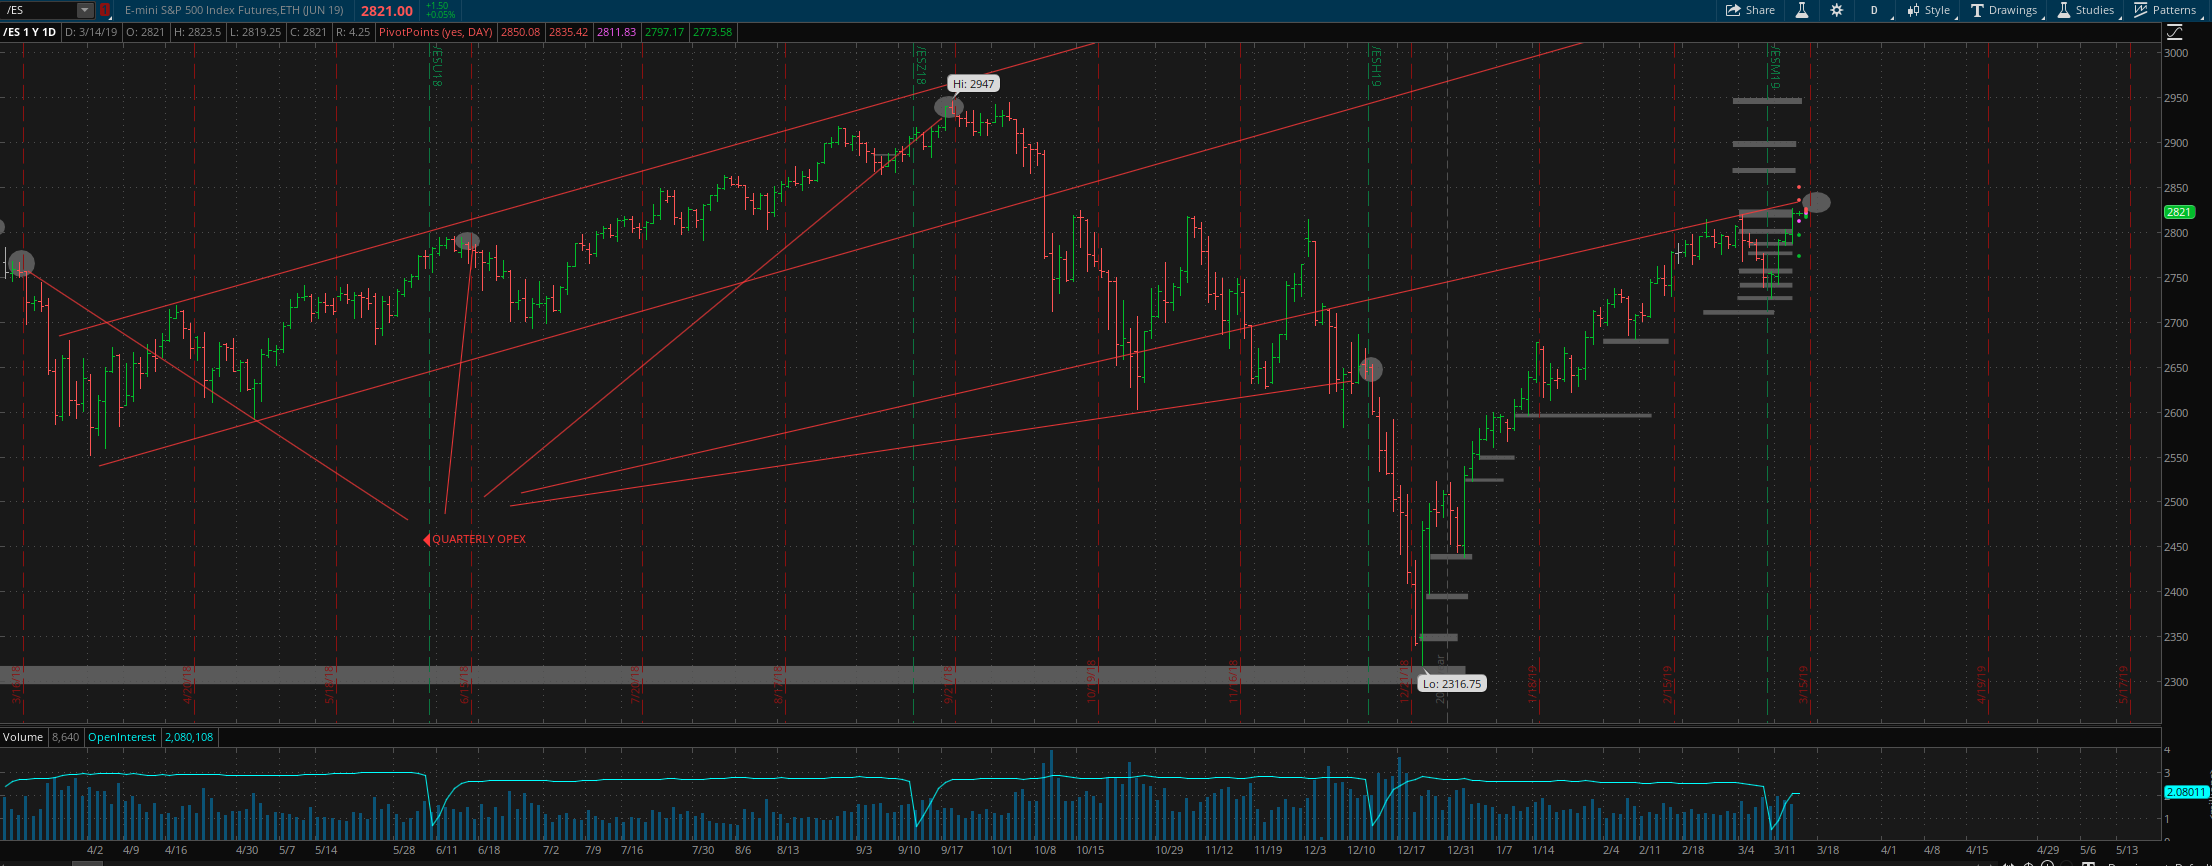
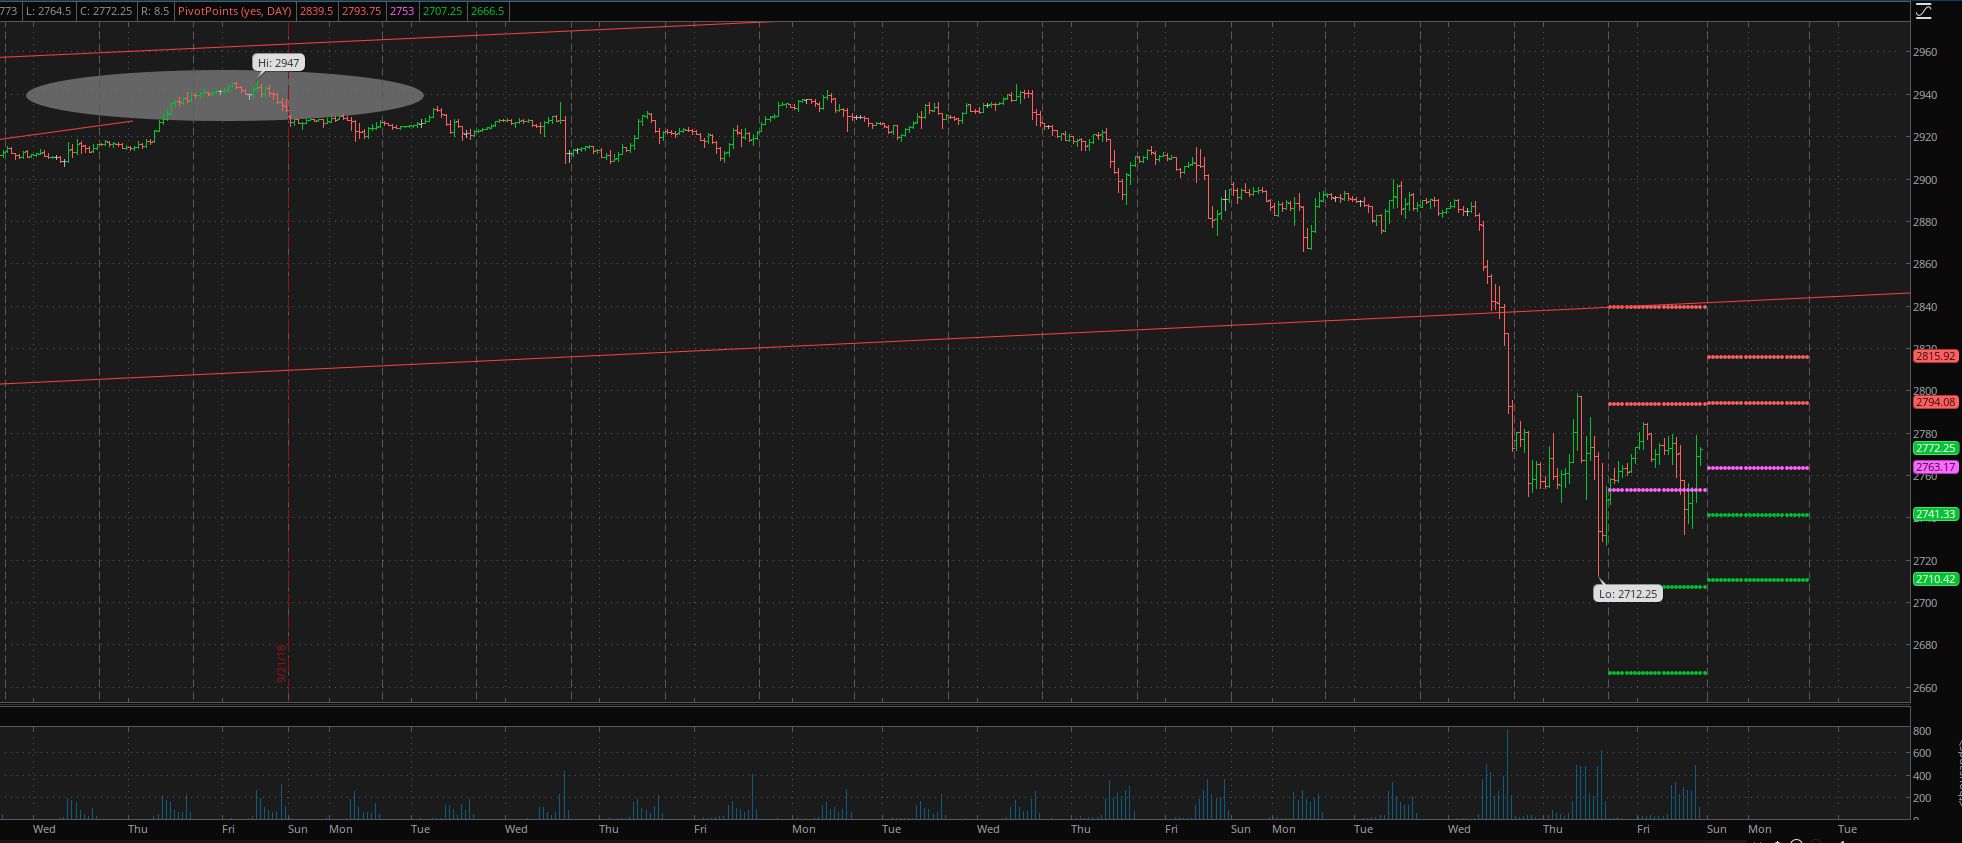
I think, however, we might hold up for a few more days before rolling. Here is a close-up of Sept 2018 quarterly opex. I think it is possible for us to follow a similar script to this. The circled high at 2947 happened right at opex and we held up for around a week and a half before rolling down hard.
Most likely we continue the minor pullback that started on Friday for 1-2 more days, set a low and move higher into coming week Friday for either one more higher high or a slightly lower high. This does not have to happen, but I think it has decent odds before the bigger pullback begins.
Regardless, the current upmove is getting long in the tooth and a bigger down move is very close in my opinion. Whether it happens right away or after one more high is the question. My bias is for one more high near the 2865 area before lower.
Regardless of whether this happens on not, I have no plans to short the market unless my NYHL1M indicator gives a sell -- it has kept me on the right side of the market since Jan 14th, so no reason to not continue trusting what it is telling me.
ES Grey Zone areas - On the upside, first resistance comes at 2836-41 and then at 2865-70. On the downside, we have support at 2826-20 and then 2810-2804. 2800 area needs to hold for the current leg higher to continue. Break of that will be the first sign that a bigger correction has begun.
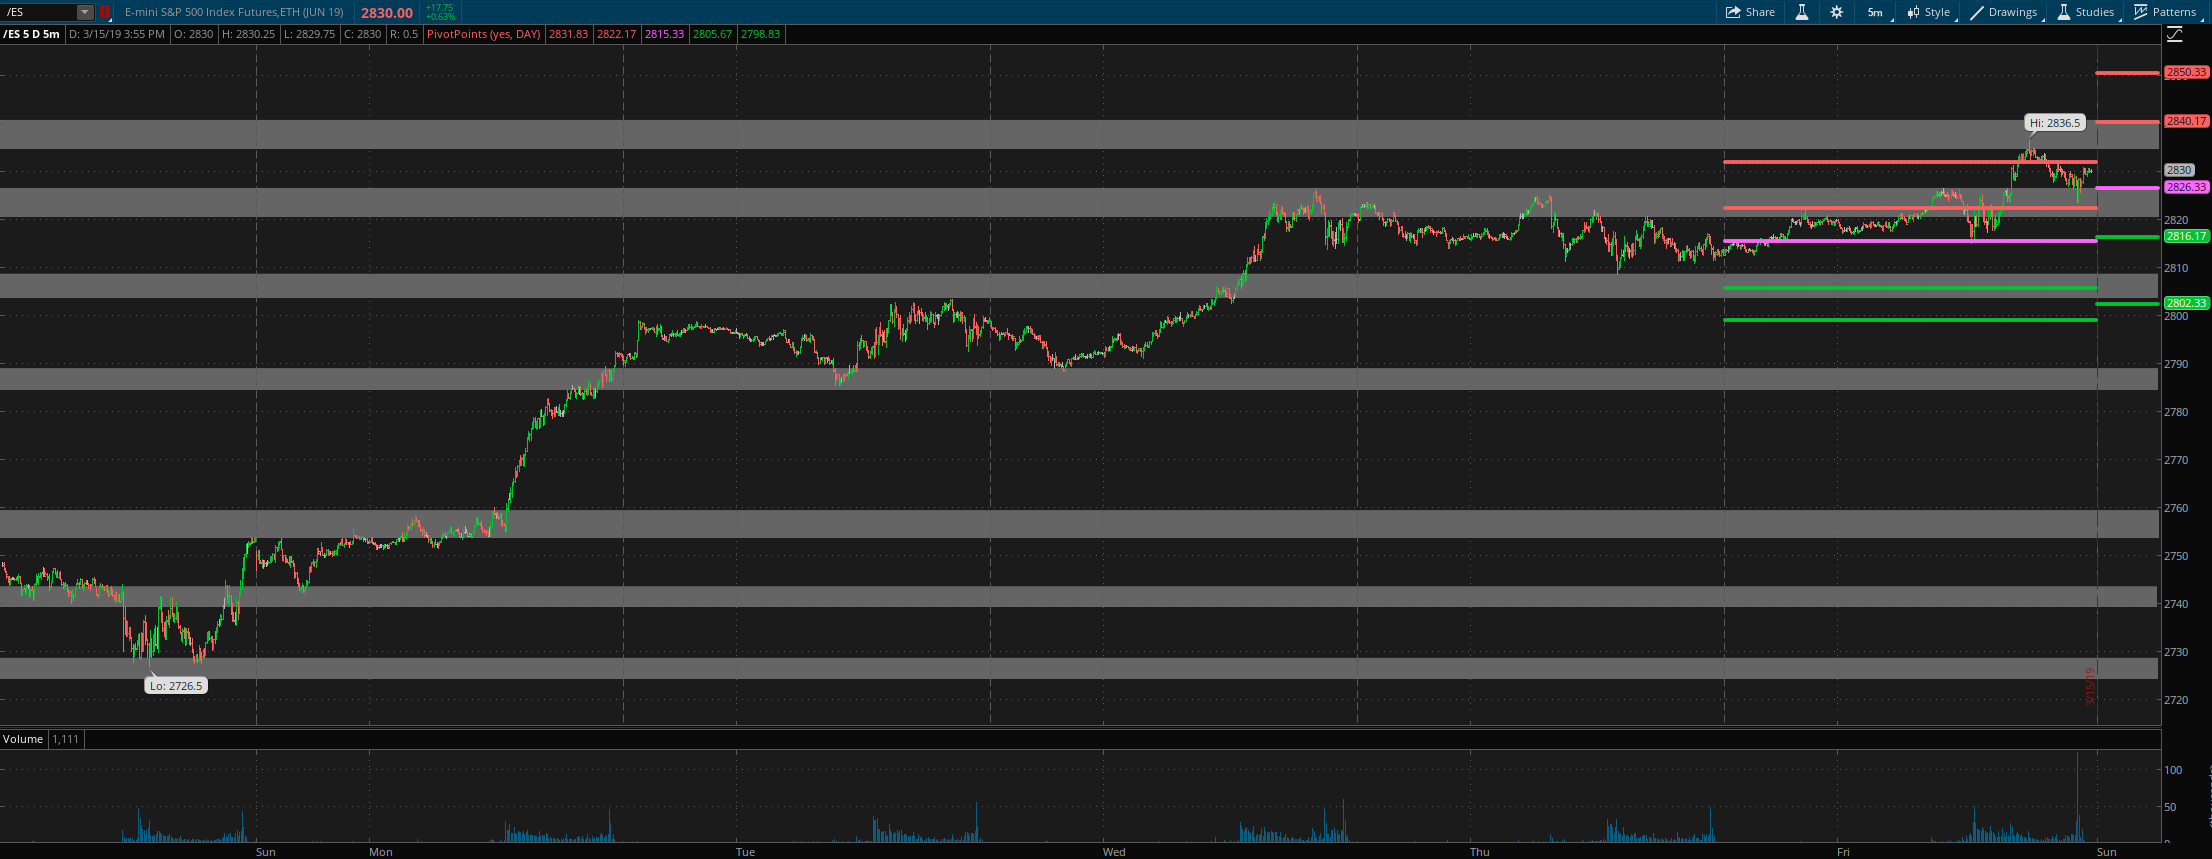
ES daily pivot is at 2826. Resistance R1 is at 2840 and R2 is at 2850. Support S1 is at 2816 and S2 is at 2802.
All the best to your trading week ahead..
