Bigger Correction in Price Off The Top
 By
By
In last weekend’s update, I noted that we hit the major resistance zone, pulled back, took support at the 2780/75 area and went right back up to close near the major resistance zone. Nothing much given to the bears.
I wrote: "So the same idea from last week remains valid here maybe more so this week.. There should still be many stops placed right above the 2812-25 zone…. it would be just like the market to take them out, remove a majority of shorts out of the equation… a short covering rally lasting 50-60 points higher… and THEN reverse for our bigger pullback. On Friday, we backtested a small triangle breakout… this triangle gives us a target of 2840-50. Get through the 2812-25 triple top zone will open up 2850 first and then the 2880-2900 zone opens up. From one of these areas, we should finally get our bigger pullback started."
I was wrong about the idea that we might be able to breakout of the 2812-2825 triple top zone. Market tried, could not, and failed hard from there.
What's next?
My thought that we would get through the 2812-25 zone this time turned out to be wrong. Readers might remember for a long time, my base case was that we would NOT make it through triple top resistance without at least a pullback. I changed my mind on this two weeks back because of strength in a lot of my indicators, and well, it would just be evil to get above, stop out shorts, and then reverse. But the market could not sustain for much time above 2800 before gravity caught up.
So what next is the big question. I think we have begun a bigger correction in price off the top. We may have completed the ‘a’ wave down last week and have begun a ‘b’ wave up… or there is a little bit left in the ‘a’ to complete. Regardless, I think this correction off the top lasts for a few weeks before we are ready for the next leg up. 2640 area for the whole correction to complete would be my base case at the moment as long as we stay below 2800. Above there, a blow off move to 2875-2900 would be in the cards.
Some charts from the Smart Money room:
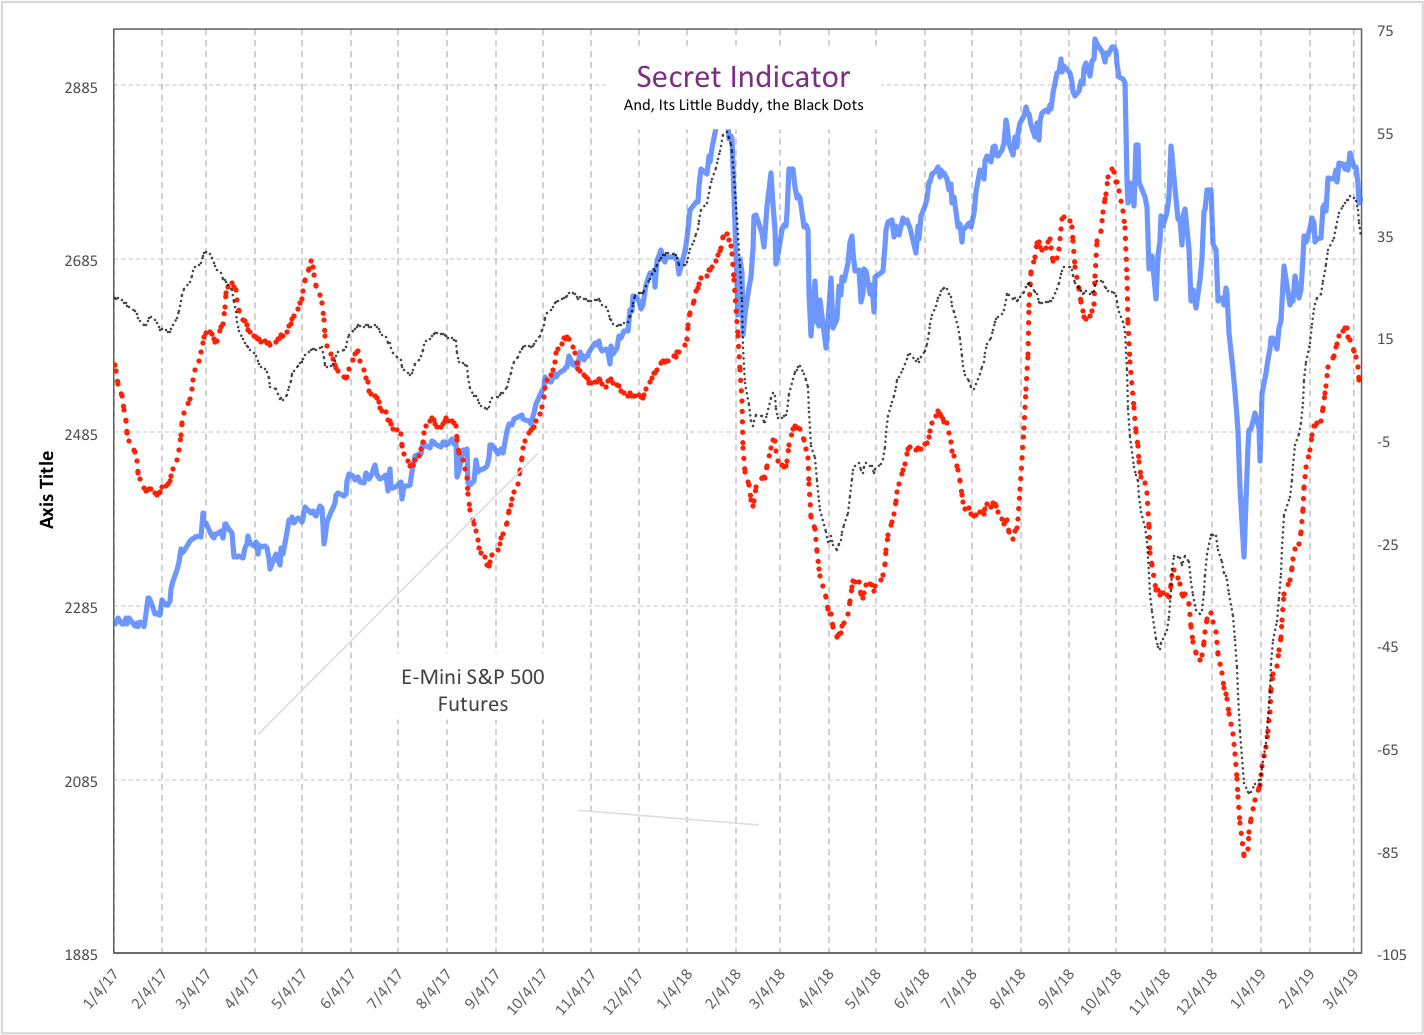
Secret indicator combo - Trend DOWN : The secret indicator and the black dots continued lower. Trend is DOWN as measured by these indicators. The secret indicator went to a sell on the 5th of March at 2791 ES.
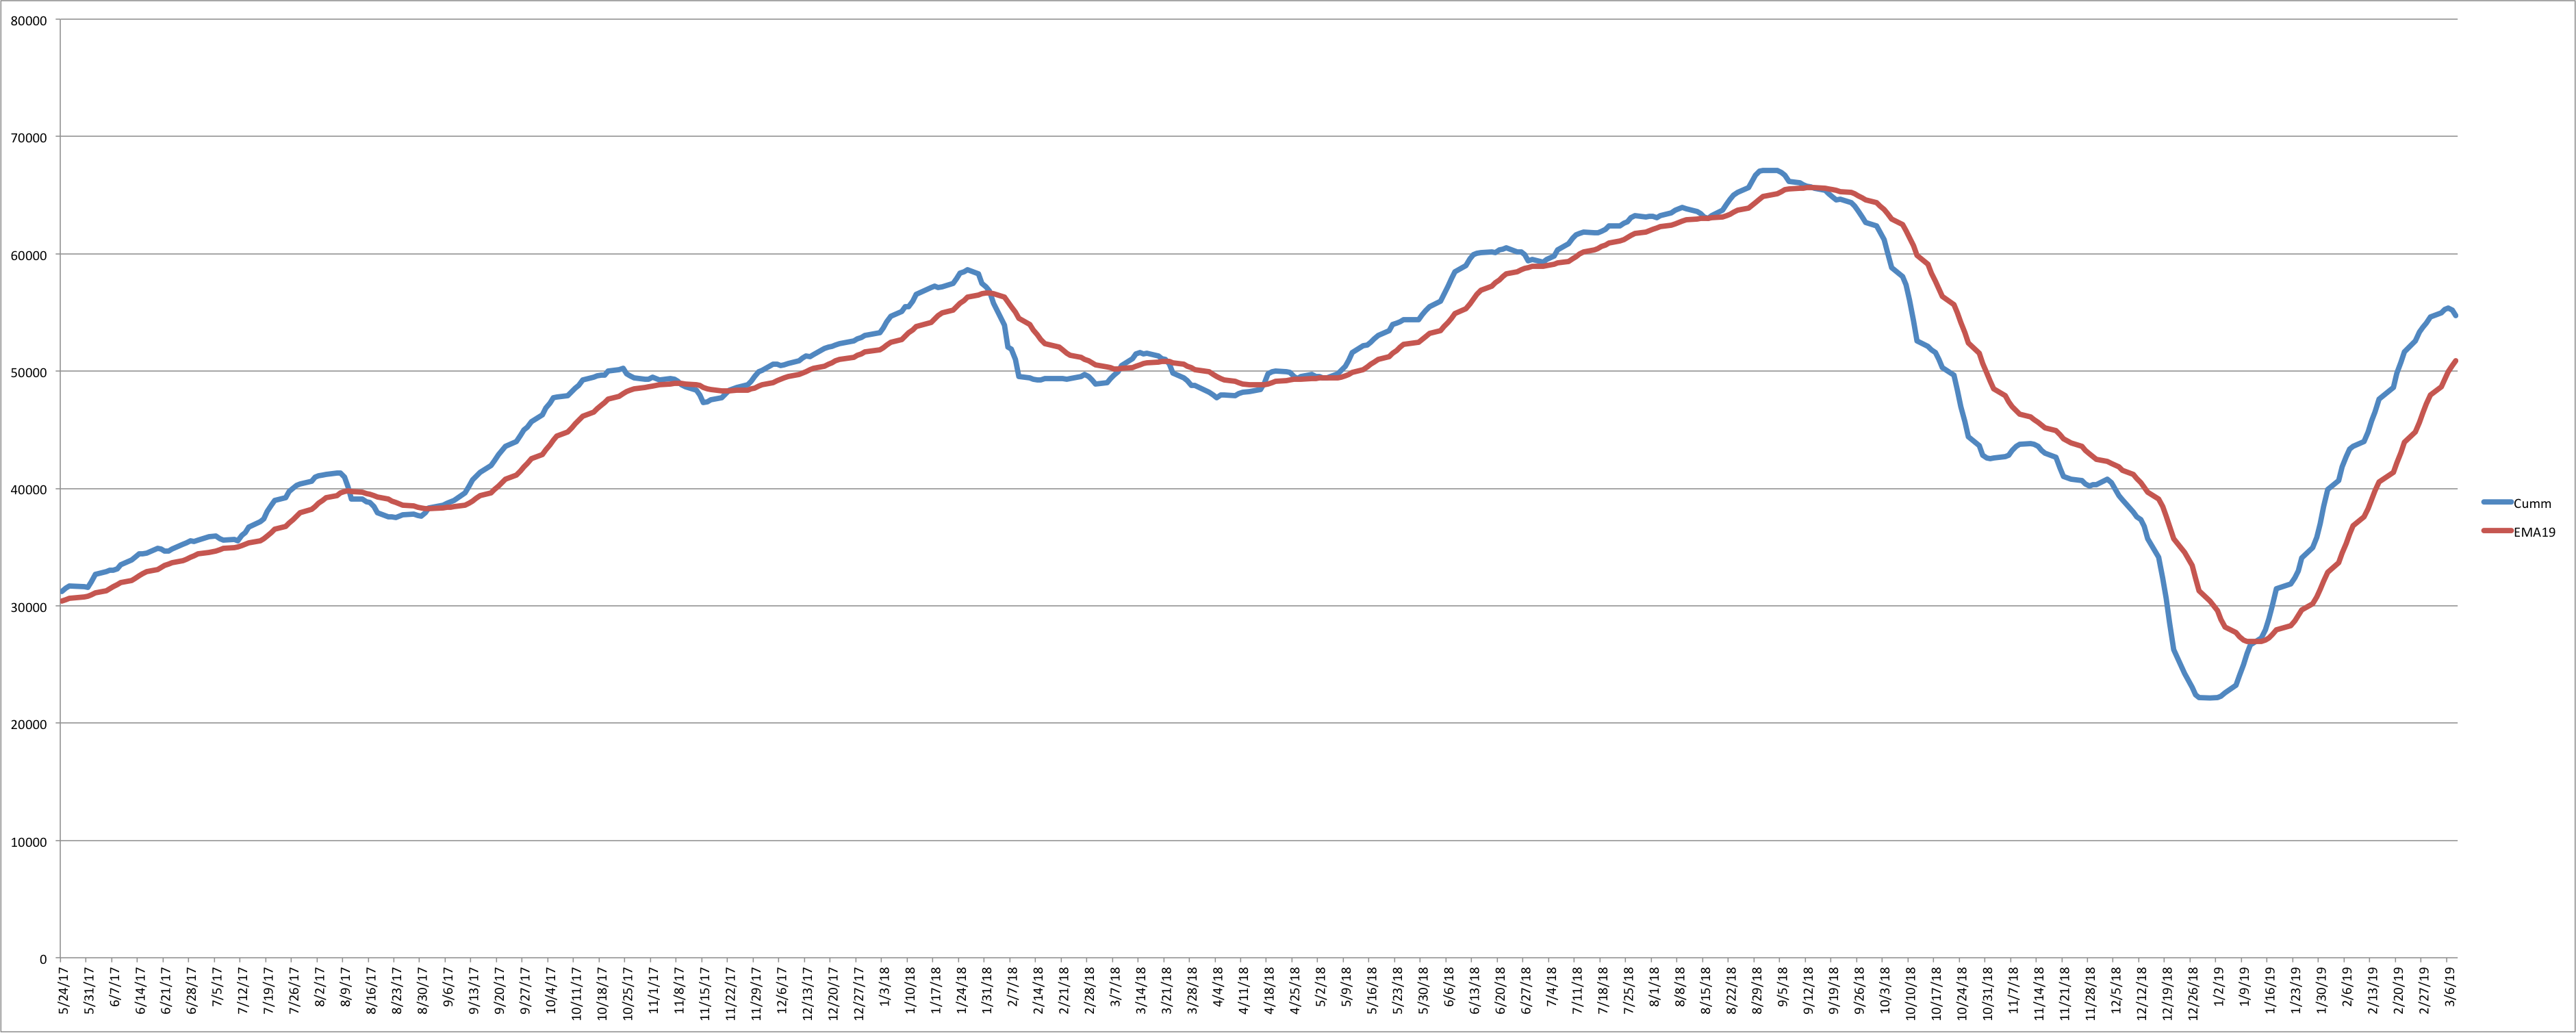
NYHL1M positional setup is still on a buy. Weakness continues to build though. We are still quite a bit away from a sell signal though - I would estimate atleast another week even if a sell signal is on the cards soon.
One question I got in the smart money room is what do we do when the secret indicator combo points against the NYHL1M signal? The only thing to do is hedge until they are pointing in the same direction. I mentioned in one of my posts that even though I had QLD long, when the secret indicator combo went trend DOWN, I hedged the position with some puts. Both of the signals will be back in sync soon enough.
ES Grey Zone areas - On the upside, first resistance comes at 2756-61 and then at 2774-78 and then at 2798-2803. On the downside, we have support at 2728-24 and then 2710-2700.
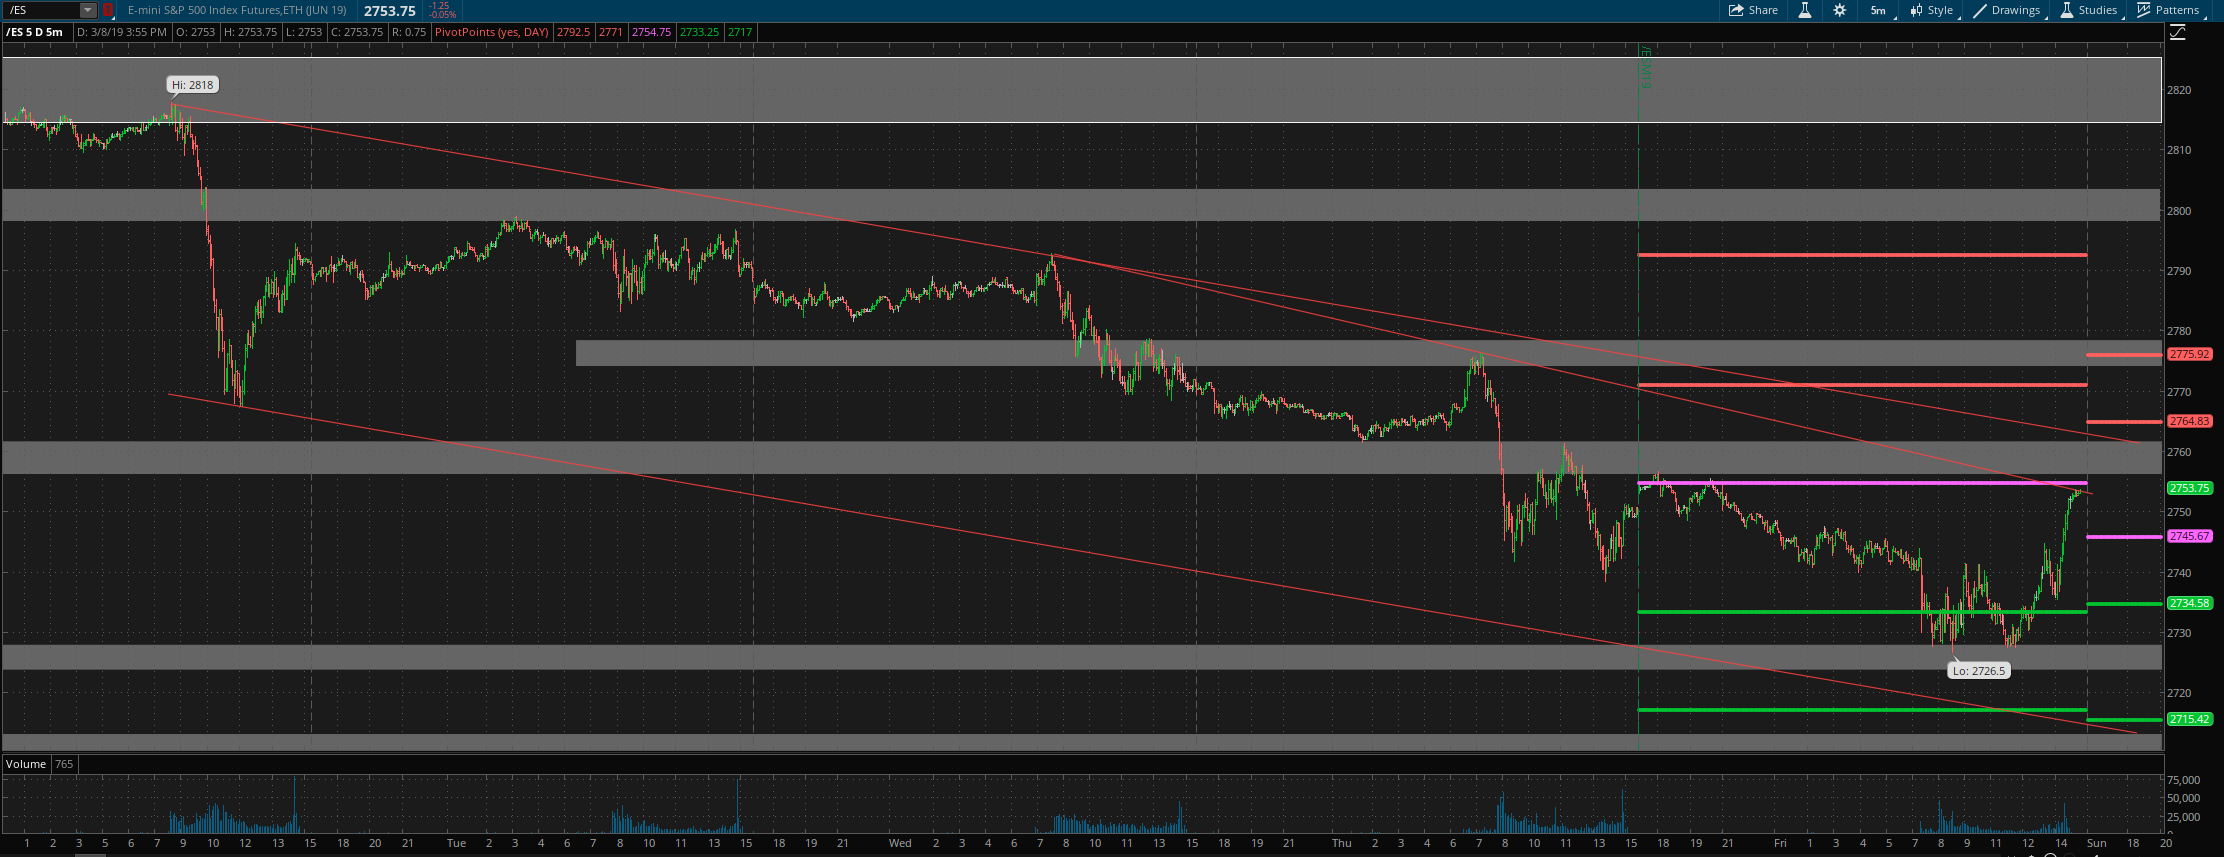
ES daily pivot is at 2745.5. Resistance R1 is at 2765 and R2 is at 2776. Support S1 is at 2734.5 and S2 is at 2715.
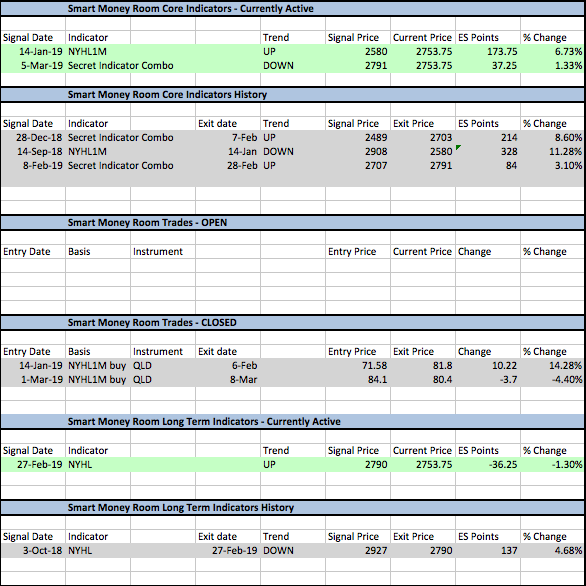
Lastly, since we do not have any active trades right now, I wanted to share the new indicator/trade table being posted daily in the Smart money room…Plan is to put this up as a standalone page very soon within the service.
All the best to your trading week ahead.
